
CoT Report - We Look At What Large Specs, Hedge Funds Are Buying
Following futures positions of non-commercials are as of June 25, 2024.
10-year note: Currently net short 319.8k, down 47.8k.
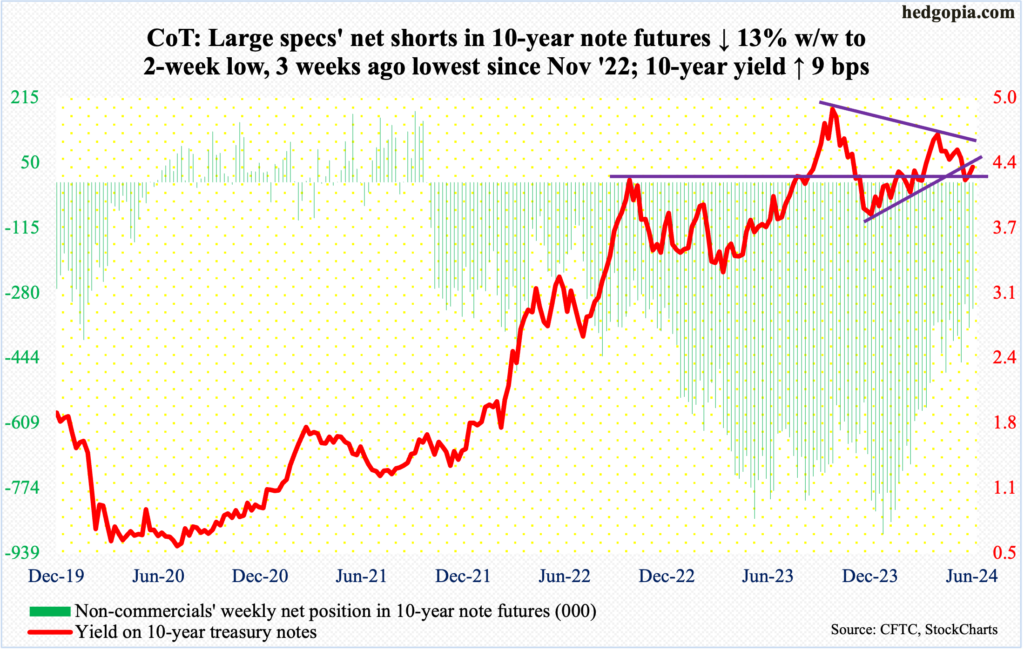
FOMC minutes for the June 11-12 meeting will be out next Wednesday. It is pretty much a given nothing earth-shattering will come out of it. The fed funds rate was left unchanged at a range of 525 basis points to 550 basis points at that meeting. The last hike was last July, with the benchmark rates having lifted from zero to 25 basis points in March 2022. Members this month also went from expecting three 25-basis-point cuts this year during the March meeting to one.
The dot plot’s rates outlook is one fewer than what the futures market is pricing in. These traders are betting there will be one cut each in September and December. Early this year, they expected six to seven cuts. But this time around, they are probably playing it right. Depending on how economic data comes in, one or two cuts this year look probable.
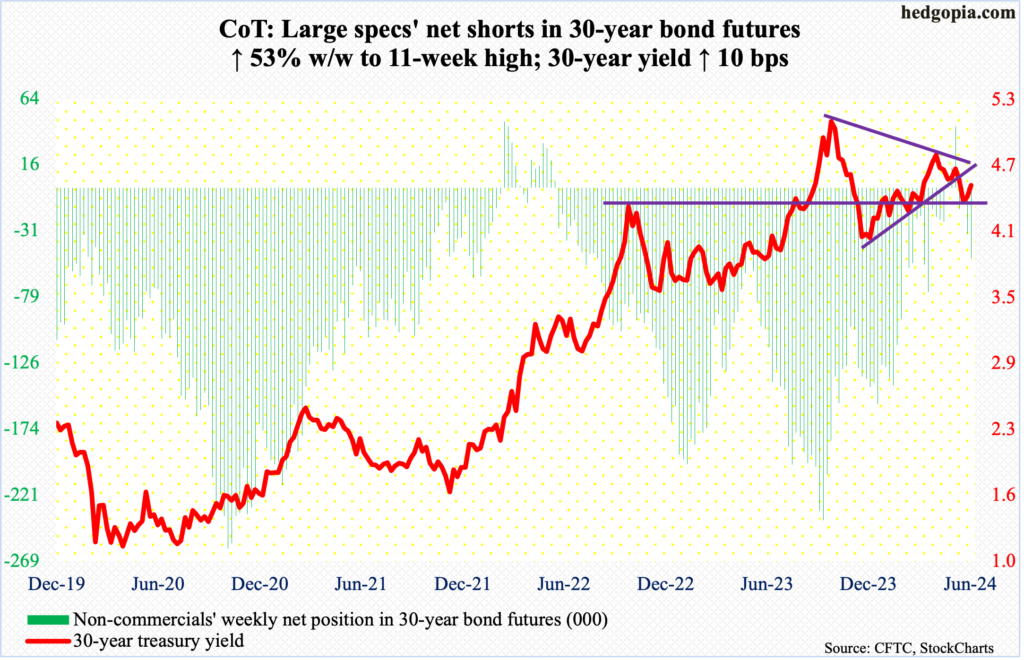
30-year bond: Currently net short 51k, up 17.7k.
Major US economic releases for next week are as follows. Markets are closed Thursday for observance of the July 4th holiday (and close early on Wednesday).
The ISM manufacturing index (June) is due out Monday. Manufacturing activity declined five-tenths of a percentage point month-over-month in May to 48.7 percent. Activity contracted in April and May after March’s expansion (50.3 percent) broke a 16-month contraction.
Job openings (JOLTs, May) are scheduled for Tuesday. Non-farm openings in April tumbled 296,000 m/m to 8.1 million. Openings were 8.8 million as recently as February and peaked at 12.2 million in March 2022.
Durable goods orders (May, revised) and the ISM services index (June) will be reported Wednesday.
May’s preliminary reading showed orders for non-defense capital goods ex-aircraft – proxy for business capex plans – dropped 0.6 percent m/m to a seasonally adjusted annual rate of $73.6 billion. Orders peaked last December at $74 billion.
Non-manufacturing activity jumped 4.4 percentage points m/m in May to 53.8 percent.
Friday brings the employment report (June). In the first five months this year, the economy created an average 248,000 non-farm jobs. The monthly average was 251,000 in 2023, 377,000 in 2022 and 604,000 in 2021.
WTI crude oil: Currently net long 303.6k, up 47.6k.
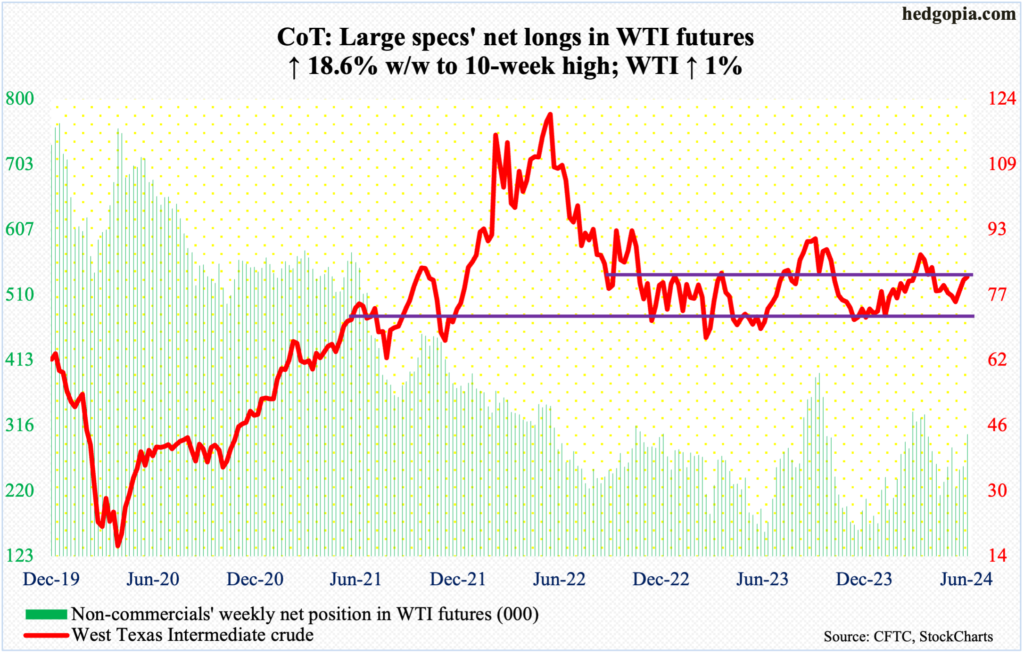
On the 4th (this month), West Texas Intermediate crude tagged $72.48 intraday before reversing higher. Earlier on April 12th, it retreated after ticking $87.67. That low just about tested the low end of a range between $71-$72 and $81-$82 that persisted for 19 months before the upper end gave way 14 weeks ago and was subsequently lost early May.
This Friday, with a high of $82.72, the top of the range was recaptured intraday but only to reverse and end the session lower at $81.54/barrel. For the week, the crude rallied one percent – its third straight up week after the low of early this month.
The daily is getting overbought, and it is hard to imagine the crude busting through the range-top right here and now. In the event this does happen, at $84 lies trendline resistance from last September when WTI peaked at $95.03.
In the meantime, after 13 consecutive weeks of 13.1 million barrels per day US crude production went sideways at 13.2 mb/d the last three weeks; 17 weeks ago, output was at a record 13.3 mb/d. Crude imports fell 443,000 b/d week-over-week to 6.6 mb/d. Stocks of crude, gasoline, and distillates all rose – respectively up 3.6 million barrels, 2.7 million barrels and 377,000 barrels to 460.7 million barrels, 233.9 million barrels and 121.3 million barrels. Refinery utilization decreased 1.3 percentage points to 92.2 percent.
E-mini S&P 500: Currently net short 65.2k, down 48.9k.
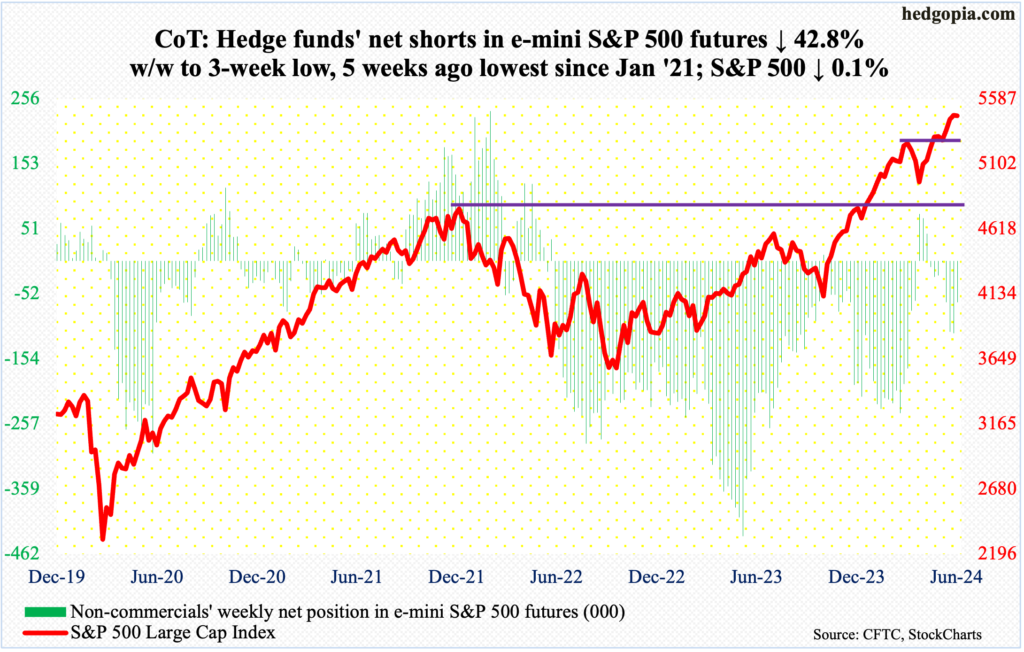
In the first four sessions, there were bids waiting at the 10-day moving average, although Monday’s session ended in a shooting star. Come Friday, within the first hour, a new all-time high of 5524 was hit, but it was all downhill from that point, with the session ending at 5460, down 0.1 percent for the week.
This has the potential to be an important reversal. A gravestone doji showed up on the weekly, having formed after eight out of nine weeks of uptrend post-April low. Even last week’s candle left behind a long upper shadow.
This is an opening for the bears. Through Friday’s high, the S&P 500 is already up 15.8 percent for the year. It is time to digest these gains.
Immediately ahead, the June 12th gap-up gets filled at 5370s.
Euro: Currently net short 8.4k, up 16.4k.
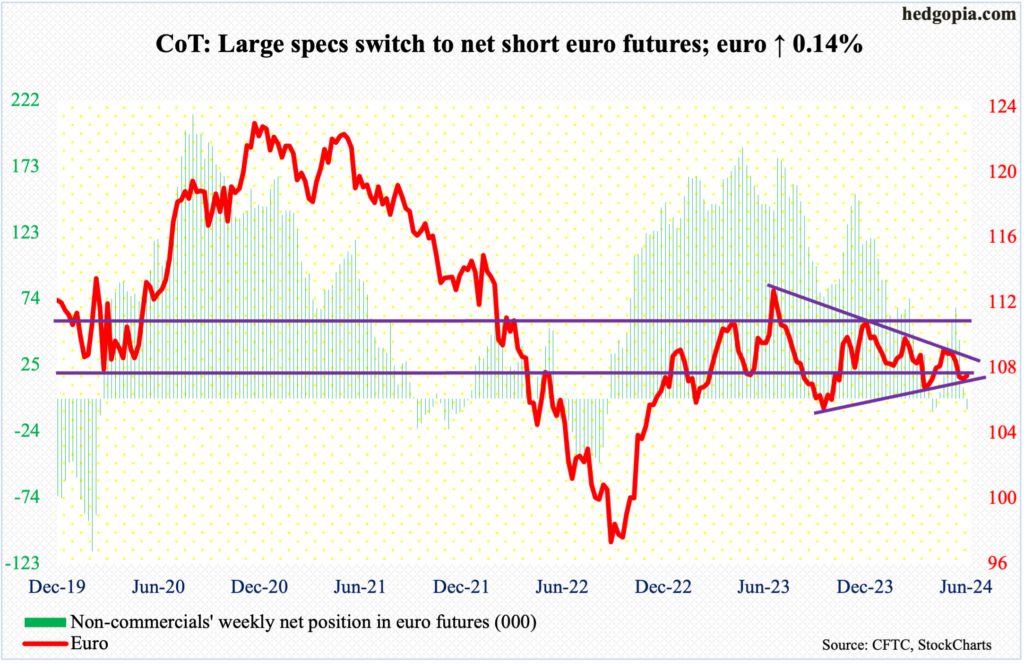
Euro bulls continue to defend $1.0660s. This week, the currency tagged $1.0666 on Wednesday and finished the week at $1.0710, up 0.14 percent for the week.
Since last July when the currency retreated after touching $1.1270, it has made lower highs. Concurrently, it has made higher lows since last October when it bottomed at $1.0448. The resulting symmetrical triangle – or a wedge – has been narrowing and remains intact. The euro currently is at support.
The daily is itching to move higher.
Gold: Currently net long 246.2k, up 3.1k.
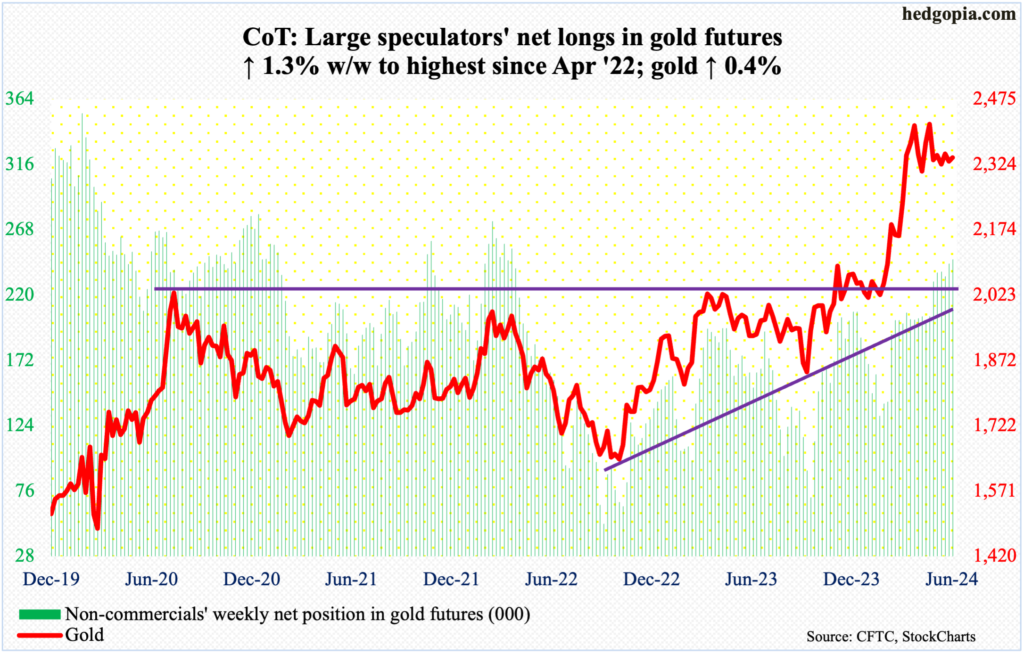
Once again, $2,300 drew bids, with Wednesday touching $2,305 intraday. By the end of the week, gold was up 0.4 percent for the week to $2,340/ounce.
Gold bugs have defended $2,300 for just over two months now. The metal came under pressure after recording a fresh high of $2,449 on April 12th. On May 20th, a new high of $2,454 was hit. Soon after, sellers appeared, but they have not been able to push the metal under $2,300.
From the bulls’ perspective, they have successfully held $2,300, but have been unable to use it as a launching pad for a new rally. The 50-day ($2,352) is beginning to roll over, with gold closing under the average in 14 out of the last 15 sessions.
Gold has come a long way since last October when it ticked $1,824 (was $1,996 this February) and cannot afford to lose $2,300.
Nasdaq (mini): Currently net long 7.4k, up 11.2k.
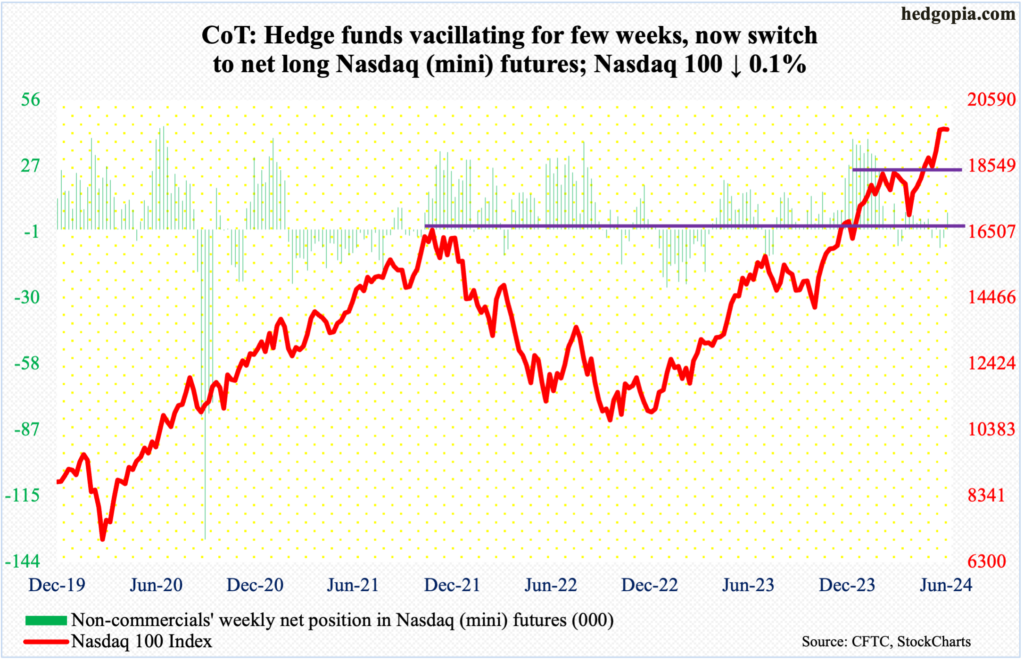
Last week, after rallying in seven out of the eight weeks post-April bottom, a gravestone doji showed up on the weekly (more on this here). The potentially bearish candle appeared right after a bullish marubozu weekly candle and needed confirmation.
The gravestone doji showed up in a week in which a new high was reached. This week, a newer high was hit on Friday when 20018 was tagged intraday, but tech bulls were unable to hang on to the gains, ending the session at 19683, down 0.1 percent for the week, forming a weekly spinning top. Timing and duration notwithstanding, the odds now favor the bears.
Russell 2000 mini-index: Currently net short 50k, down 7.8k.
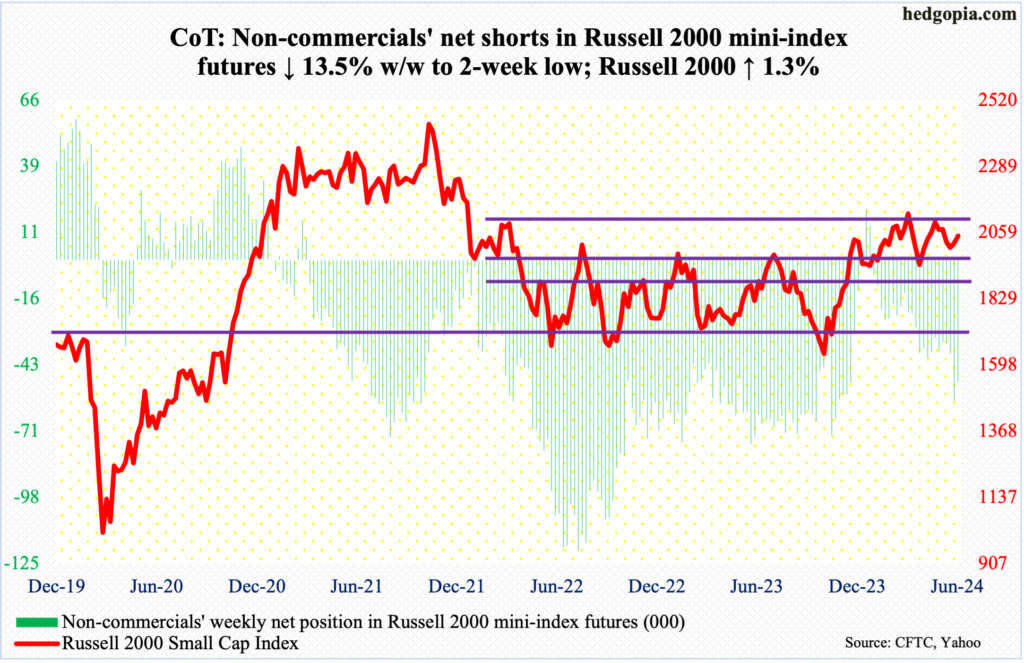
The Russell 2000 rallied 1.3 percent this week to 2048 – smack in the middle of 2000 and 2100.
The index has traded above 2000 since early May but has failed to reclaim 2100 since early March; 2100 is a significant level.
The small cap index peaked in November 2021 at 2459, subsequently bottoming at 1641 in June 2022, which was successfully tested in October of both 2022 and 2023. A 61.8-percent Fibonacci retracement of that drop amounts to 2144. The index lost 2100 in January 2022 and has since struggled at that level; 2100 also represents a measured-move price target post-breakout at 1900 last December. Before that, the index went back and forth between 1700 and 1900 going back to January 2022.
Odds favor 2100 continues to act as a ceiling.
US Dollar Index: Currently net long 17.5k, down 73.
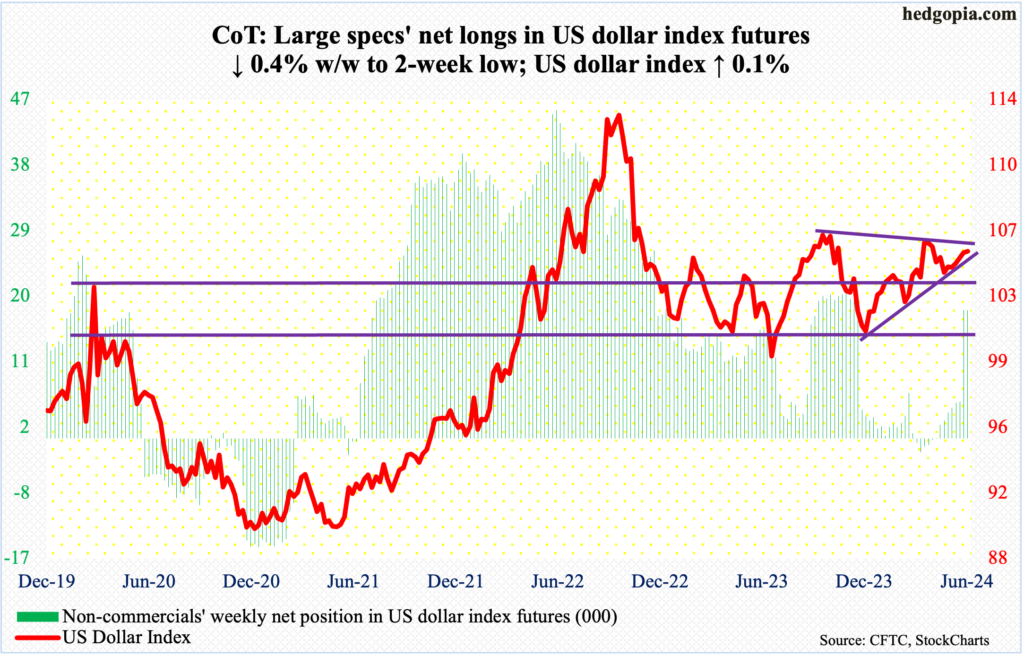
The US dollar index remains bound by two important lines. This week, it inched up 0.1 percent to 105.54, with a high of 105.80 and a low of 105.01; the high just about tested trendline resistance from last October when the index peaked at 107.05, while the low found support at a rising trendline from last December when the index bottomed at 100.32.
It is a wait-and-watch for now. Once the index breaks – either up or down – that probably will decide which way the momentum persists.
VIX: Currently net short 61k, up 11.6k.
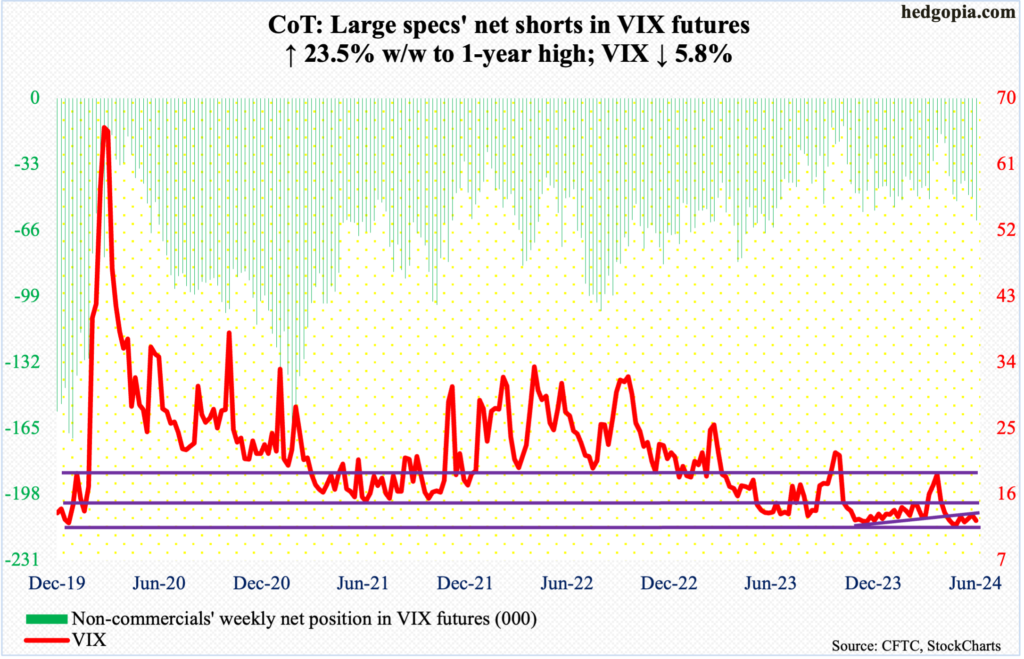
VIX dropped as low as 11.87 intraday Friday but ended the session at 12.44; the session low also kissed the daily lower Bollinger band and found support. The Bollinger bands are also tightening. Historically, this precedes a sharp move – either up or down.
Going back six years, volatility bulls have repeatedly defended 12, and this seems to be happening again. Friday’s session low also did not undercut the May 23rd low of 11.52. Odds favor volatility bulls at this juncture.
Thanks for reading!
More By This Author:
Levered-Up Consumers With Low Savings And Falling Deposits Set To Cut Back Spending
Action This Week After Nasdaq 100’s Gravestone Doji Last Week Worth Watching
Equity Bulls Riding Tailwinds Of Margin Debt And Buybacks – For Now
This blog is not intended to be, nor shall it be construed as, investment advice. Neither the information nor any opinion expressed here constitutes an offer to buy or sell any security or ...
more

