
The Russell 2000’s continued difficulty at 2100 runs in contrast to one after another high notched by large-cap indices such as the S&P 500. That said, last week’s weekly gravestone doji on the Nasdaq 100 is worth watching.
(Click on image to enlarge)
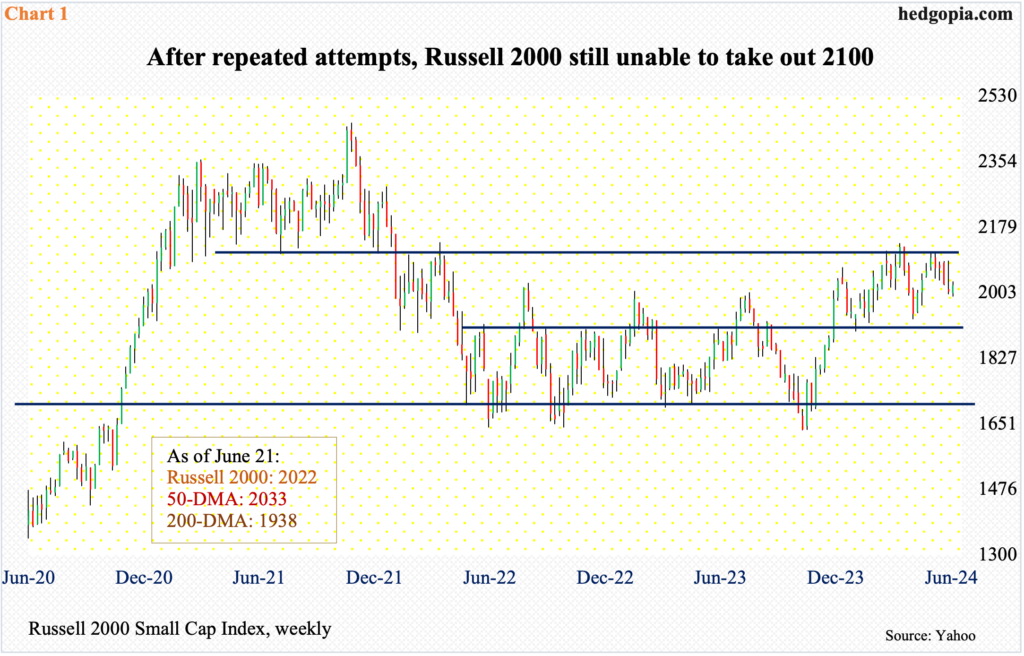
After unsuccessfully hammering on 2100 – or just underneath – for six consecutive weeks, the Russell 2000 failed to repeat the feat last week, although it did rally 0.8 percent to 2022, with an intraweek high of 2034 on Tuesday.
The small cap index has closed above 2000 since early last month, while 2100 has stood like a mountain since early March. The latter faces a confluence of resistance.
The Russell 2000 peaked in November 2021 at 2459, subsequently bottoming at 1641 in June 2022, which was successfully tested in October of both 2022 and 2023. A 61.8-percent Fibonacci retracement of that drop amounts to 2144. The index lost 2100 in January 2022 and has since struggled at that level (Chart 1); 2100 also represents a measured-move price target post-breakout at 1900 last December. Before that, the index went back and forth between 1700 and 1900 going back to January 2022.
(Click on image to enlarge)
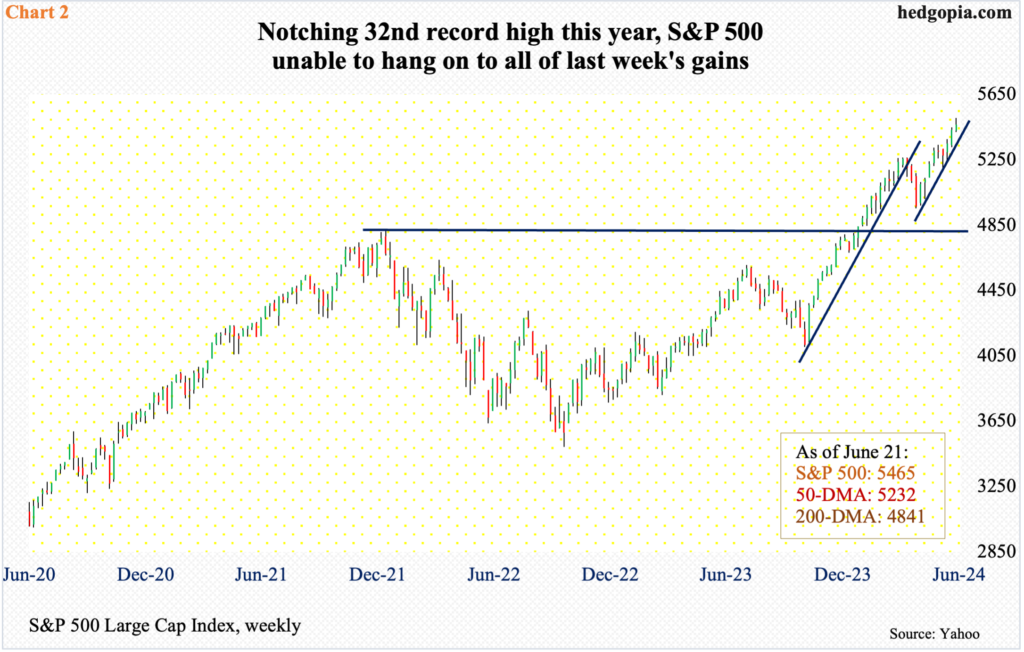
The story is starkly different for large-caps. The S&P 500 last week experienced its 32nd record high this year. Last Thursday, it printed 5506 before reversing slightly to end the week up 0.6 percent to 5465. Through last week’s high, the large cap index was up 15.4 percent this year.
The index has just about gone parabolic after last October’s bottom (Chart 2). There was a brief selloff – down 5.9 percent – between March and April, followed by another parabolic run higher. Post-April trough, the S&P 500 has rallied in eight of the nine weeks, including the last three.
Amidst this ebullience, the bulls were unable to hang on to all of the gains last week, resulting in a weekly candle with a long upper shadow. This in and of itself may not mean much except to subtly indicate that selling is about to pick up. This week’s action is key.
(Click on image to enlarge)
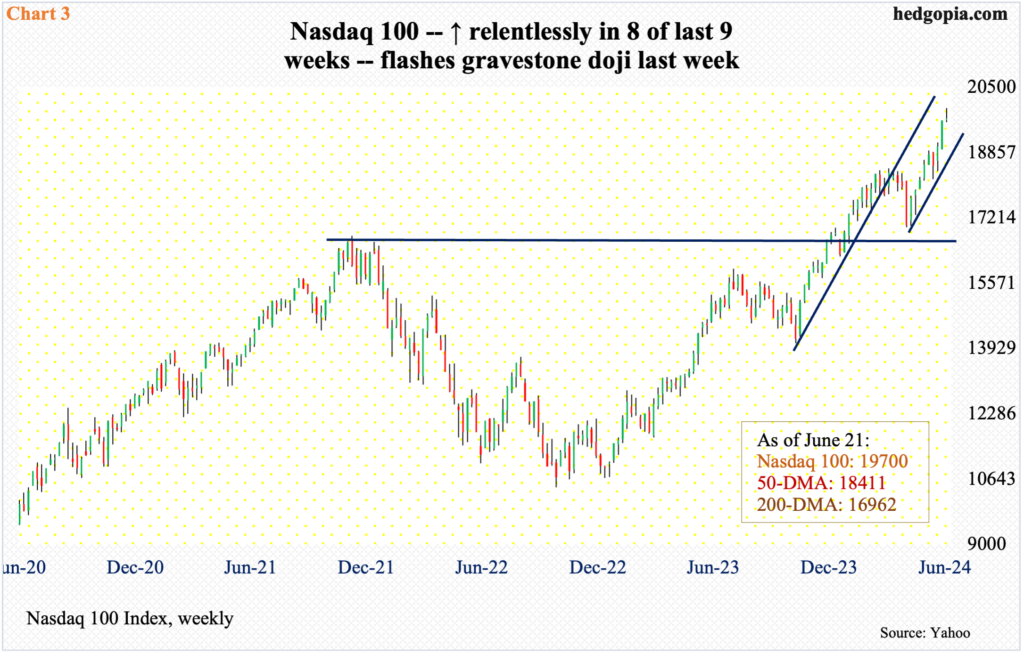
This is particularly important in the tech-heavy Nasdaq 100 where a gravestone doji formed last week (Chart 3). This comes after a strong rally lasting seven out of eight weeks. Last week, the index was up 0.2 percent to 19700 but was up as much as 1.6 percent at Thursday’s intraday high of 19980.
Last week’s candle showed up after the previous week’s bullish marubozu. Besides these mixed messages, divergence can also be seen in the RSI. Leading up to the March high (18465), the weekly RSI was in the mid-70s. The index since has rallied 1500 points, with the RSI ending last week just under 71.
As is the case with the S&P 500, this week’s action is worth a watch on the Nasdaq 100. Through last Thursday’s high, the index was already up 18.7 percent – enough to get tempted to lock in gains. In the event of downward pressure, the June 12th gap-up gets filled at 19200s.
More By This Author:
Equity Bulls Riding Tailwinds Of Margin Debt And Buybacks – For NowWith Persistent Failure To Capitalize On Favorable Setups, Bears Wonder If Opportunity At Hand Will Be Different
Unpacking The CoT Report: What Positions Are Noncommercials Taking?


Comments
Log in or sign up to join the conversation.