Equity Bulls Riding Tailwinds Of Margin Debt And Buybacks – For Now
The S&P 500 is on course for a third straight up quarter, with a touch of ‘parabolic’ to it. Buybacks and margin debt have provided a tailwind, although the latter in particular points to a lack of aggressive willingness to take on leverage. Once they stop cooperating, history teaches us ‘parabolic’ can go the other way.
(Click on image to enlarge)

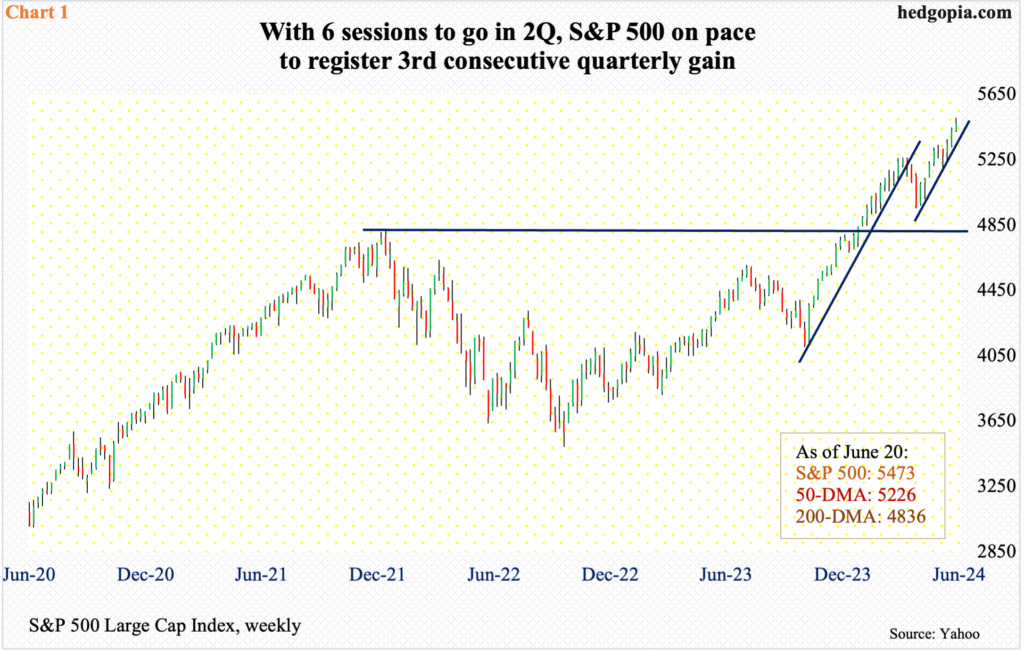
There are six sessions to go before June is over. Month-to-date, the S&P 500 is up 3.7 percent. If these gains hold in the remaining sessions, the large cap index is on course for a 4.2-percent rise in the June quarter. This will be the third consecutive quarterly gain.
The S&P 500 bottomed last October. This was preceded by a major bottom in October 2022; the rally off that bottom was marked by plenty of back-and-forth action – until a higher bottom was reached last October, setting in motion a parabolic run. This is particularly so after Federal Reserve Chair Jerome Powell surprised the markets with a dovish switch on December 13th. Between March 28th and April 19th (this year), the index saw a small selloff – 5.9 percent – before beginning another parabolic run. The previous run lasted five months; this one is two months old (Chart 1).
Equity bulls are hoping the bullish run continues and are positioned as such – evident in VIX with a 13 handle and in total lack of willingness to protect gains by selling calls or buying puts, for instance. The problem remains stretched technicals. On both the daily and weekly, the RSI is north of 73 and just under 70 on the monthly. Even here, on the weekly and monthly, momentum was a lot stronger at the March high; the index has rallied 240 points from that point, but with declining momentum.
(Click on image to enlarge)

This in and of itself does not mean things will have to go the other way right away. Overbought conditions can persist longer than expected – particularly if other variables are providing a tailwind.
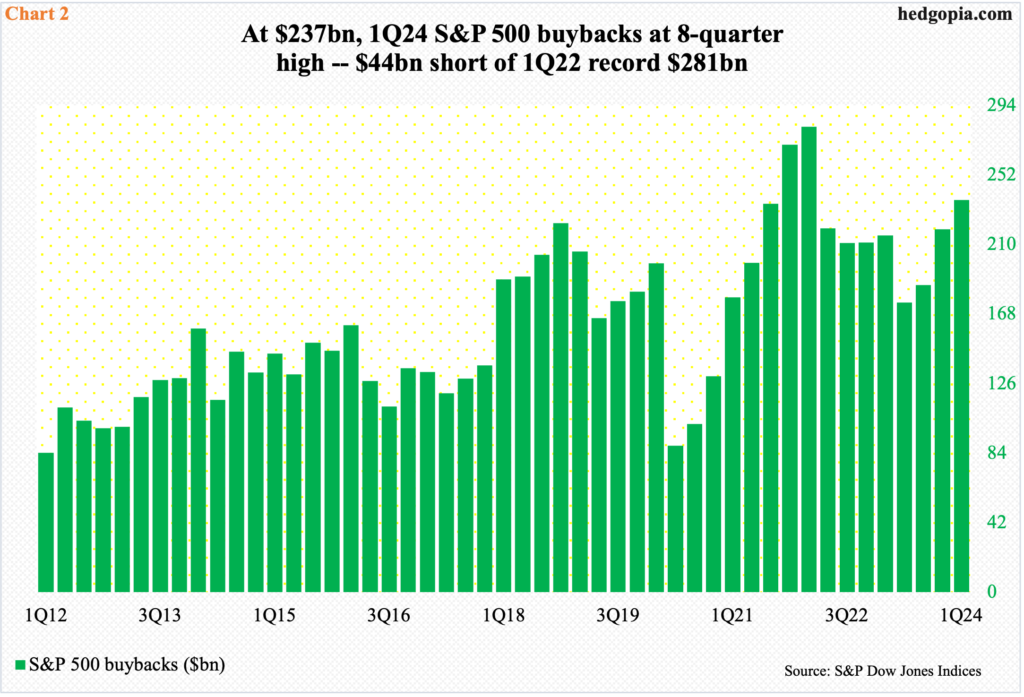
Speaking of which S&P 500 buybacks hit a two-year high in the March quarter, when these companies spent $236.8 billion, which was the highest since 1Q22 when a record $281 billion was splurged (Chart 2).
From 2Q23 when $174.9 billion was spent, buybacks have rebounded with a vengeance. But they remain top heavy, with the top 20 companies accounting for 50.9 percent of last quarter’s buybacks; Apple (AAPL) remained the top honcho with spending of $23.5 billion. This poses concentration risk.
(Click on image to enlarge)

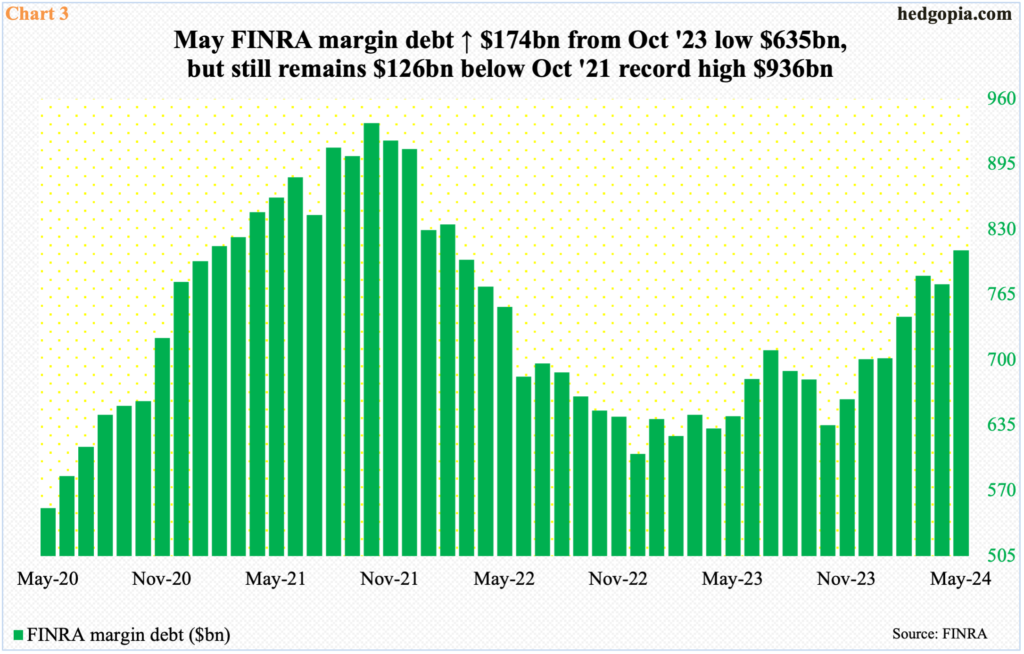
FINRA margin debt, too, has risen nicely from last October’s bottom, but a genuine willingness to take on leverage remains a suspect.
Margin debt peaked at $935.9 billion in October 2021 and dropped all the way to $606.7 billion by December 2022. Last October, when equities bottomed, it stood at $635.3 billion. From that low through May, margin debt is up $174.2 billion to $809.4 billion. At the same time, leverage remains substantially below the October 2021 high, even as equity indices keep making new highs, which also suggests that once these tailwinds stop cooperating, the move lower can be as parabolic as the move higher.
More By This Author:
With Persistent Failure To Capitalize On Favorable Setups, Bears Wonder If Opportunity At Hand Will Be DifferentUnpacking The CoT Report: What Positions Are Noncommercials Taking?
No Love For Small-Caps, Which Refuse To Respond To Robust Payrolls
This blog is not intended to be, nor shall it be construed as, investment advice. Neither the information nor any opinion expressed here constitutes an offer to buy or sell any security or ...
more


