
The current takeover drama occurring as Newmont Mining (NEM) ups its bid for Newcrest Mining (NCM on TMX and ASX) brings with it some personal nostalgia. My first major trading responsibilities involved ADR arbitrage and market-making in Australian and Canadian stocks. The pairing made sense despite the wide geographic and time differences between the two. In the late ‘80s, memories of inflation were still quite fresh, and investors actively sought exposure to the resource-based companies that dominated those countries’ markets.
We’ll get to the economic logic of the world’s largest gold company trying to get even larger by purchasing a company that it spun out nearly 30 years ago, but please indulge me for a paragraph or two.
I loved trading in those countries, both of which I had traveled in extensively. The geographic differences eventually made them an untenable pairing from a lifestyle viewpoint though. There were some huge trades in BHP, for example, in the middle of the night. My then-girlfriend, now long-suffering wife, hated the late-night interruptions but enjoyed the travel and visiting brokers’ dinners at places like the Four Seasons and Quilted Giraffe. I’ve been able to stay continuously involved in the Canadian markets, managing Timber Hill Canada’s trading activities from its founding and through its role as Canada’s largest options market maker, and continuing to serve on two regulatory committees there. And after a hiatus in Australia, during which I continued to have the occasional Vegemite for breakfast, I’m back on one of their business networks on a weekly basis.
A phrase from that era sticks in my mind as well. I don’t remember it exactly, but it was something like “investment bankers will sell you aluminum siding for your house, then charge you to take it down later.”That is relevant to the Newcrest situation because the company was created by Newmont when it merged its Australian assets with BHP Gold in 1990. Why then might NEM want to bring NCM back into the fold?
The simplest answer is that this large gold company is quite bullish on gold itself. The recently increased all-stock bid was taken as a vote of confidence by investors, and commodity-linked stocks around the world rose as global markets reopened after the Easter Monday holiday. Leaving aside the specifics about this particular takeover battle – I’ll leave those to the merger arbitrageurs – let’s see if we should share NEM’s enthusiasm about rising gold prices.
Spot Gold, 5-Years, Weekly Bars
(Click on image to enlarge)
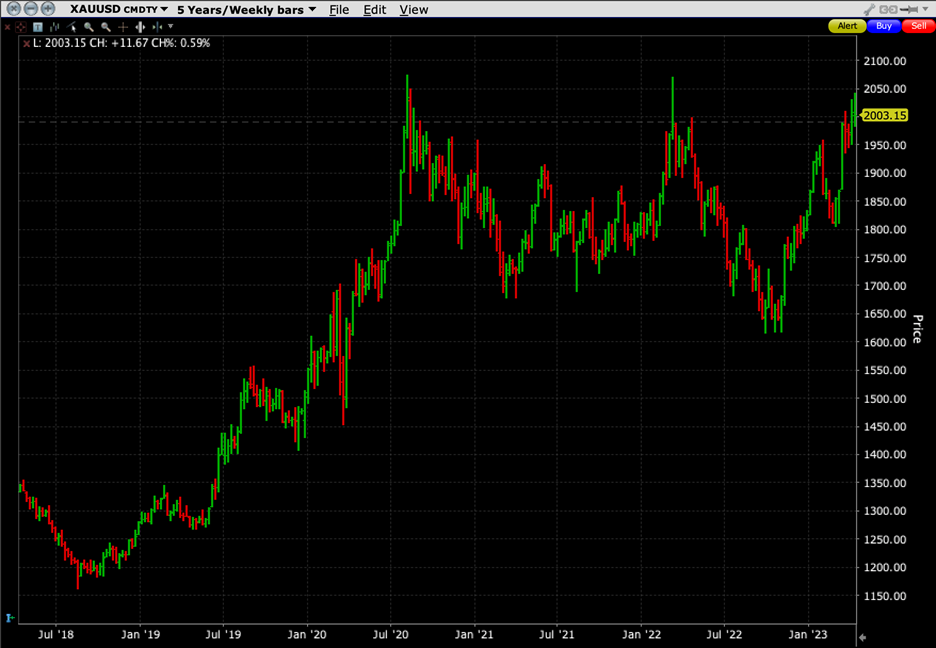
Source: Interactive Brokers
The above graph shows that gold is flirting with multi-year highs, but the question is why? What is driving it? The knee-jerk answer is “inflation fears”, but why now? Inflation became an obvious problem in 2022, but the metal fell for much of the year. The fall and subsequent rise may indicate that investors believed that the world’s central banks’ efforts to fight inflation would prove successful, while the resurgence may indicate concerns that Fed and Friends will now lose their resolve to continue that fight against a backdrop of potential economic weakness.
Let’s try to see how those hypotheses hold up by seeing how well gold correlates with potential catalysts for its price. Over the long-term, gold does correlate reasonably well with commodity prices as measured by the CRB index:
30-Year Monthly Price Correlation, Gold vs. CRB
(Click on image to enlarge)
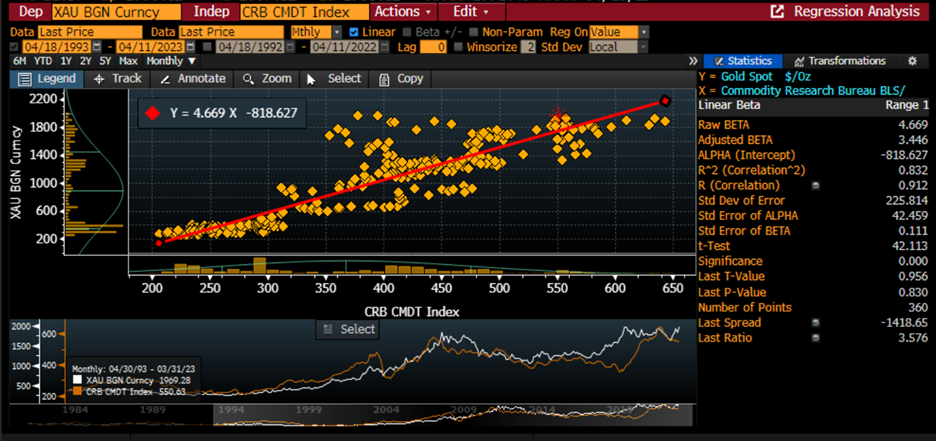
Source: Bloomberg
Despite the high overall R^2 correlation of 0.832, there are periods when the two can diverge substantially. Most recently, that occurred in 2020 when gold rallied as the CRB fell. Demand for commodities plunged during the pandemic even as monetary expansion was occurring at a record pace. That raises the question about whether the primary driver of gold prices might indeed be money supply, as shown below:
30-Year Monthly Price Correlation, Gold vs. M2
(Click on image to enlarge)
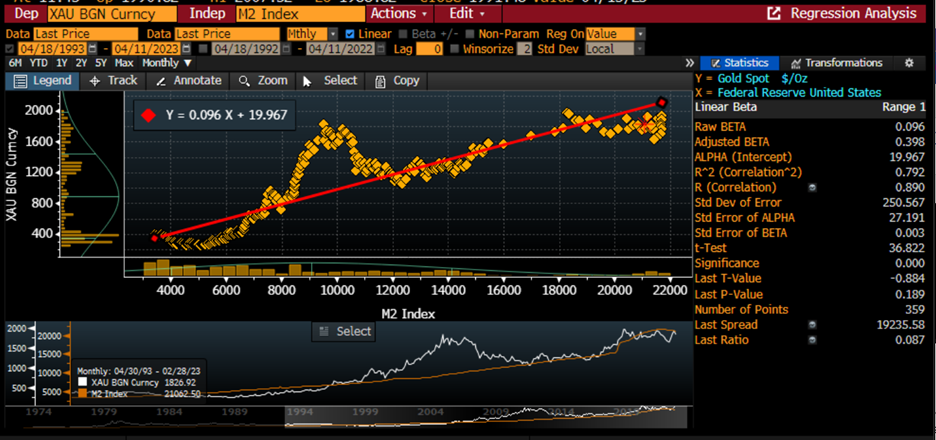
Source: Bloomberg
Again, we see a generally high correlation – R^2 is 0.792 – but also with key divergences. The most significant was during the aftermath of the global financial crisis. Monetary conditions remained generally accommodative, but inflation remained relatively tame throughout. It is not clear even in hindsight whether gold investors were more concerned about inflation that wouldn’t arrive for another decade or simply looking for a home for idle funds in a low-rate environment.
One thing we can be certain about, at least on a long-term basis, is that gold is hardly a perfect “anti-dollar.”Over various short-term periods that has proven to be the case, something we discussed in February 2022 and May 2021, but the inverse correlation of 0.166 against DXY over the past 30 years is poor.
30-Year Monthly Price Correlation, Gold vs. DXY
(Click on image to enlarge)
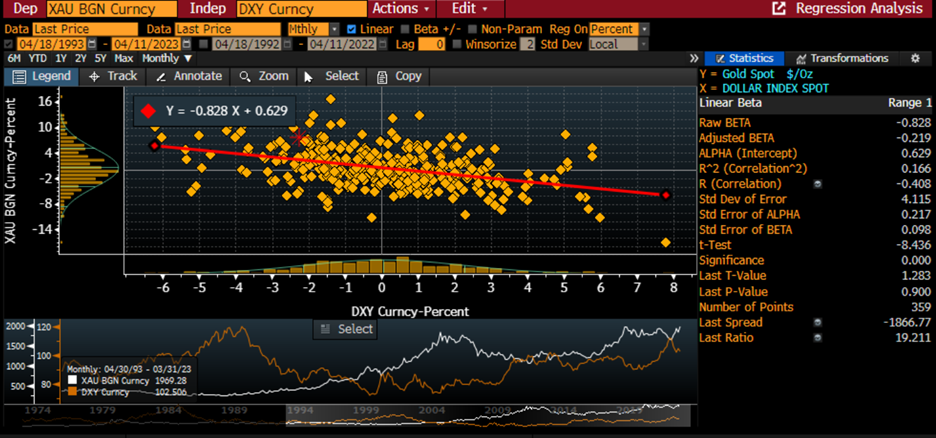
Source: Bloomberg
Gold has been a historical store of value because of its beauty, relative rarity, and malleability. The last of those features is perhaps most valuable to modern investors – though in this case, malleability refers less to its ability to be shaped and pounded than to investors’ ability to shape and pound their demand for gold to whichever circumstances suit it best at the moment.
More By This Author:
This Time I’m Glad That Banks Go First
Economic Landscape: Tighter Lending Conditions
Things to Think About Ahead of the Long Weekend


Comments
Log in or sign up to join the conversation.