Things To Think About Ahead Of The Long Weekend
Stock markets in North America are closed for Good Friday tomorrow. I must admit, I’m a fan. Because this is the only scheduled market closure that is not a public holiday, those of us who are equity market professionals get to enjoy a day off when the rest of the world is generally working. That includes our colleagues in the bond market. For most of my career, those folks would get to duck out early ahead of long weekend thanks to early closures. Heaven forbid that bond traders would have to sit in holiday weekend traffic like mere mortals.
However, because the bond market is open tomorrow, they get to dictate the market’s reaction to the March Employment report. (The government is open too.) This is considered a crucial monthly release because it offers relevant data about both parts of the Federal Reserve’s dual mandate. The Fed’s role is to foster full employment and stable prices, and we learn about employment and wage inflation in one fell swoop. The consensus is for a rise in Nonfarm Payrolls of 228,000, down from last month’s 311,000. The Unemployment Rate is expected to come in unchanged from last month’s 3.6%, while month-over-month Average Hourly Earnings are expected to rise to 0.3% after last month’s 0.2% gain.
While it may seem remarkable that we would get a crucial economic when equity markets are closed, bear in mind this last happened as long ago as…2021. Back then, we were emerging from the worst of the pandemic amidst a backdrop of massive fiscal and monetary stimuli. We wanted to see employment gains – they were going spoil neither the financial fiesta nor the raging bull market (remember meme stocks, anyone?), so we had the S&P 500 (SPX) rally 1.18% on Thursday prior to the report and another 1.44% on Monday after we saw payrolls with a huge positive surprise.
The problem with tomorrow’s report is that it is hard to be certain what investors really want right now. That leads us into the critical questions that investors should be considering over the long weekend:
- Would we rather have lower rates or a strong economy? We’re not getting both. Fed Funds futures are predicting roughly even odds for a 25 basis point hike at the May FOMC meeting and then 3-4 cuts by the end of the year. We have made the point several times that we’re simply not getting a solid economy and a quick rate cut cycle. Cleveland Fed President Mester implied the same in her comments yesterday. That leads directly into the next question…
- Is bad news good or bad for stocks? At various points in the past few years, it seemed as though all news was good. We just gave the example of early 2021. That was a time when all news could be considered good. We wanted and needed the economy to recover, and if it stumbled, we could expect further extraordinary measures to help it. Yet this week, we had a skein of reports that showed the potential for a slowing economy and stocks responded poorly. The down days could have simply been a bit of profit-taking after a rip-roaring end of the first quarter. We’ll learn more as early as Monday.
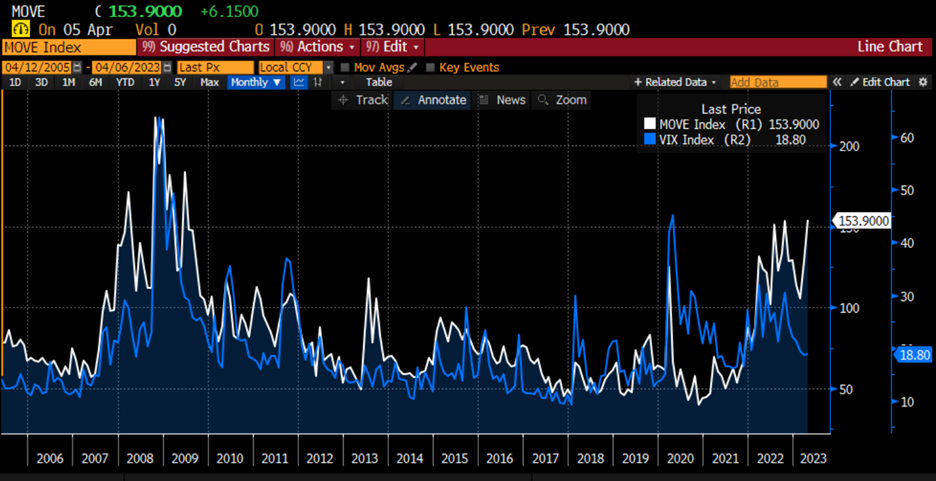
- How long can stocks and bonds diverge? We have continually been astounded that stocks can remain relatively sanguine while rates, especially short-term rates, can move about wildly. One of the most graphic divergences occurs when we examine the ICE BofA MOVE Index (MOVE) versus the Cboe Volatility Index (VIX). The former is an index of the normalized volatility on 1-month Treasury options, while the latter measures expectations for equity market volatility over the coming 30 days. The indices are calculated differently, so an apples-to-apples comparison is not perfect, but they are both industry standard proxies. They usually move in rough synch. As the following graph shows, we see MOVE at high levels while VIX dips. This has not happened in the post-Global Financial Crisis era. Somehow, we will need to resolve this differential. Will nerves calm in the bond market, or will stocks develop similar jitters?
MOVE Index (white) vs. VIX (blue), 13-Years Monthly Data
(Click on image to enlarge)

Source: Bloomberg
More By This Author:
Not So Safe Havens Today
Tesla Proves Our Point
Narrowing Leadership Raises The Stakes For Earnings Season
Disclosure: The analysis in this material is provided for information only and is not and should not be construed as an offer to sell or the solicitation of an offer to buy any security. To the ...
more


