
Spring has sprung. The days are noticeably longer, my daffodils and crocuses have begun to bloom, the NCAA Tournament will be decided tonight (go UConn!). There is a natural optimism that arises when spring comes calling, so it feels a bit odd to be discussing market risks – especially after a rousing end to the first quarter. April also brings around earnings season, and the narrowing market leadership increases its stakes.
The following table shows the vast outperformance of indices that are top-heavy with so-called “megacap” tech stocks. For reference, the top seven companies in the NASDAQ 100 Index (NDX) comprise over 50% of its weight (the two classes of Alphabet are summed). The top two stocks alone – Microsoft (MSFT) and Apple (AAPL) – are over 25%. Those relative weights in the S&P 500 Index (SPX) are almost exactly half. When we see how well those megacap leaders performed in the quarter, it should be little surprise that indices with heavier megacap tech concentration in the index outperformed substantially.
| Megacap Tech Outperformance in First Quarter | |
| NASDAQ 100 | 20.49% |
| S&P 500 | 7.03% |
| Russell 2000 | 2.34% |
| NASDAQ Composite | 16.77% |
| NYSE Composite | 1.26% |
| S&P 500 Equal Weighted | 2.41% |
| NYSE Fang+ | 39.16% |
| Top Ten Companies in NASDAQ 100 | |
| Microsoft | 20.52% |
| Apple | 27.11% |
| Alphabet Class A | 17.57% |
| Amazon | 22.96% |
| NVIDIA | 90.10% |
| Tesla | 68.42% |
| Meta | 76.12% |
| Broadcom | 15.56% |
| PepsiCo | 1.59% |
| Costco | 9.03% |
Sources: Interactive Brokers, Bloomberg
A fair amount of these names’ initial outperformance in Q1 can be attributed to a larger than normal January Effect. Many of these stocks were disproportionately oversold in December when a bout of year-end tax-loss harvesting turned into a bit of a rout. That negative catalyst was gone when the calendar turned, and the ensuing relief rally morphed into a full-fledged run. Two key factors abetting the specific focus on megacap techs were enthusiasm about artificial intelligence (AI) – NVIDIA (NVDA) and Microsoft (MSFT) were particular beneficiaries — and a perception that many of these stocks’ solid earnings streams and balance sheets offered a safe harbor when concerns about banks pervaded the market’s psyche.
In case the prior table is not stark enough, the following charts should make NDX’s outperformance even more obvious. The NASDAQ Composite (COMP) and NDX have correlated exceptionally well, with R-squared of 0.97 or more since 2002. Yet the spread between the two indices – the middle panel below — is at a width not seen in 30 years:
NDX vs. COMP, 30 Years Monthly Charts (top), Spread (middle), Correlation (bottom)
(Click on image to enlarge)
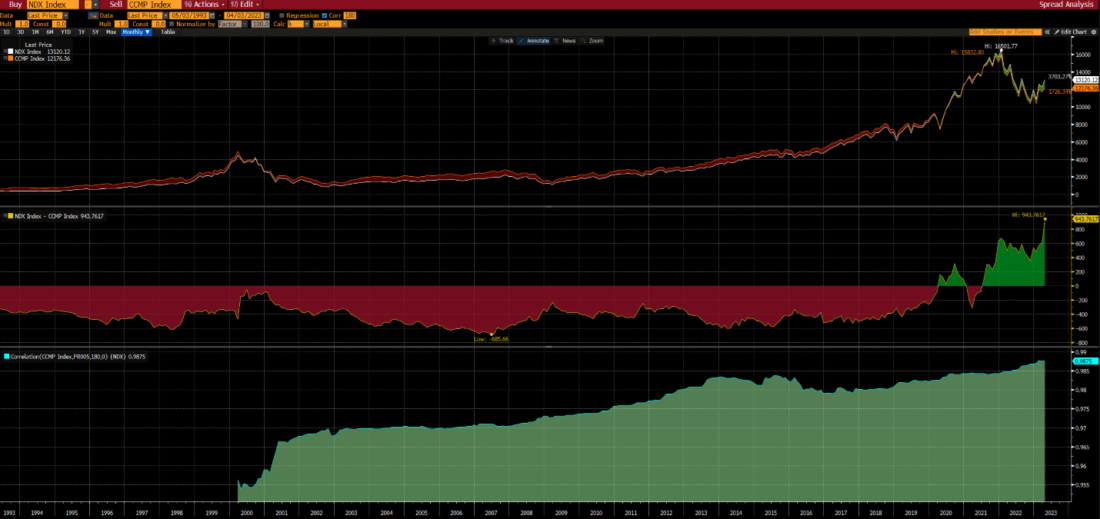
Source: Bloomberg
A market truism is that we want to see broad-based rallies, rather than those with narrow leadership. One way that we discern that is what we’ve already done, shown how narrow-based indices have dramatically outperformed broader counterparts. Another is to look at a market’s advance/decline line. When markets are broadly advancing, their cumulative advance/declines should keep pace with the benchmark index’ rise. The following chart shows anything but that for NASDAQ:
Cumulative Advances-Declines for the NASDAQ Exchange (green) vs. NDX (yellow), 5 Years
(Click on image to enlarge)
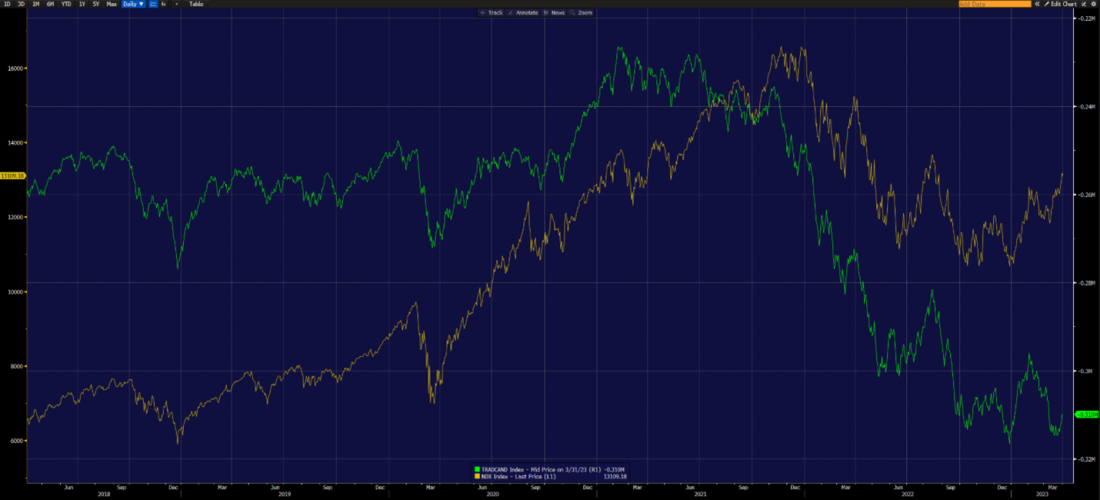
Source: Bloomberg
When NDX was steadily rising for most of the past five years, the A/D line was generally keeping pace. For better or worse, it also kept pace during the declines of early 2020 and most of 2022. Yet now we see the A/D line coming nowhere close to confirming the past few months’ rise.
All this data seems to raise the stakes for earnings season, which arrives later this month. The dates are not confirmed yet, but we can expect to hear from most of the megacap techs during the last week of April or earlier. If these stocks fail to meet expectations, a resulting selloff will necessarily have significant negative consequences for the indices that they dominate. It’s relatively obvious arithmetic. Furthermore, one needs to consider whether the current enthusiasm has raised investors’ expectations above and beyond published analyst consensus. If so, that further increases the risks.
Those who prefer to hedge with put options may find it too early to put on their positions. Four weeks can be an eternity for those whose holdings decay. But it is never too early to consider strategies in advance of the event. If you’ve been fortunate enough to have ridden the wave higher, you might find that your portfolio is more heavily weighted than normal. Might you want to pare your holdings to more normal levels? Or, if you’re neither willing to sell now, nor are you ready to utilize options strategies now, might you want to consider which strategies would be most appropriate and when you feel comfortable implementing them.
This spring brings an interesting crossroad for investors. It is usually good practice to let one’s winners run, and last quarter’s winners have indeed had quite a run. But it is also good practice to be wary of markets with narrow leadership and those that have wildly outperformed their peers. Vigilance is not something we normally associate with springtime, but it seems quite prudent this April.
More By This Author:
A Spiderman Quarter
Markets Sanguine Ahead Of Key Inflation Report
Fed Put Talk Resurfaces


Comments
Log in or sign up to join the conversation.