
Can Prospect Theory Explain The Value And Momentum Factors?
Traditional finance academics lean towards risk-based models to explain why various return characteristics, such as value and momentum, predict returns. But there is another school of thought often referred to as ‘behavioral finance.’ This field has some of its own ideas (see below) on why different stock factors might predict returns.
Prospect Theory was first introduced by Kahneman and Tversky (1979, 1992). It states that:
“an individual derives utility from gains and losses, where the utility function is kinked at its origin, so that he is more sensitive to losses than to gains (loss aversion), and also concave over gains and convex over losses, so that he is risk averse over moderate-probability gains and risk-seeking over moderate-probability losses (diminishing sensitivity).”
It also states that an investor…
“weights outcomes not by objective probabilities but by transformed probabilities that overweight the tails of the distribution he is thinking about (probability weighting).”
Finally, Prospect Theory is often implemented in conjunction with narrow framing, that is:
“ when an individualvis thinking about taking on a new risk, he evaluates it to some extent in isolation, separately from his other risks.”
By translating all of this into the context of the stock market the authors suggest that:
- When an investor is thinking about how much money to allocate to a particular stock, she focuses, at least in part, on the potential gains and losses in her holdings of the stock itself.
- Investors require a higher average return on more volatile assets.
- Investors require a lower average return on assets with more positively-skewed returns.
- Investors require a higher average return on assets where they have larger prior gains.
The authors of this paper present a new model of asset prices in which investors evaluate risk according to prospect theory and narrow framing. The show how the model using these features can be used to make quantitative predictions about the cross-section of average returns.
To do this the authors examine whether their model can explain a particular anomaly – size anomaly, for example– they compute what it predicts for the average return of the typical small-cap stock. The average return will depend on the return volatility, return skewness, and the capital gain overhang of the typical small-cap stock. The authors estimate these quantities from historical U.S. data, plug them into their model, and record the model’s prediction for the average return of a typical small-cap stock. The authors repeat this process for the typical stock in each of the ten market capitalization deciles. The results reveal how much, if any, of the size anomaly the model can explain. The authors proceed in the same way for all 22 anomalies.
Specifically, they seek to answer the following question:
Can a new “behavioral” asset pricing model (incorporating prospect theory and narrow framing) explain 22 prominent market anomalies?
Please note that this paper was covered previously by Larry Swedroe.
What Are The Academic Insights?
The authors find:
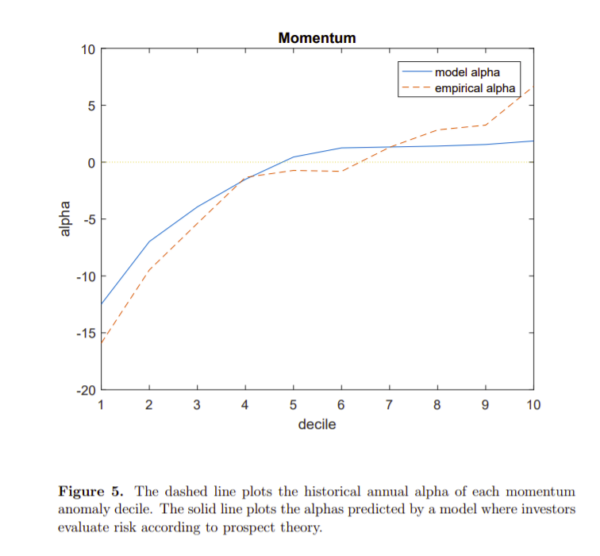
Mostly, YES, the authors found that their model could help explain 13 of the 22 anomalies. In fact, it predicts a higher CAPM alpha for the extreme anomaly decile portfolio that actually has a higher alpha, empirically 1.
- It performs particularly well for momentum, volatility, distress and profitality.
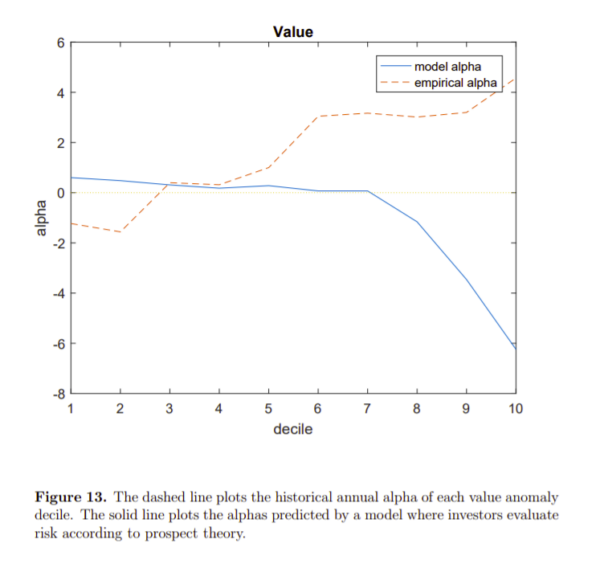
- Differently it does not work for value and size.
- For each of the13 anomalies, the typical stock in the extreme decile with the lower average return is more highly skewed, more volatile, and has a lower gain overhang than the typical stock in the other extreme decile. The greater skewness and lower gain overhang of the former stock leads investors to expect a lower average return on it, while its higher volatility leads investors to charge a higher average return on it.
Notable exceptions are the value and size anomalies for which the model does not work. Value stocks are more highly skewed and have a more negative capital gain than growth stocks. All else equal, this leads prospect theory investors to charge a lower average return on value stocks. However, value stocks are also more volatile, which, all else equal, leads investors to charge a higher average return on them. According to the authors, investors appear to think that the returns on value stocks have similar skewness to the returns on growth stocks, even though, empirically, value stock returns are more highly skewed than growth stock returns. These incorrect beliefs may help explain the model’s counterfactual prediction about the average return on value stocks.
Why Does It Matter?
This paper is important because it introduces a new asset pricing model that overcomes some of the limitations of prior approaches, which incorporated only a subset of the elements of prospect theory. It also investigates the highest amount of anomalies compared to prior research. Finally, we have a ‘behavioral’ model to help understand why things like the value and momentum factors may or may not exist.
The Most Important Chart From The Paper:
The results are hypothetical results and are NOT an indicator of future results and do NOT represent returns that any investor actually attained. Indexes are unmanaged, do not reflect management or trading fees, and one cannot invest directly in an index.
Abstract
We present a new model of asset prices in which investors evaluate risk according to prospect theory and examine its ability to explain 22 prominent stock market anomalies. The model incorporates all the elements of prospect theory, takes account of investors’ prior gains and losses, and makes quantitative predictions about an asset’s average return based on empirical estimates of its beta, volatility, skewness, and capital gain overhang. We find that the model is helpful for thinking about a majority of the anomalies we consider. It performs particularly well for the momentum, volatility, distress, and profitability anomalies, but poorly for the value anomaly. For several anomalies, the model explains not only the average returns of extreme anomaly deciles, but also more granular patterns in the average returns of intermediate deciles.
Notes:
- These are the momentum, failure probability idiosyncratic volatility, gross profitability, expected idiosyncratic skewness, return on equity, maximum daily return, O-score, external finance, composite equity issuance, net stock issuance, post-earnings announcement drift, and difference of opinion anomalies.
Disclaimer: Performance figures contained herein are hypothetical, unaudited and prepared by Alpha Architect, LLC; hypothetical results are intended for illustrative purposes only. Past ...
more

