Business Cycle Indicators At June’s End
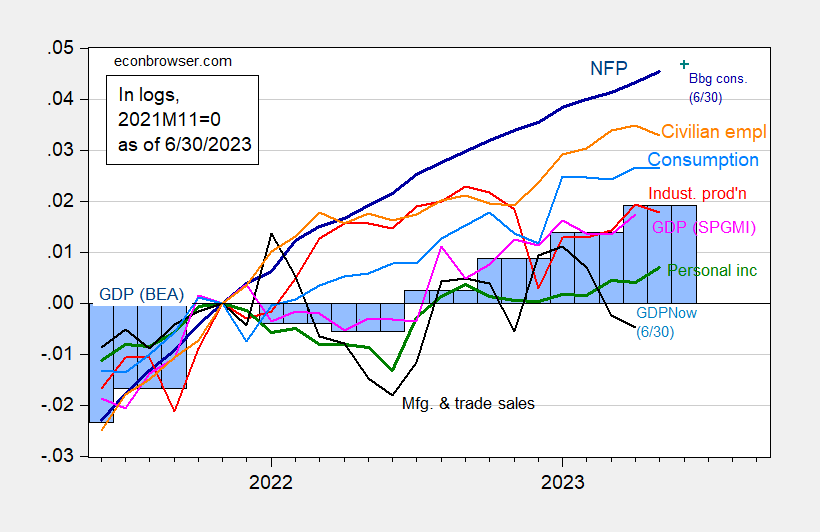
With Friday’s spending and income release, we have this picture of key indicators followed by the NBER Business Cycle Dating Committee (consumption, income, sales), along with monthly GDP. Atlanta Fed has also released a new nowcast of GDP.
Figure 1: Nonfarm payroll employment, NFP (dark blue), civilian employment (orange), industrial production (red), personal income excluding transfers in Ch.2012$ (green), manufacturing and trade sales in Ch.2012$ (black), consumption in Ch.2012$ (light blue), and monthly GDP in Ch.2012$ (pink), GDP (blue bars), 2023Q2 is GDPNow of 6/30, all log normalized to 2023M01=0. Bloomberg consensus level calculated by adding forecasted change to previous unrevised level of employment available at time of forecast. Source: BLS, Federal Reserve, BEA 2023Q1 3rd release via FRED, Atlanta Fed, S&P Global/IHS Markit (nee Macroeconomic Advisers, IHS Markit) (6/1/2023 release), and author’s calculations.
Maybe there’s a slowdown in the past few months (consumption flat, but personal income ex-transfers up), but the recession does not yet appear to be here (subject to the caveat all these data will be revised, including GDP very substantially).
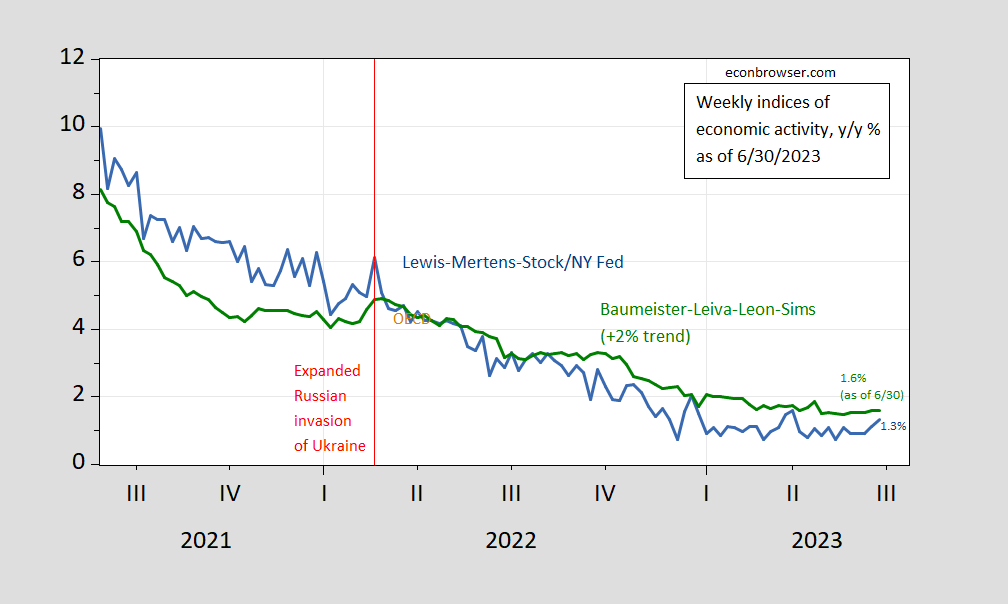
Weekly indicators support continued y/y growth, although taken literally they also imply (given Q1 GDP) negative growth in Q2.
Figure 2: Lewis-Mertens-Stock Weekly Economic Index (blue), and Baumeister-Leiva-Leon-Sims Weekly Economic Conditions Index for US plus 2% trend (green), all y/y growth rate in %. Source: NY Fed via FRED, WECI, accessed 6/30, and author’s calculations.
More By This Author:
Real Defense Consumption And Investment, 1960-2023Q1Does The Fed Care About What’s Going On In The Rest Of The World?
Inflation Across Some Countries


