

Figure 1: US defense consumption and investment, in bn.Ch2012$ SAAR (blue). NBER defined peak-to-trough recession dates shaded gray. Note 1960-2001 data converted to 2012$ using index. Source: BEA, NBER, and author’s calculations.
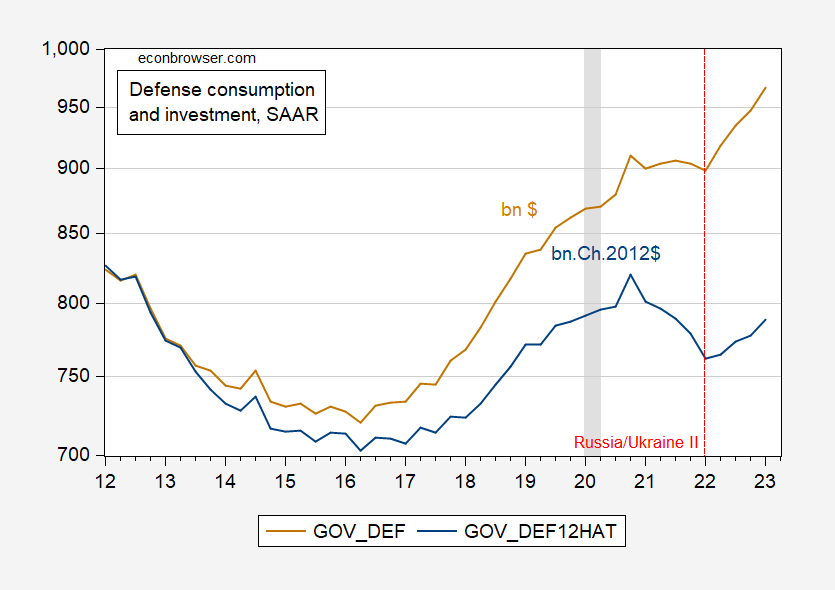
Figure 2: US defense consumption and investment, in bn.Ch2012$ SAAR (blue), in bn.$ (tan). NBER defined peak-to-trough recession dates shaded gray. Source: BEA, NBER, and author’s calculations.
Bottom line. It is useful to understand the difference between nominal and real magnitudes.
More By This Author:
Does The Fed Care About What’s Going On In The Rest Of The World?Inflation Across Some Countries
Recession Probabilities Based On Multiple Financial Measures


Comments
Log in or sign up to join the conversation.