

Image Source: Pixabay
Okay, this is an actual slice of life of October 1929. You do know what happened during that month, don’t you?
Here’s how the month started off:
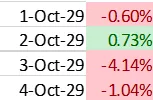
This was a net loss of greater than five percent for the first four days of the month, and the world wasn’t used to that. The “roaring twenties” was outsized continual gains for a decade and this was anomalous.
But on the very next trading day, Monday, October 7, 1929, stocks leaped six and a half percent, turning the month positive in one session.
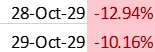
Three weeks later all hell broke loose with these back-to-back Monday and Tuesday sessions together comprising what we know now as the Great Crash:
Having said that, did the world conclude everything was falling apart? Well, yes, there was considerable panic. Guys were jumping out of windows to their death, mostly men in the business who had leveraged everything to the hilt, losing several times their net worth, with no hope of paying it back. You’ve seen the pictures of the ones who didn’t commit suicide, putting their luxury cars for sale right on the street. You’ve also seen the pictures of these once flush men selling apples, pencils, and begging with outstretched arms, tin cups in hand. Then came the tent city “Hoovervilles.”
But a great many “experts” weren’t so pessimistic. Why was that?
Because some of them were looking at it this way:
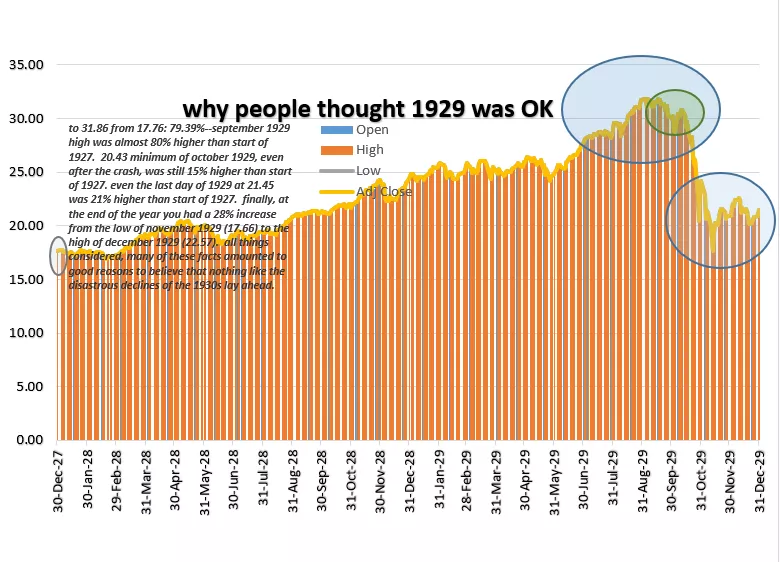
Here’s the callout I’ve noted, so you can read it more easily:
To 31.86 from 17.76: 79.39%--September 1929 high was almost 80% higher than the start of 1927. 20.43 minimum of October 1929, even after the crash, was still 15% higher than the start of 1927. Even the last day of 1929 at 21.45 was 21% higher than the start of 1927. Finally, at the end of the year, you had a 28% increase from the low of November 1929 (17.66) to the high of December 1929 (22.57). All things considered, many of these facts amounted to good reasons to believe that nothing like the disastrous declines of the 1930s lay ahead.
Even in the immediate time frame of that fateful Monday and Tuesday, there were ways to see hope:
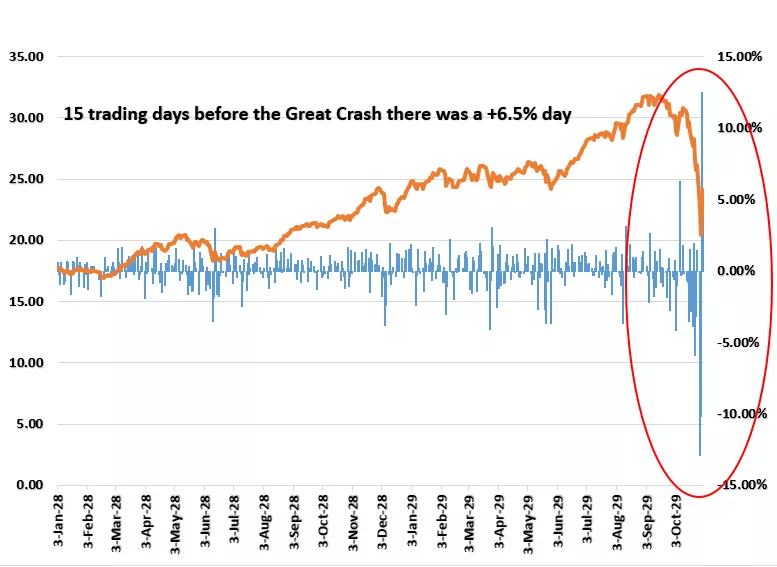
Not only was there the +6.5% day 15 trading sessions prior that put the month positive, but the day following "black Monday and black Tuesday" that took the market down ~20% there was a +~12.53% day.
But then the market just swooned and swooned and swooned until June 1932, about -80% to -90%.
Video Length: 00:04:55
And the misery rolled on as the stock market crash turned into a banking crisis with hundreds of banks failing nationally and globally; the stock crash evolved into a massive banking debacle and the Great Depression. In terms of share values the clock got turned back to the 1880s, and many companies and their stocks just disappeared entirely.
Well, fast forward to 2022, and there was Art Cashin the CNBC commentator on the air as the midweek liftoff just passed got started and it seemed like he was well aware as a man of his years should be that things looked a lot like the October 7, 1929, session that turned that month positive as events conspired to do the same thing to November 2022. But he doesn’t and can’t know what the next three weeks, three months or three years may bring, so he advised “motion control pills,” and as you can see, the chart above that shows you the daily percentage swings confirms his caution.
So the views of Cashin and detecting volatility via increasing absolute values in swings augmented by volume punctuation and other tests are critical to detecting market inflections and directional trends and thus critical elements of the RLH Volatility Model. So we will examine the numbers based on that “motion control” methodology.
If we were now to “go back to 1880s prices” as happened by 1932, that could be as low as 500 on the S&P 500. And if it took as long as 1954 to return to 1929 highs following the Great Crash, be prepared for a long siesta between now and 2047, and also say your prayers that period doesn’t contain a depression, a world war, and a regional war in Asia--70 years later the consequences of which still comprise the most heavily armed border in the world.
What are some things to be thinking about as we ponder what lies ahead?
- Well just like the 1920s leading into the depression of the 1930s, there is a very disparate financial and economic picture, with high volatility spanning the entire period since 1984 when Alan Greenspan set bonds on a near-permanent upward trend and, in the latter realm, folks in the economy who work in finance and tech way outperforming those who do everything else (at least in the private sector; in the public sector it’s a pretty good gig and that’s a whole new scenario by way of comparison to the period a century ago).
- Political conditions are also on the brink. In the periodic closing of the 1920s, a huge shift was about to occur as the baton was passed from Herbert Hoover to FDR. Today, we have the incredible spectacle of a former president who was impeached twice being that party’s strongest candidate (some may dispute that), and a midterm election with very mixed results, assuming we even know what those results are, since in some states like Florida the results can be counted in a matter of hours (even though that state has one of the larger populations in the nation) whereas in a state like Arizona, it is surprise after surprise from one minute to the next as votes materialize out of the blue in sizable quantities. Expectations of red waves turn into actual outcomes that are barely pink. The polls all say 70% of the electorate thinks we’re on the wrong track, predictions of a red wave fit into that observation, and then essentially nothing happened. Are we losing self-consciousness?
- The crypto debacle. I can only think of Charlie Munger musing, “Why didn’t they ban it?” and the fact that so few people seem to have that point of view. How did so many people get drawn into something like this? How did FTX get so big, and then so tiny—so quickly? Why is this industry run by people who go on TV in shorts and t-shirts and jiggle their legs like a nervous wreck the whole time? Who wants to do business with this kind of culture, institutional or individual, or doesn’t see how much BS is involved in describing the “product?” How can this be seen as anything but the most extreme form of blind and ignorant greed characteristic of the tops of the topmost bubbles, such as the tulip mania of the 1600s?
- Now let’s ponder what I call the constant tendency to get stuck in static analysis rather than dynamic analysis. This is something people do all the time, not just during crazy inflections (when its misleading effects are most serious).
What it means is this: If something like the price of oil doubles, triples, or quadruples, the effect is not limited only to its immediate impact on cost inputs such as the price of a loaf of bread. It has spinoff effects too: to extend the bread analogy, the first (static) effect is the price of bread.
I have some models for the oil price to go as high as $400. And I’m here to tell you if you have that for the price of oil, you will have $50 for the price of a loaf of bread. But it doesn’t stop there, because to a typical bread consumer—a typical family—the price of a loaf of bread is like the price of oil to the baker who makes and sells bread to retailers. It takes a big bite out of your butt and completely changes your future and how you pay for it. And this is when static analysis becomes dynamic analysis. That is, what changes do you have to make to withstand $50 bread? Do you stop going to the movies? Do you stop buying new clothes? Dynamic analysis means that the impact doesn’t stop with the baker, it extends to the consumer of bread and his impact on clothing manufacturers and retailers, Hollywood producers, directors, actors, and extras…and then all those consequential players’ activities in their purchases. “Butcher, baker, candlestick maker,” to coin a phrase.
The Entire Reason Static Analysis Fails To Inform Future Decision-Making Is Because It Looks At One-Time Effects In The Limited Parameters Of The Immediate And Fails To Take Into Account Spinoff Effects Beyond That. Insofar As Energy Inputs Are Concerned, This Causes Especially Perilous Misunderstanding.
This is the reason that there has never been a stock market bottom established prior to the recession it is meant to cause by the Central Bank interest rate policy playing out its effects on jobs, wages, consumer demand, and so forth. It’s actually a form of madness. First, the policymakers inject trillions into the economy for liquidity, denying there will be an inflation problem or contending that the inflation prospect isn’t as risky as the specter of another credit meltdown like 2008. Then, when inflation comes, they switch gears and promise to fix the mistake they caused. Then, when the timing is right, they seize on any excuse possible to abandon the tightening that’s killing the economy, even if it’s as lame as claiming an inflation number of 7% is a big relief from the predicted 8%. So back and forth this financial Jekyll and Hyde swings with no regard for all the debt that is spawned, all the crazy spending, or how it will be financed. Just a false impression that “things are working out as planned” and “this is responsible policy.” And Fed policy now includes environmental, and ethical diversity goals. What?
So let’s look at the future that way, and keep in mind that when we have a dynamic analysis process rather than a static analysis, what we are doing is considering a stock market that is in the final phases of a bull market in its death throes—to look at that as a bottoming process is way premature. That is why it is no surprise that we are seeing equity strength in industrials and their associated indexes like the Dow Jones Industrial Average and the SPDR XLI. It’s essentially a blow-off top, not a bullish resumption trend but the market thinks it’s the latter. And wait till dynamic results catch up with static assumptions and the world notices what happens to margins and earnings as interest and other inflated costs hit the top line with far greater than anticipated costs. It is entirely reasonable with persistent inflation at current levels for S&P 500 earnings to come down to levels far lower than currently projected.
With this dynamic perspective in mind, is the industrial sector a continuation pattern, or is it a blowoff top?—Insights from the RLH Volatility Model
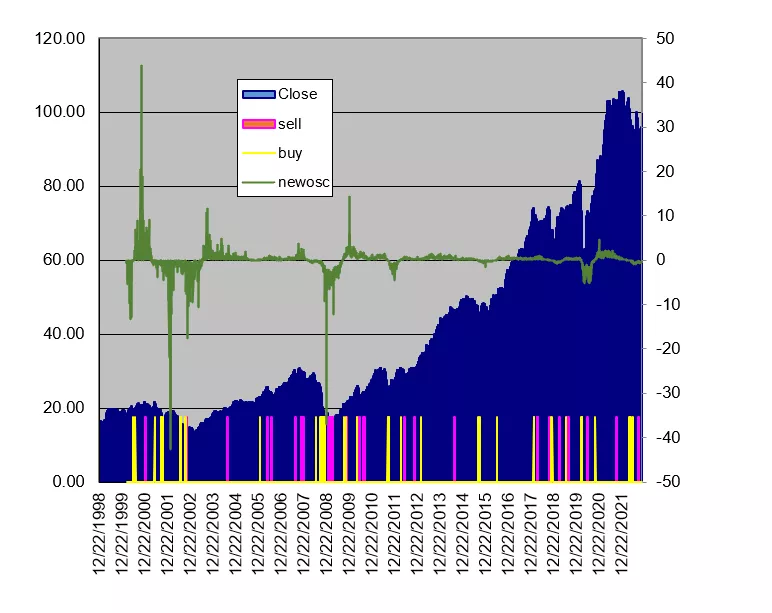
Compare the solid buy signal indication accompanying the bottom of 2008 – 2009 with the tepid buy signals now. The latest indicators are sells.
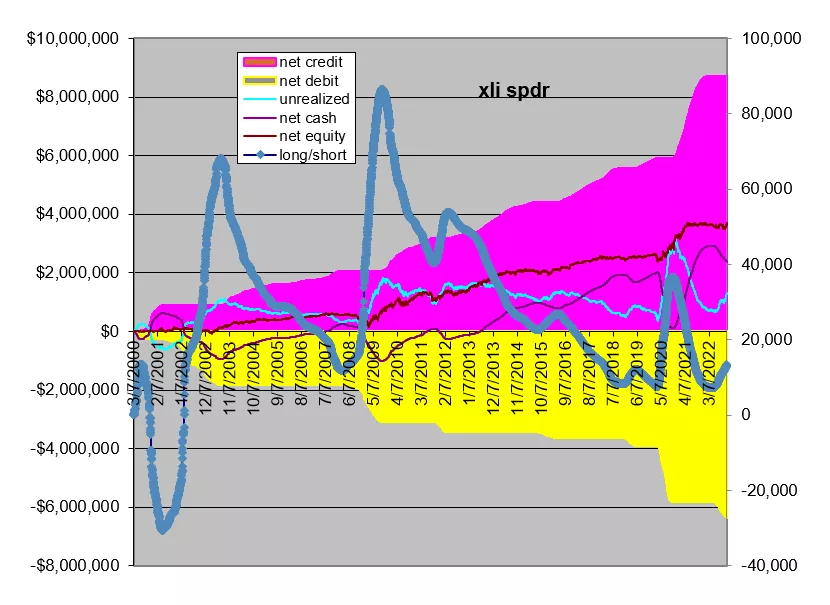
The above chart is the same indicators for XLI (the industrial SPDR) on a proportionate basis. The blue line which is what the RLH Volatility model has determined in terms of net long and short positions indicates that this sector is still warranting a very bearish point of view and position.
Here is a look at the US treasury market with durations above ten years as represented by the SPDR TLT:
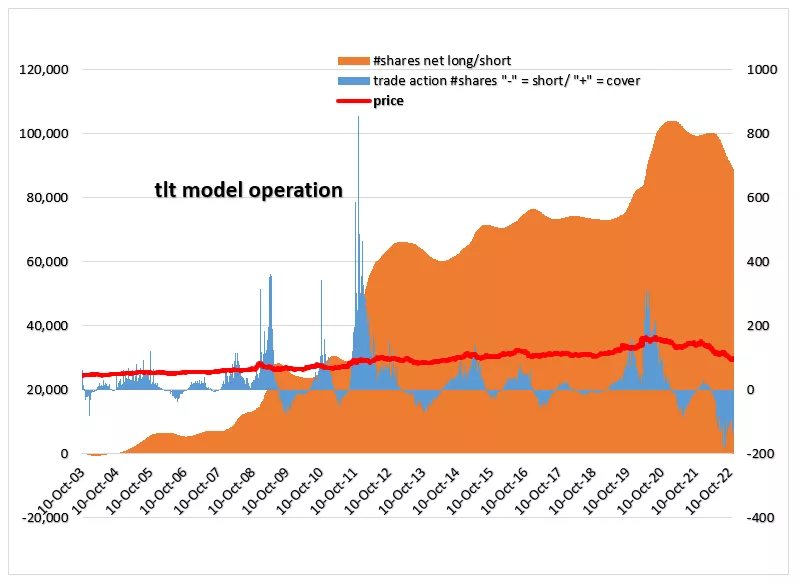
Again, the outlook as reflected by trade actions indicates all-time lows going back almost two decades.
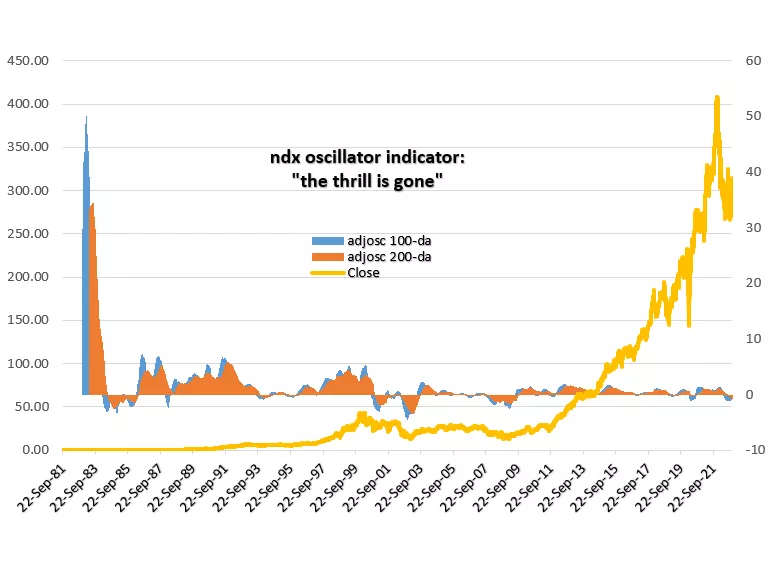
Now let’s look at the Nasdaq market because that is a proxy for tech and last week’s cat on a hot tin roof rally is based on the idea that tech is suddenly shifting from the market’s worst sector, pulling it down in trillions of market cap all year, to the leader that starts a new uptrend. How often does the worst laggard turn into the leader sector savior overnight? Is this realistic or historically accurate? Shouldn’t folks be looking into this question rather than just assuming?
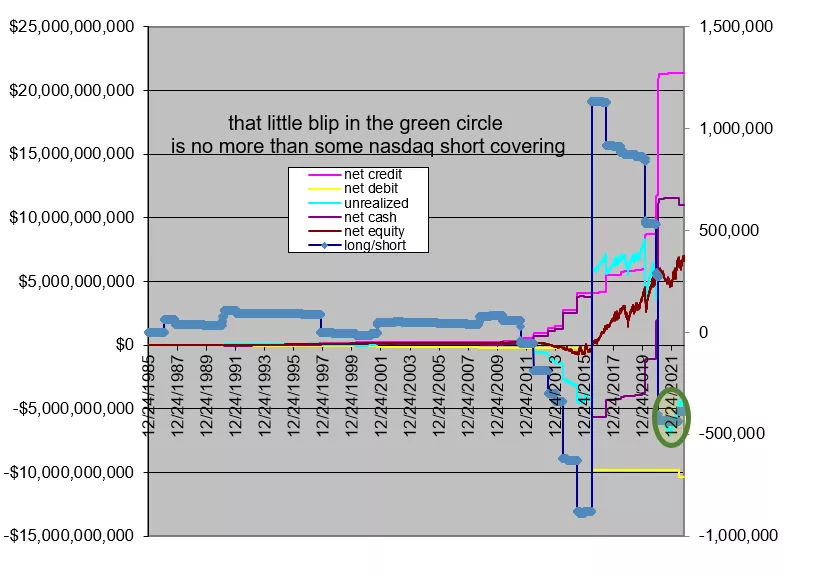
The RLH Volatility model says “forget it.” There is a slight blip in Nasdaq upward positioning on long vs. shorts but that is easily attributed to short covering. We’re not at 2015 long/short lows, perhaps, but the model hasn’t had a long-term bullish view for two years. It took all the money off the table before 2020 had run its course.
A look at the NDX leadership of Nasdaq stocks with the (top 100) largest capitalization confirms the same conclusion:
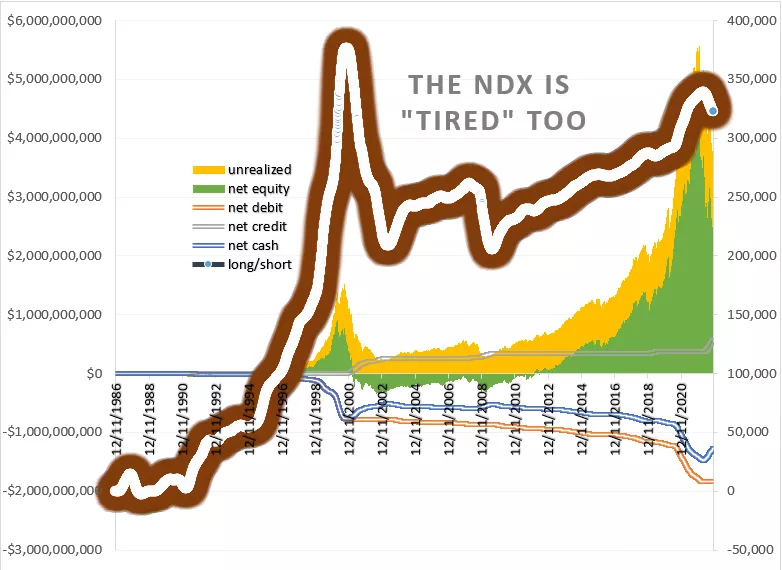
It’s turning down, taking money off the table. And it’s doing so in a manner eerily similar to 2008 tops.
We already looked at the treasury market at the long end of durations and the news there doesn’t seem to be pretty. So then the implied question from that is what pathway do we choose from the fork in the road that suggests? Homebuilding is a beneficiary of low-interest rates, and rates seem to be on a rising trajectory. Energy is in a state of runaway inflation which is the reason the central banks are pursuing tightening. So how ‘bout we look at the XLE SPDR, and also look at HD?
Here’s Home Depot (HD). In terms of the RLH oscillator analysis, its attractiveness is withering away and has been doing so for a long time despite massive price gains. I think with rates on the rise, the reality is about to catch up with the indicators. This will occur when we start seeing price balks in residential asking levels. Think of it as the coyote and the roadrunner hanging out in space; they’re fine—until they look down.
And energy (XLE)? Does the RLH Volatility Model indicate oil has peaked and the Fed can get ready to pivot, that word to which experts attribute the recent stock-market explosion?
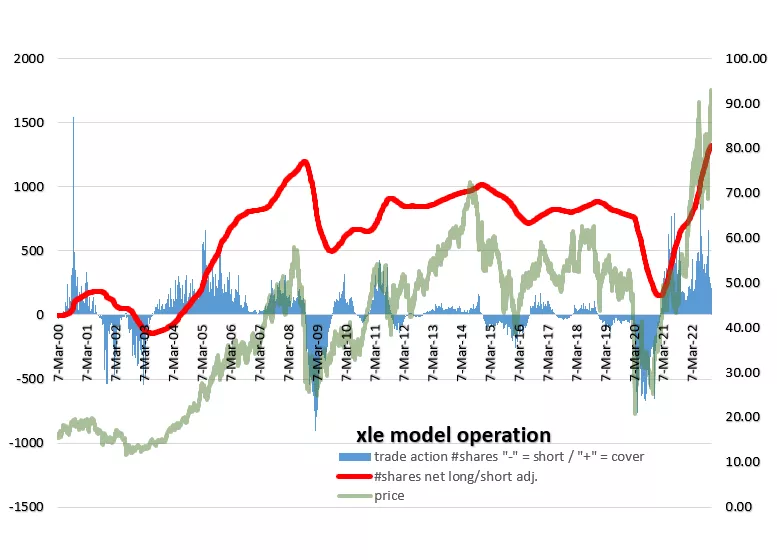
Nope, not even slightly. The RLH Volatility Model has the XLE positioned at its highest levels of long/short levels in its entire history. That doesn’t sound like the kind of thing that makes Jay Powell and company content that they’ve finished their job of taming the inflationary beast, and I suspect that job turns out to be a lot stickier and drawn out than practically anyone imagines.
Researchers at Goldman Sachs have highlighted the astounding fact that over recent years we have “invested” $4 trillion to develop alternative energy sources sufficient to reduce fossil fuel use by a single percentage point. Policymakers are following up on this by recommending and mandating further action that would amount to spending such sums for such outcomes annually. One has to wonder if legitimate contributions to climate and other environmental improvement warrant such outlays for results that can only be described as productivity backwardation. Combined with rapidly obsoleting urban/suburban commutation models as connectivity replaces office use, mandates that reduce agricultural output, and shifting priorities in school curricula that are accompanied by declining proficiency as evidenced by test scores, we will soon see what the economic impact is on the ability to heat in the winter, and to produce food and fuel. Major tests on this score are likely to occur this winter, especially in the British Isles, continental Europe, and the New England region of the United States. As interest rates continue to rise in the face of inflation now laughably said to be “cooling,” we will also see an attendant consequence on the financial markets’ ability to bid on still massive and still mounting debt contracted to finance these policy goals. There is no way these things cannot impact markets.
More By This Author:
Are We In A Good Place?
Crosscurrents, Shocks, Surprises, Murkiness, Confusion And So On
Is A Crash Coming?


Comments
Log in or sign up to join the conversation.