
According to Bloomberg, Fannie Mae and Freddie Mac have been increasing the mortgages and mortgage-backed securities they hold on their own balance sheets. At their peak, before the financial crisis, Fannie and Freddie held a combined total of $1.6 trillion in mortgages. As we share below, courtesy of Bloomberg, their portfolio sizes are well below what they were, but they have begun to grow. To wit, Bloomberg notes that their combined portfolios have increased by 25% over the past five months and could increase further. There are three potential rationales for the growth.
- By absorbing mortgages that would have gone to the secondary market, the supply of fixed-income products declines, pushing yields on MBS and Treasuries lower.
- Fannie and Freddie’s actions will compress MBS spreads toward UST yields, thereby improving housing affordability on the margin.
- If the administration plans to sell Fannie and Freddie to the public via an IPO, larger balance sheets should translate into higher stock prices, resulting in a larger windfall for the government.
From a market perspective, the reemergence of GSEs as meaningful buyers changes the dynamics of the agency MBS market, with implications for all fixed-income markets. In addition to reducing MBS risk premiums, as noted above, their actions should dampen market volatility. The key question is whether this remains a temporary tool or is a prelude to a sustained balance-sheet expansion. Per the Bloomberg article:
“If the ramp-up in the GSEs’ portfolios continues, they would become one of the most important buyers in the market, and that would force investors to pay very close attention to their every move,” said Mario Ichaso, a strategist at Wells Fargo & Co. “The mantra becomes, ‘Don’t fight the GSEs.’”

Michael Lebowitz, CFA
What To Watch Today
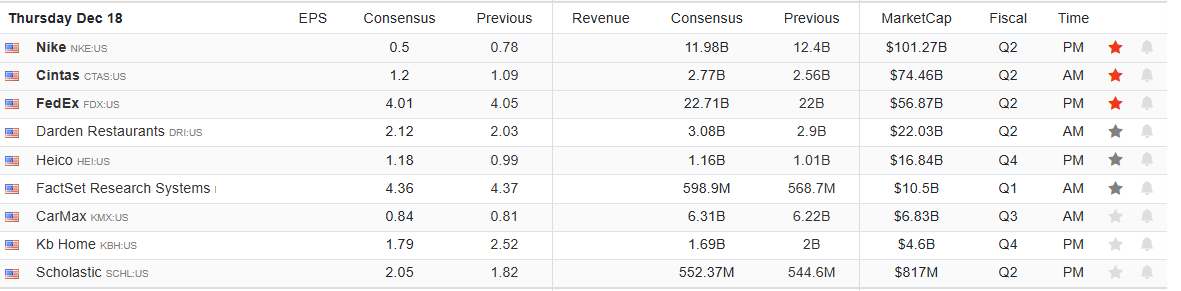
Earnings
(Click on image to enlarge)
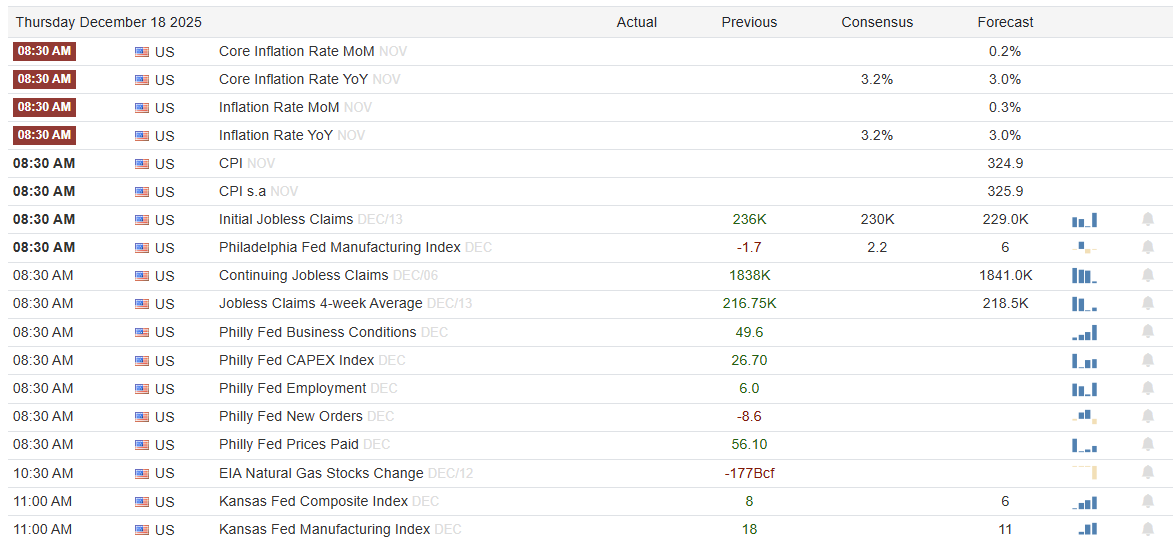
Economy
(Click on image to enlarge)
Market Trading Update
Yesterday, we discussed the potential issues with the latest economic data as it relates to forward earnings outlooks. However, in the near term, markets declined for a fourth consecutive day. The losses were concentrated in AI-related and tech stocks, including Broadcom, Oracle, CoreWeave, and Nvidia. The catalyst for the sell-off was news that Blue Owl, which had provided the debt financing to Oracle to build out its data centers, had withdrawn. That news weighed on overall indexes as concerns rose on whether the AI boom can sustain expected returns, especially in companies with lofty valuations or heavy leverage.
“As The FT reported, Oracle’s largest data centre partner, Blue Owl Capital, will not back a $10 billion deal for its next facility, as the software group faces increased concerns about its rising debt and artificial intelligence spending. The private credit provider had reportedly been in discussions with lenders and Oracle about investing in the planned 1 gigawatt data centre being built to serve OpenAI in Saline Township, Michigan. But the agreement will not go forward after negotiations stalled, according to three people familiar with the matter.”
Another report described markets in a “significant recalibration,” with traders focused on Fed policy uncertainty and cooling economic indicators.
Whatever the real reason, profit‑taking and rotation out of mega‑cap tech stocks weighed on the major markets. Of course, the selloff’s timing is critical for the so‑called “Santa Claus” rally, which, at least for the moment, seems at risk. Notably, this sell-off comes at a crucial juncture as we head into volume-light, holiday-shortened trading week beginning on Monday. Yesterday morning, VIX options expired, putting pressure on the markets as the selloff bled out long-vol positions and reduced gamma.
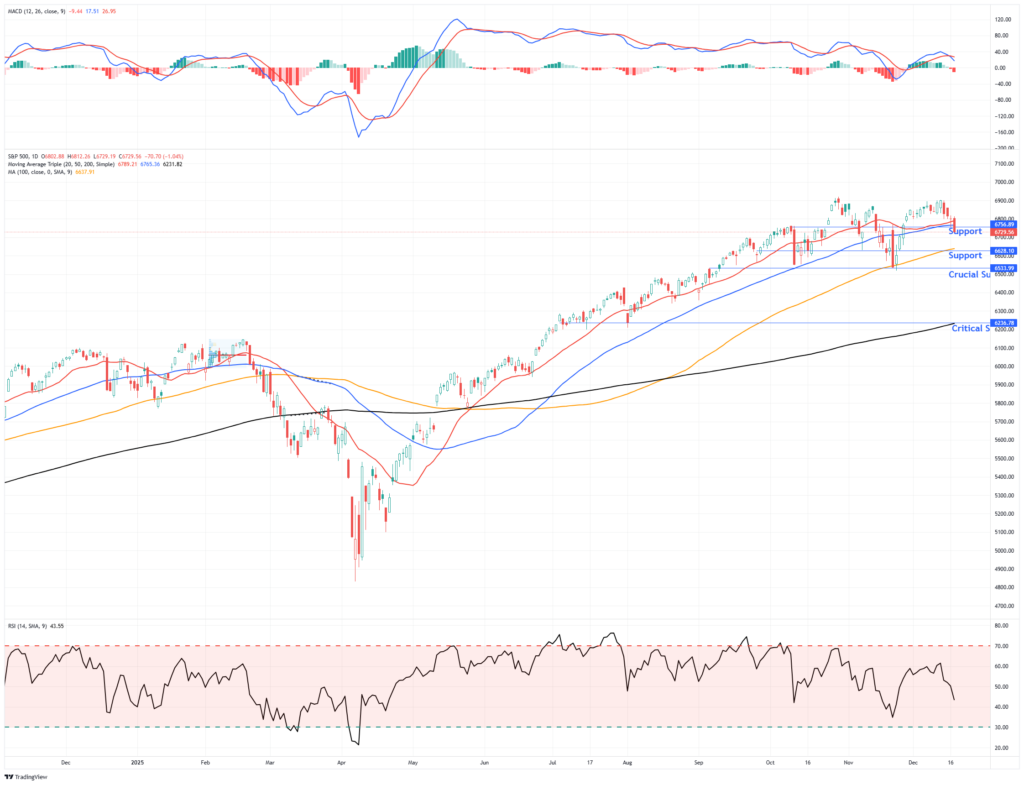
Notably, the market did violate the 20 and 50-day moving averages, keeping the current consolidation process from early October intact. That violation brings in support at the 100-day moving average just above 6,600. With the market not deeply oversold yet, and on a momentum “sell signal,” the near-term risk is to the downside until Christmas. However, following Christmas, a reflexive rally into year-end seems likely.
(Click on image to enlarge)
Until then, however, trade with a focus on risk-management rather than chasing returns.
Time For A Rotation To Utilities?
The SimpleVisor rotation tracking tool shown below indicates that utilities are significantly oversold on both an absolute and a relative basis. At the same time, the transportation sector has been the most overbought for the last few weeks. From a fundamental and historical perspective, one could say the market believes the economy is rebounding to the benefit of the transportation sector. As a result, interest rate-sensitive sectors will be negatively impacted by higher interest rates that often accompany strong growth. If, however, you don’t subscribe to that view, we can use technical analysis to compare the two sectors and identify when the relative performance between transportation and utility stocks may shift in utilities’ favor.
The second graphic shows and applies technical indicators to the price ratio between the utility and transportation sectors. As we highlight in the box, the ratio has declined from approximately 0.55 to 0.45, indicating utilities have underperformed by about 20% over this relatively short period. The middle graph is our proprietary momentum oscillator. The ratio is very oversold, but the signal has not yet crossed above the oscillator, so it does not indicate a potential change in direction. The MACD at the bottom suggests the relationship is very extended, consistent with our gauge, and has yet to show a bullish crossover in utilities’ favor. That said, the gap between the lines is narrowing and appears to be approaching a crossover. Such a crossover may be a strong early signal that utilities are poised to outperform transportation stocks.
While not shown, the MACD on the utilities-to-S&P 500 price ratio just registered a buy signal from low levels. Bottom line: keep an eye on utility stocks, as their recent underperformance may be nearing an end.
(Click on image to enlarge)

(Click on image to enlarge)

QE Is Back: Which Assets Benefit The Most?
QE is back! On December 10th, the Federal Reserve announced its plan to purchase $40 billion in Treasury securities each month for at least four months. Through these QE purchases, bank reserves will increase, and recent liquidity concerns should lessen. Furthermore, increased liquidity often leads to more speculative market conditions and higher asset prices as leverage becomes cheaper and easier to access. The question, of course, is which financial assets may benefit the most from QE?
This article follows recent articles on why and how the Federal Reserve provides liquidity (Fed Regime Change and How The Fed Deals Liquidity) to the financial markets. Building on that understanding, we now take the next logical step and quantify the relationship between liquidity and asset price movements. This enables us to anticipate which assets are most likely to benefit from the latest round of QE, as well as which assets trade independently of liquidity changes and may provide diversification.

Tweet of the Day

More By This Author:
Kevin Warsh Or Kevin Hassett?Warsh Is In The Race: Fed Chair Odds In Flux
Bull Market Genius Is A Dangerous Thing


Comments
Log in or sign up to join the conversation.