
Yesterday’s Commentary discussed Trump’s inclusion of Kevin Warsh in the race for Federal Reserve chair. Today, we compare some key differences between Kevin Warsh and Kevin Hassett. Understanding what each contributes to the Fed helps us better assess their effects on capital markets.
Kevin Warsh was a Fed Governor from 2006 through 2011. We learned that Kevin Warsh believes the Federal Reserve should play an integral role in supporting the economy and financial markets during a crisis. However, unlike many Fed members, he is not a fan of using QE in a more normal market environment. To wit, he once referred to QE as a “reverse Robin Hood.” Furthermore, he has stated that QE misallocates capital from the economy to the financial markets.
Kevin Warsh began his career on Wall Street; therefore, he has a better understanding of capital markets and the Fed’s impact on them. Hassett has been a lifelong economist, both as an economics professor at Columbia and in various high-level economic roles in the government. Like many Federal Reserve members, he lacks real-world experience.
Warsh is viewed as more hawkish than Hassett. He has frequently mentioned the inflation risk associated with dovish monetary policy. Moreover, as we noted above, he has expressed skepticism about aggressive QE. Conversely, Hassett, viewed as dovish, actively advocates deeper rate cuts to stimulate growth.
Kevin Warsh adheres to a Milton Friedman-style logic: inflation is a function of excessive money-supply growth. Based on recent speeches, Hassett is focused on growth-oriented easing and is not overly concerned with inflation.
Hassett likely appeals more to President Trump because of his dovish views. However, Kevin Warsh lends greater credibility to the Federal Reserve’s promise to reduce inflation. Additionally, Warsh is more likely to improve sentiment in the bond market, thereby lowering long-term yields.
What To Watch Today
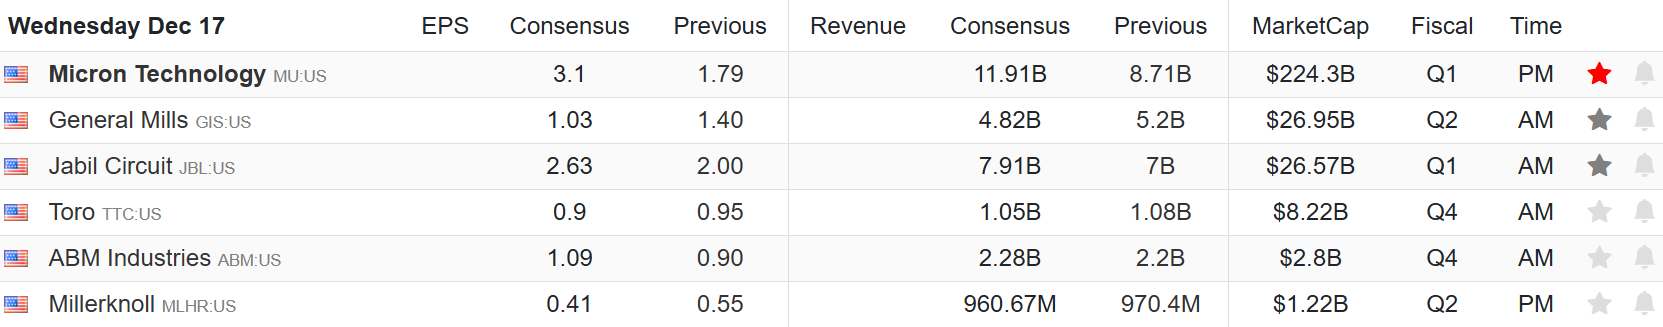
Earnings
(Click on image to enlarge)
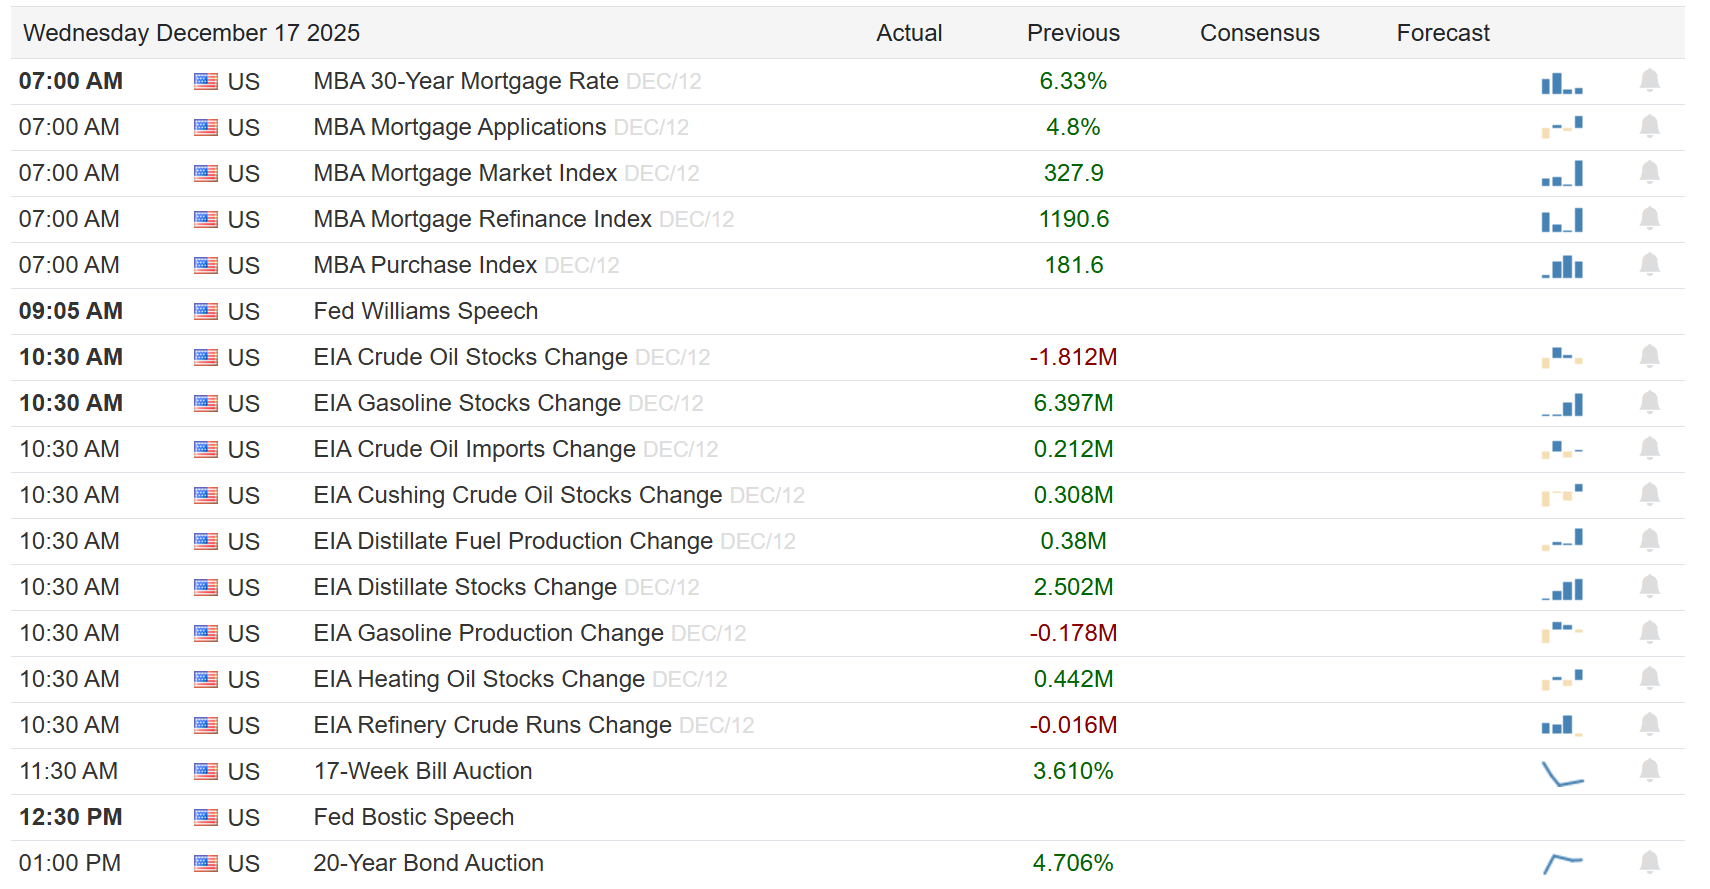
Economy
(Click on image to enlarge)
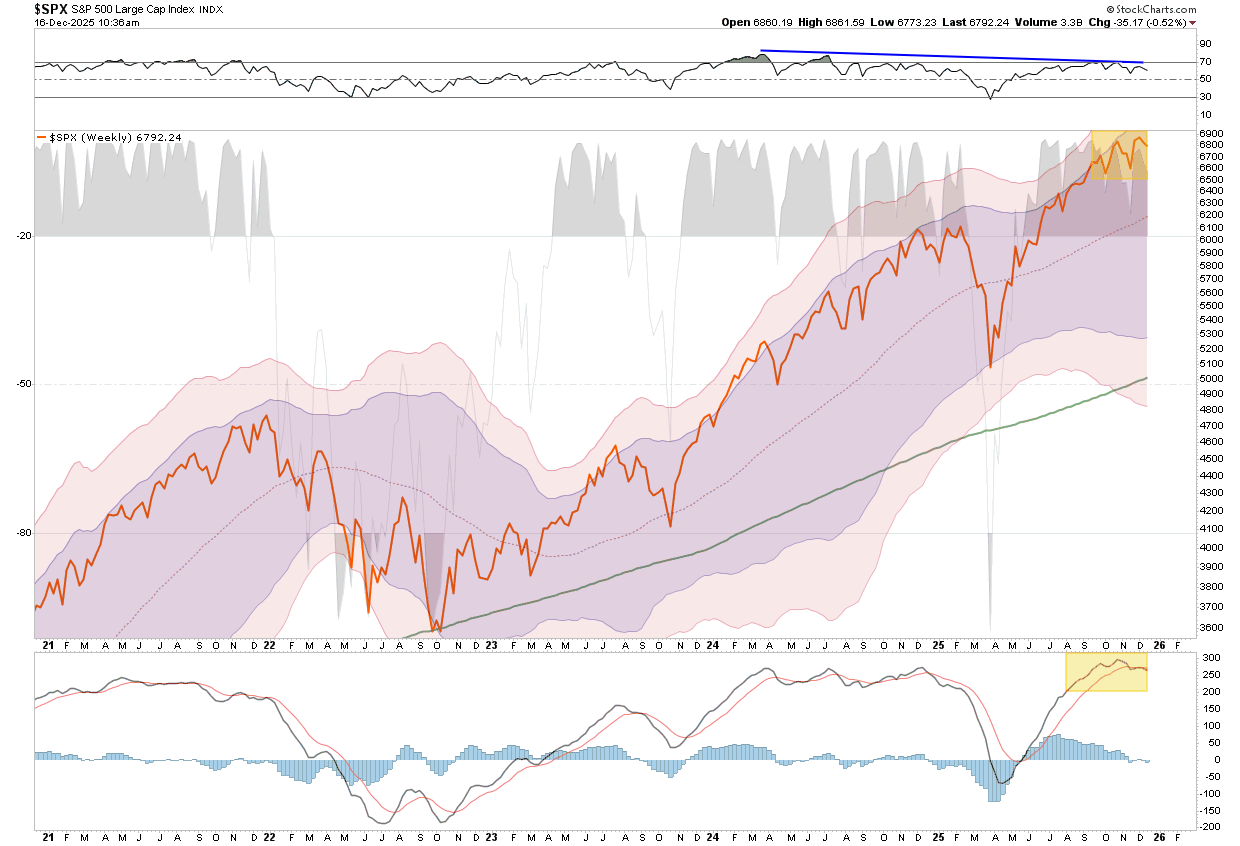
Market Trading Update
Yesterday, we discussed the start of the seasonally strong period of December through the year-end. Notably, yesterday also saw a large slate of economic data from employment to retail sales. The data dump covered the October and November reporting periods.
For example, the delayed November jobs report showed payrolls rose by about 64,000 in November, following a large drop of roughly 105,000 jobs in October, with revisions lowering earlier gains. This left the labor market weaker than expected, and unemployment elevated near multi‑year highs. Furthermore, retail sales data for October, also delayed by a government shutdown, showed flat overall spending, weaker than forecasts of modest growth. Business activity indices such as the S&P Global PMIs pointed to slowing growth in services and manufacturing, with composite activity at the weakest in six months.
All of this suggests weaker economic growth going forward at a time when analysts estimates for earnings growth, particularly for small and mid-cap companies most affected by economic weakness, are very exuberant.

Stocks reacted with caution, with major indexes including the S&P 500 and Nasdaq trading lower on the day. Given the run-up since April, some profit-taking and rebalancing were unsurprising, as investors parsed conflicting economic clues.
The somewhat disappointing employment and flat retail sales imply slower growth ahead, which will likely keep the Fed leaning toward further rate cuts. However, slower consumer spending is a headwind for cyclical sectors and retail stocks, and weak job markets reduce consumer income growth, which in turn stresses retail demand and lowers forward earnings expectations.
With the market trading well above its weekly and long-term moving averages and overbought on multiple levels, the risk of a weaker market next year should not be underestimated. The negative divergence of relative strength on a weekly basis is also somewhat concerning.
(Click on image to enlarge)
Investors are heading into year‑end still digesting conflicting signals as growth appears to be slowing, but not collapsing. That ambiguity keeps markets rangebound and increases sensitivity to Fed communication and any further data before the holidays.
Trade accordingly.
BLS And ADP: Signs Of Recovery In The Labor Markets?
For the first time in over two months, the BLS updated its labor market status report. Due to the shutdown, this report shared data from October and November. October jobs fell by 105k, while they rose 64k in November. Net, net, the jobs market is poor, but the gain in November may give some hope that the trend is reversing. Also of note, the unemployment rate rose to 4.6% from 4.4%. Interestingly, the U6 unemployment rate, a more inclusive measure of unemployment, rose sharply from 8.0% to 8.7%, as shown in the top graph below.
ADP, in its new weekly reporting format, says the economy added 16k jobs last week, following a gain of 2k in the prior week. The near-real-time data corroborate the November BLS job gain. However, we are in the midst of volatile holiday employment activities, thus the data will likely be revised in the future. The second graph below shows that, using revised BLS data, ADP and BLS track closely. Assuming this continues, the weekly ADP reports will serve as a useful near-real-time gauge of the labor market.


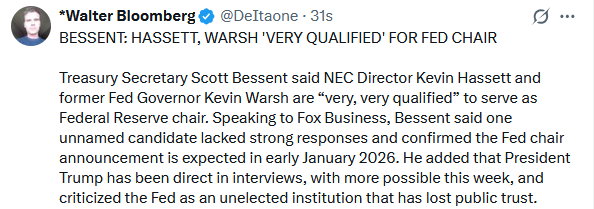
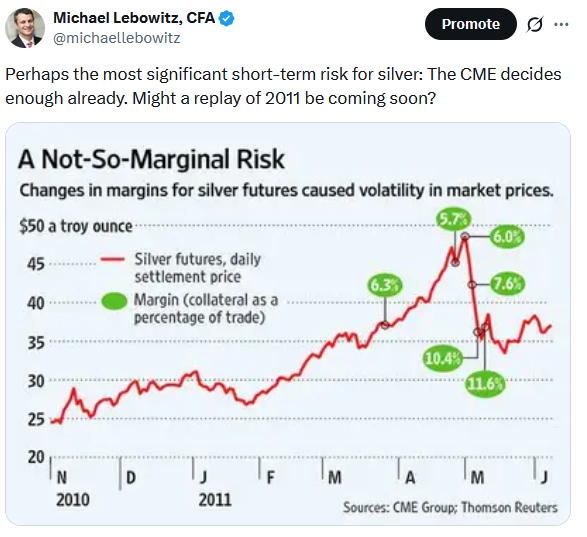
Tweet of the Day
More By This Author:
Warsh Is In The Race: Fed Chair Odds In FluxBull Market Genius Is A Dangerous Thing
SpaceX: A Financial And Strategic Windfall For Google


Comments
Log in or sign up to join the conversation.