

Image Source: Pexels
QE is back! On December 10th, the Federal Reserve announced its plan to purchase $40 billion in Treasury securities each month for at least four months. Through these QE purchases, bank reserves will increase, and recent liquidity concerns should lessen. Furthermore, increased liquidity often leads to more speculative market conditions and higher asset prices as leverage becomes cheaper and easier to access. The question, of course, is which financial assets may benefit the most from QE?
This article follows recent articles on why and how the Federal Reserve provides liquidity (Fed Regime Change and How The Fed Deals Liquidity) to the financial markets. Building on that understanding, we now take the next logical step and quantify the relationship between liquidity and asset price movements. This enables us to anticipate which assets are most likely to benefit from the latest round of QE, as well as which assets trade independently of liquidity changes and may provide diversification.
Bitcoin
According to Bitcoin adherents, the cryptocurrency is outside the financial system. Thus, monetary policy should have minimal effect on Bitcoin.
Crypto investors highlight the following attributes that distinguish Bitcoin from other investable assets.
- Fixed supply: There will be a maximum of 21 million Bitcoin. This differs significantly from fiat money or most financial assets with uncertain supply.
- Decentralization: Bitcoin has no central issuer, company, or government controlling it. Rules are enforced by a globally distributed set of nodes running open‑source software.
- Censorship resistance: Transactions are complicated to block, and holdings are impossible to seize because there is no single chokepoint or controlling authority.
- Immutability and verifiable ledger: Transactions are recorded on a public blockchain that is highly resistant to tampering. Moreover, it provides transparency and auditability.
- Peer-to-peer digital bearer asset: Bitcoin can be instantly transferred between parties at any time over the internet. It does not need banks or brokers to act as intermediaries.
Ironically, while characteristics that depict complete independence from the financial system are a compelling rationale for Bitcoin investors, the Federal Reserve’s policies can significantly affect Bitcoin’s price.
The Irony Of Bitcoin
The line graph below compares the annual percentage change in Bitcoin and bank reserves. We use reserves as a proxy for liquidity because they directly measure the liquidity the Fed is injecting or removing from the banking system.
As shown, the relationship between annual changes in Bitcoin prices and banking liquidity is strong, except for 2020, the first year of the pandemic, as shaded in gray below. The scatter plot below the line graph better illustrates the relationship. We broke the scatter plots into three periods to highlight the relationship before, during, and after the Pandemic.

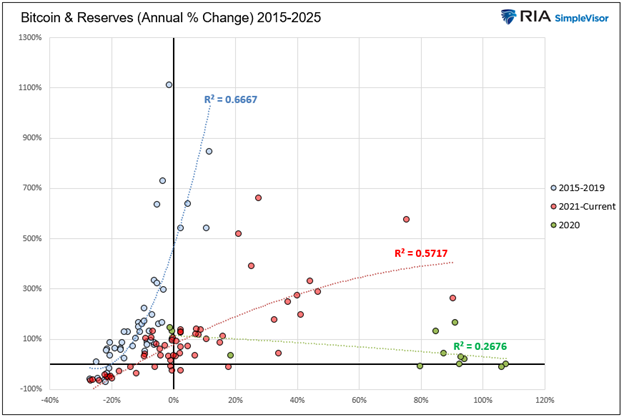
The R-squared values of 0.66 (2015-2019) and 0.57 (2021-current) indicate a meaningful statistical relationship between changes in liquidity and Bitcoin prices. The statistical correlation for the two periods is 0.76 and 0.78, respectively. We will explain these two statistical measures before presenting the data on the other assets.
Some Bitcoin evangelists claim that Bitcoin is outside the government-regulated financial system. This analysis argues that it is highly dependent on the Federal Reserve and the liquidity it provides.
Statistics 101
This article employs correlation and R-squared to assess the relationship between liquidity and various financial assets. The definitions and examples below will help you better appreciate the analysis.
- Correlation (r) measures the strength and direction of a linear relationship between two variables. Correlation ranges from -1.0 (perfectly inverse relationship) to 0 (no correlation), to 1.0 (perfect correlation).
- R-Squared (r2) tells you what fraction of the variation in one variable can be explained by its relationship with the other variable. Like correlation, r2 ranges from -1.0 (perfectly inverse relationship) to 0 (no relationship), to 1.0 (perfectly correlated relationship).
Think of correlation as knowing in which direction a car is driving. R-squared quantifies the proportion of the trip that follows the road.
The graphs below compare strong and weak relationships in annual returns for high- and low-beta factors versus annual changes in bank reserves/liquidity. As shown, high-ETFs are more closely aligned with the trend line; thus, they exhibit a stronger relationship with liquidity than low-beta ETFs.


Equities And Liquidity
With the understanding that even a security like Bitcoin, that supposedly trades purely on its own merits, is meaningfully tied to the system’s workings, let us explore how liquidity affects more mainstream investment assets.
The tables below present the statistical relationships between liquidity and various stock indexes, factors, sectors, and other asset classes. As we did with Bitcoin, we divided the periods into a pre-Pandemic era (2015-2019) and a post-Pandemic era (2021-Current). We omit 2020 due to the irregular events occurring that year.
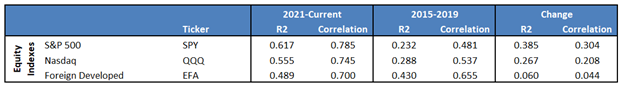
Equity Indexes
The first table, which displays major stock indexes, indicates a strong link between the S&P 500 and the Nasdaq with liquidity in the post-pandemic period. Interestingly, foreign-developed stocks had a stronger correlation with liquidity than the two indexes before the pandemic, but this correlation is now weaker. As shown in the right-hand columns, the r2 and correlation between the S&P 500 and the Nasdaq with respect to liquidity have increased significantly post-pandemic.
Equity Sectors
The more conservative, value-oriented sectors, including utilities, energy, and staples, have minimal correlation with liquidity. Conversely, most other sectors have strong relationships that have strengthened significantly since the pandemic.
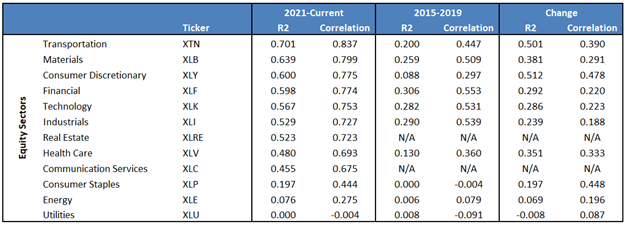
The transportation sector has the best relationship. As shown below, courtesy of SimpleVisor, transportation stocks have become highly overbought over the last few weeks. Might the market have been pricing in the coming QE?

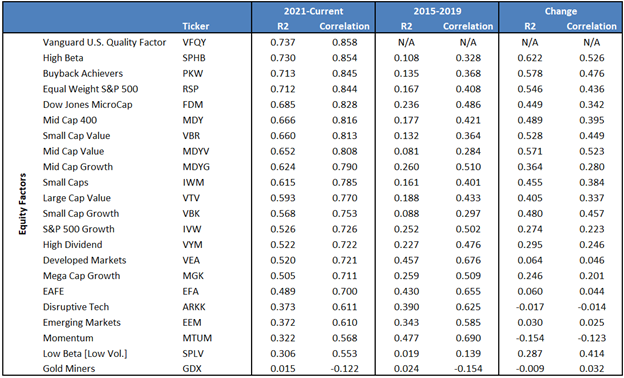
Equity Factors
Most widely followed stock factors are statistically significantly associated with liquidity. Note that high-beta stocks have the second-highest relationship, whereas low-beta stocks have the second-lowest. High-beta stocks attract speculative investors who often use leverage to boost returns. Thus, they are more dependent on liquidity. Low-beta stocks are less likely to be leveraged because they tend to be less volatile and attract more conservative investors.
Other Asset Classes
The table below shows that credit spreads (investment-grade and junk) have strong but negative relationships with liquidity. When liquidity shrinks, spreads widen and vice versa. This is expected, as credit investors commonly use leverage, which is contingent on liquidity.
We were somewhat surprised that gold and silver have no meaningful relationship. Many investors regard precious metals as a hedge against Federal Reserve malfeasance. Bond prices also showed little relationship, which was equally notable. Given that the Federal Reserve is adding or subtracting liquidity through transactions in the bond market, we expected the relationship to be more meaningful. That said, the Treasury yield curve has exhibited some correlation since the pandemic, although very little before then.

Summary
The prices of Bitcoin and most stocks vary from moderately to highly dependent on changes in liquidity. However, some stock sectors, factors, and other assets show weak relationships. During periods of liquidity stress, these can be effective assets for hedging.
With the Fed embarking on QE and bank reserves soon to increase, investors may profit from assets with the strongest relationships to liquidity. Transportation stocks, as we noted earlier, may have jumped the gun, but Bitcoin and some other stock sectors and factors may soon respond favorably.
Note: We started this research because Bitcoin was trading poorly. Given the highly speculative nature of Bitcoin, we interpreted its recent weakness as attributable to dwindling liquidity. The analysis supported our views. Will it start trading higher with QE and rising bank reserves?
More By This Author:
Affordability Crisis: Michael Green Challenges The Poverty Line
Fed Regime Change: Groupthink May Be Ending
TPUs Or GPUs: Is Nvidia’s Moat Eroding?


Comments
Log in or sign up to join the conversation.