
Markets have priced Nvidia as the clear winner in AI chip production. To some, its moat appears impenetrable. Google’s developments suggest there may be some competition. Google has been training and serving its AI platform with in-house tensor processing units (TPUs). These chips are more cost-effective and power-efficient than Nvidia’s GPUs. By using TPUs in place of GPUs, Google appears to be improving its unit economics and, at the same time, is lessening its dependence on Nvidia chips.
It’s not just Google developing TPUs. Meta Platform has its own chip, MTIA, to handle its Generative AI workloads. Amazon’s Tranium also performs similar tasks. Given how the stock market has rewarded Google of late, it’s a good bet that efforts to develop further TPUs will intensify. These new challenges question the assumptions underpinning Nvidia’s premium margins and the “everybody wins” narrative embedded in some Magnificent Seven valuations. To wit, consider the following from John Authers of Bloomberg:
For now, Google’s TPUs remain proprietary. And while Nvidia’s advanced chips are likely to stay in high demand, aiMotive’s Laszlo Kishonti argues that other hyperscalers will be encouraged to develop their own custom silicon, potentially at a fraction of Nvidia’s cost. Google’s chief executive, Sundar Pichai, announced at the recent earnings that TPUs will be made available for sale soon:
We are investing in TPU capacity to meet the tremendous demand we are seeing from customers and partners, and we are excited that Anthropic recently shared plans to access up to 1 million TPUs.
The graph below shows that the market is paying attention to the rise of TPUs and Nvidia’s eroding market share. Bear in mind that Nvidia has proven to be incredibly innovative and cutting-edge, so expect it to offer competing TPU products while maintaining a near-monopoly on its AI GPUs.
For a complete discussion (very technical) on the advantages and disadvantages of TPUs vs GPUs, read this article from Uncover Alpha:

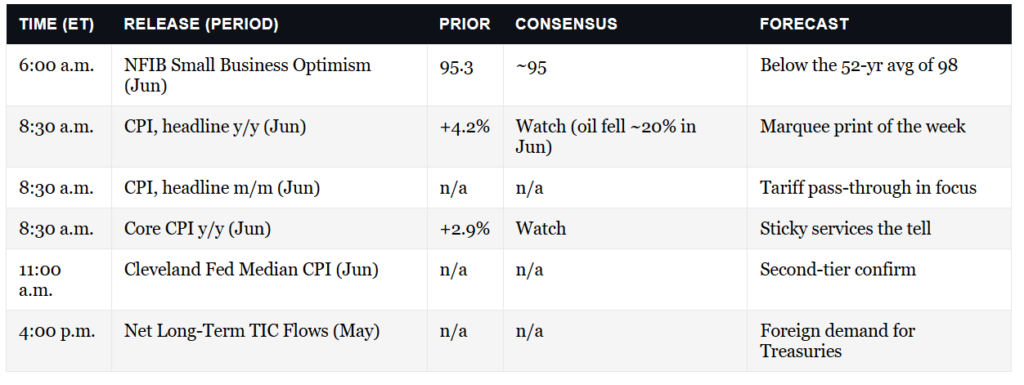
What To Watch Today
Earnings
(Click on image to enlarge)
![]()
Economy
(Click on image to enlarge)

Market Trading Update
Yesterday, we discussed the market positioning heading into the Thanksgiving holiday. For the most part, I would avoid making any investment decisions today as most of the major traders are gone for the Thanksgiving holiday, which leaves the “inmates running the asylum.”
With that said, this gives me, Michael Lebowitz, Nick Lane, and the rest of the SimpleVisor and RIA teams the opportunity to wish you a very happy and blessed Thanksgiving holiday.
Whether you are a seasoned investor or just starting, I believe you will find something useful in these two guides to help you become a better investor.
So, in between the Turkey and the naps, you can print out these guides (all formatted in PDF for printing) and provide some additional nourishment for your portfolio.
Have a very happy and blessed Thanksgiving holiday.
Leveling The Valuation Playing Field
We recently discussed the PEG ratio and how it portrays Nvidia as cheap despite its high P/E ratio. We received a few emails asking for more details, so we thought it was worth sharing some math to help you better appreciate valuations. The PEG ratio is the P/E ratio divided by the expected growth rate. Typically, investors use expected EPS growth for the next 3-5 years. To help appreciate the PEG ratio, let’s start with Nvidia.
Nvidia has a P/E ratio of 43 and a PEG ratio of .92. We can back into the expected growth rate by dividing the P/E by the PEG as follows: 43/.92 = 46. The market expects earnings to grow by 46%. To add context, the PEG ratio on the S&P 500 is 1.82, assuming 12% earnings growth.
Verizon has a very cheap P/E valuation of 8.5. However, its expected growth rate is only 3%, making its PEG ratio close to 3.
Apple has a similar P/E as Nvidia at 37. Its expected earnings growth rate of 10% is well below Nvidia’s, making its PEG ratio higher than Nvidia’s.
We share these examples to help you appreciate that the P/E ratio is a great valuation measure, but without context for expected growth, it can be very misleading. The FinViz table below shows the PEG ratios for S&P 500 stocks.

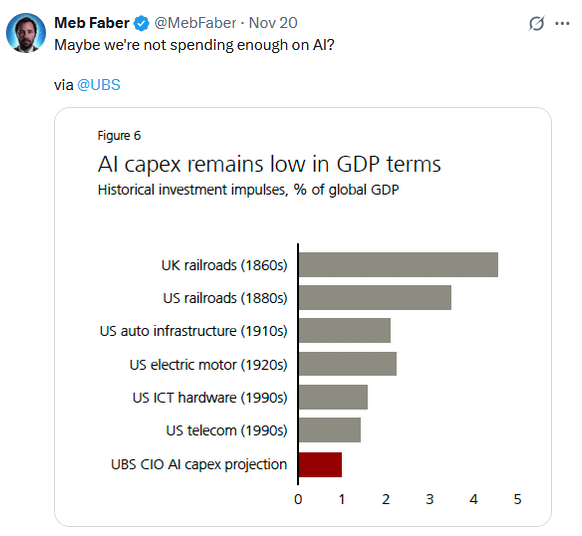
Tweet of the Day
More By This Author:
How The Fed Deals Liquidity: The Monetary ToolboxIs Strategy Dragging Bitcoin Down?
QE Is Coming: The 2008 Roots Of Fed Dominance


Comments
Log in or sign up to join the conversation.