
Here are the latest charts and statistics for the Commitment of Traders (COT) data published by the Commodities Futures Trading Commission (CFTC).
The latest COT data is updated through Tuesday, July 12th and shows a quick view of how large traders (for-profit speculators and commercial entities) were positioned in the futures markets.
Weekly Speculator Changes
COT bond market speculator bets were overall lower this week as just three out of the eight bond markets we cover had higher positioning this week while the other five markets had lower net speculator contracts.
Leading the gains for the bond markets was the 10-Year Bond with a gain of 62,129 contracts while the 2-Year Bond (22,473 contracts) and the Long US Treasury Bond (4,455 contracts) also had higher net speculator positions for the week.
The Bond markets leading the declines in speculator bets this week were the Eurodollar (-375,415 contracts) and the 5-Year Bond (-36,670 contracts) with the Fed Funds (-15,131 contracts), the Ultra US Bond (-9,640 contracts) and the Ultra 10-Year (-4,597 contracts) also having lower bets on the week.
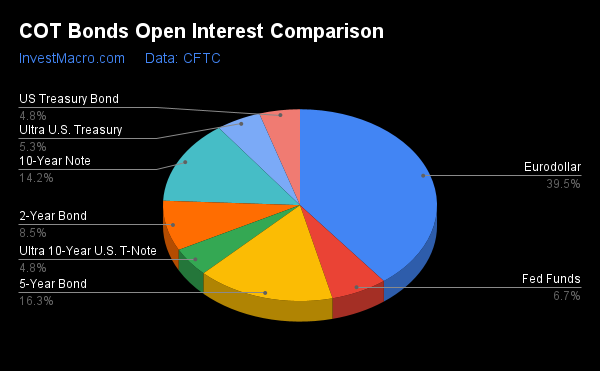
The Eurodollar represents the largest futures market with open interest (contracts open in the market currently) near 10 million contracts each week and the weekly changes dwarf most other markets. Overall, the bonds category represents around sixty percent of the contracts outstanding in the futures markets we cover and currently five bond markets reside in the top six of open interest.

Data Snapshot of Bond Market Traders | Columns Legend
| Eurodollar | 9,649,037 | 16 | -2,724,566 | 3 | 3,025,607 | 95 | -301,041 | 38 |
| 5-Year | 3,968,034 | 50 | -291,123 | 32 | 418,734 | 64 | -127,611 | 46 |
| 10-Year | 3,459,761 | 27 | -108,371 | 56 | 221,849 | 48 | -113,478 | 53 |
| 2-Year | 2,064,383 | 12 | -64,569 | 69 | 166,752 | 56 | -102,183 | 6 |
| FedFunds | 1,627,114 | 49 | 81,055 | 50 | -72,132 | 51 | -8,923 | 37 |
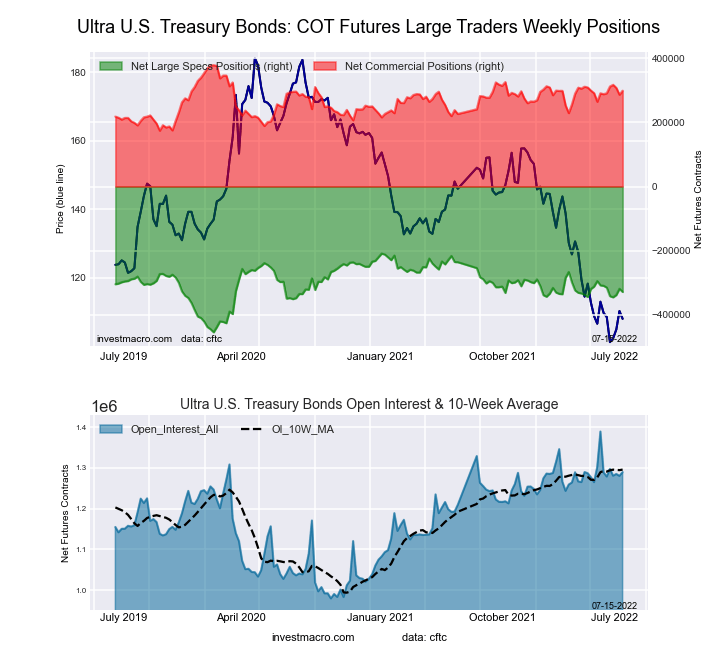
| Long T-Bond | 1,174,643 | 43 | -23,218 | 77 | 8,304 | 14 | 14,914 | 64 |
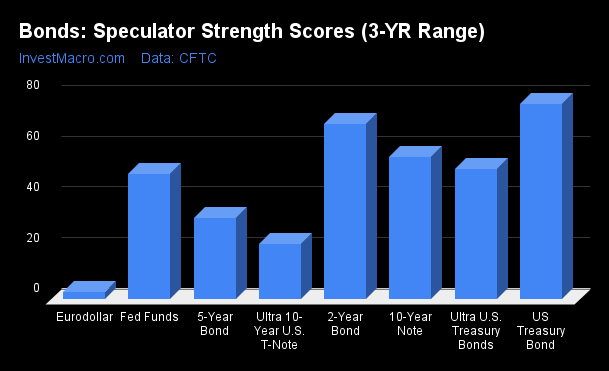
Strength Scores
Strength Scores (a normalized measure of Speculator positions over a 3-Year range, from 0 to 100 where above 80 is extreme bullish and below 20 is extreme bearish) show that the US Treasury Bond (77.0 percent) and the 2-Year Bond (69.2 percent) lead the bonds markets currently and have both risen since last week. The 10-Year Bond (56.0 percent) comes in as the next highest bonds market in strength scores and has risen almost 10 percent for the week. On the downside, the Eurodollar (2.8 percent) comes in at the lowest strength level currently and is the only extreme score this week (bearish). The Ultra 10-Year Bond (21.7 percent) and the 5-Year Bond (32.1 percent) follow as the next weakest strength scores.
Strength Statistics:
Fed Funds (49.6 percent) vs Fed Funds previous week (51.5 percent)
2-Year Bond (69.2 percent) vs 2-Year Bond previous week (64.7 percent)
5-Year Bond (32.1 percent) vs 5-Year Bond previous week (38.6 percent)
10-Year Bond (56.0 percent) vs 10-Year Bond previous week (46.5 percent)
Ultra 10-Year Bond (21.7 percent) vs Ultra 10-Year Bond previous week (22.9 percent)
US Treasury Bond (77.0 percent) vs US Treasury Bond previous week (75.6 percent)
Ultra US Treasury Bond (51.3 percent) vs Ultra US Treasury Bond previous week (55.2 percent)
Eurodollar (2.8 percent) vs Eurodollar previous week (9.7 percent)
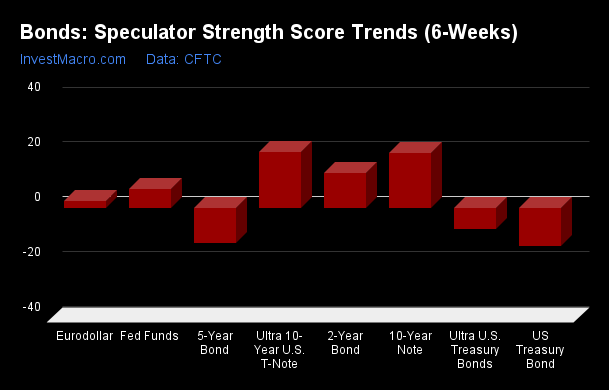
Strength Trends
Strength Score Trends (or move index, calculates the 6-week changes in strength scores) show that the Ultra 10-Year Bond leads the past six weeks trends for bonds this week with a 20.3 percent gain. The 10-Year Bond (19.8 percent) and the 2-Year Bond (12.8 percent) round out the next top movers in the latest trends data. The US Treasury Bond (-14.0 percent) leads the downside trend scores currently while the next markets with lower trend scores were the 5-Year Bond (-12.9 percent) followed by the Ultra US Treasury Bond (-7.8 percent).
Strength Trend Statistics:
Fed Funds (6.9 percent) vs Fed Funds previous week (6.6 percent)
2-Year Bond (12.8 percent) vs 2-Year Bond previous week (-10.5 percent)
5-Year Bond (-12.9 percent) vs 5-Year Bond previous week (-23.5 percent)
10-Year Bond (19.8 percent) vs 10-Year Bond previous week (8.3 percent)
Ultra 10-Year Bond (20.3 percent) vs Ultra 10-Year Bond previous week (19.8 percent)
US Treasury Bond (-14.0 percent) vs US Treasury Bond previous week (-18.3 percent)
Ultra US Treasury Bond (-7.8 percent) vs Ultra US Treasury Bond previous week (-4.4 percent)
Eurodollar (2.4 percent) vs Eurodollar (8.9 percent)
Individual Markets:
3-Month Eurodollars Futures:

The 3-Month Eurodollars large speculator standing this week totaled a net position of -2,724,566 contracts in the data reported through Tuesday. This was a weekly decrease of -375,415 contracts from the previous week which had a total of -2,349,151 net contracts.
This week’s current strength score (the trader positioning range over the past three years, measured from 0 to 100) shows the speculators are currently Bearish-Extreme with a score of 2.8 percent. The commercials are Bullish-Extreme with a score of 95.1 percent and the small traders (not shown in chart) are Bearish with a score of 38.2 percent.
| 3-Month Eurodollars Statistics | SPECULATORS | COMMERCIALS | SMALL TRADERS |
| – Percent of Open Interest Longs: | 4.7 | 72.4 | 4.3 |
| – Percent of Open Interest Shorts: | 33.0 | 41.1 | 7.4 |
| – Net Position: | -2,724,566 | 3,025,607 | -301,041 |
| – Gross Longs: | 456,666 | 6,989,571 | 415,361 |
| – Gross Shorts: | 3,181,232 | 3,963,964 | 716,402 |
| – Long to Short Ratio: | 0.1 to 1 | 1.8 to 1 | 0.6 to 1 |
| NET POSITION TREND: | |||
| – Strength Index Score (3 Year Range Pct): | 2.8 | 95.1 | 38.2 |
| – Strength Index Reading (3 Year Range): | Bearish-Extreme | Bullish-Extreme | Bearish |
| NET POSITION MOVEMENT INDEX: | |||
| – 6-Week Change in Strength Index: | 2.4 | -4.2 | 23.0 |
30-Day Federal Funds Futures:
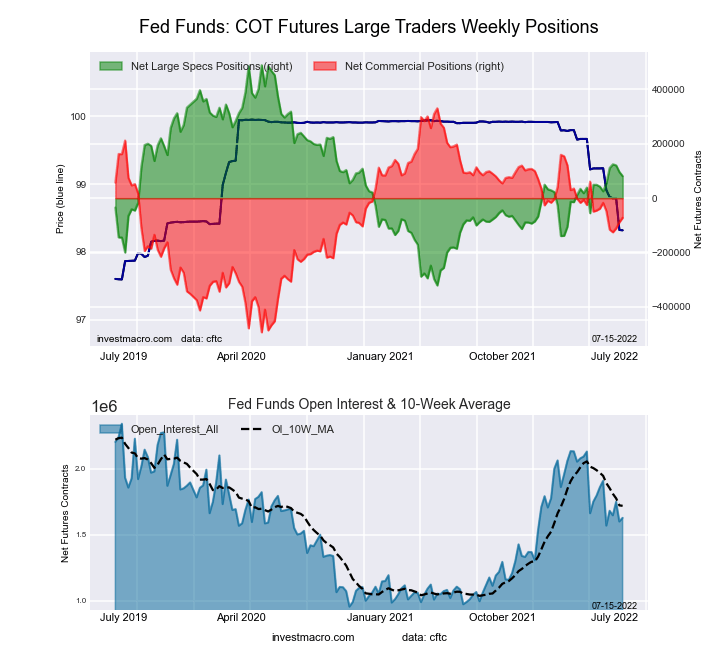
The 30-Day Federal Funds large speculator standing this week totaled a net position of 81,055 contracts in the data reported through Tuesday. This was a weekly fall of -15,131 contracts from the previous week which had a total of 96,186 net contracts.
This week’s current strength score (the trader positioning range over the past three years, measured from 0 to 100) shows the speculators are currently Bearish with a score of 49.6 percent. The commercials are Bullish with a score of 51.1 percent and the small traders (not shown in chart) are Bearish with a score of 37.0 percent.
| 30-Day Federal Funds Statistics | SPECULATORS | COMMERCIALS | SMALL TRADERS |
| – Percent of Open Interest Longs: | 11.7 | 72.9 | 2.3 |
| – Percent of Open Interest Shorts: | 6.7 | 77.3 | 2.8 |
| – Net Position: | 81,055 | -72,132 | -8,923 |
| – Gross Longs: | 189,815 | 1,186,007 | 37,102 |
| – Gross Shorts: | 108,760 | 1,258,139 | 46,025 |
| – Long to Short Ratio: | 1.7 to 1 | 0.9 to 1 | 0.8 to 1 |
| NET POSITION TREND: | |||
| – Strength Index Score (3 Year Range Pct): | 49.6 | 51.1 | 37.0 |
| – Strength Index Reading (3 Year Range): | Bearish | Bullish | Bearish |
| NET POSITION MOVEMENT INDEX: | |||
| – 6-Week Change in Strength Index: | 6.9 | -6.7 | -2.6 |
2-Year Treasury Note Futures:
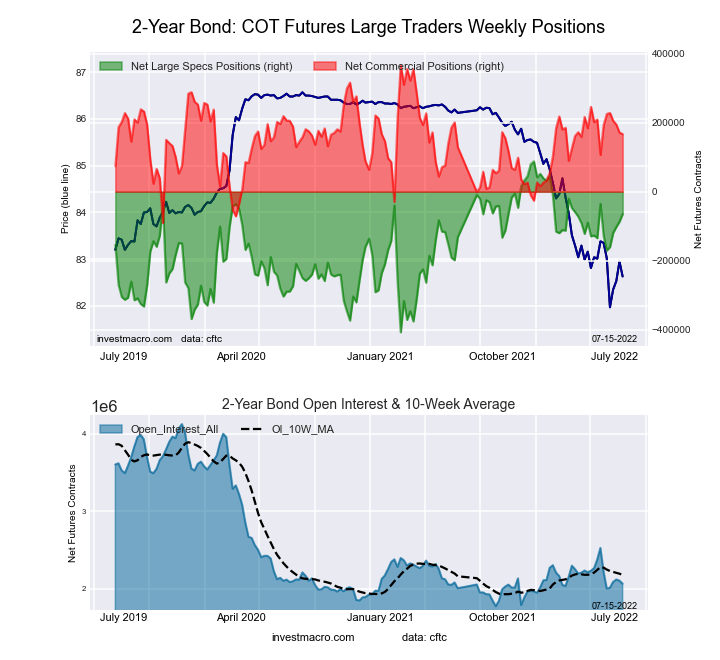
The 2-Year Treasury Note large speculator standing this week totaled a net position of -64,569 contracts in the data reported through Tuesday. This was a weekly boost of 22,473 contracts from the previous week which had a total of -87,042 net contracts.
This week’s current strength score (the trader positioning range over the past three years, measured from 0 to 100) shows the speculators are currently Bullish with a score of 69.2 percent. The commercials are Bullish with a score of 56.3 percent and the small traders (not shown in chart) are Bearish-Extreme with a score of 6.0 percent.
| 2-Year Treasury Note Statistics | SPECULATORS | COMMERCIALS | SMALL TRADERS |
| – Percent of Open Interest Longs: | 13.5 | 78.0 | 6.5 |
| – Percent of Open Interest Shorts: | 16.6 | 69.9 | 11.4 |
| – Net Position: | -64,569 | 166,752 | -102,183 |
| – Gross Longs: | 278,448 | 1,610,060 | 133,635 |
| – Gross Shorts: | 343,017 | 1,443,308 | 235,818 |
| – Long to Short Ratio: | 0.8 to 1 | 1.1 to 1 | 0.6 to 1 |
| NET POSITION TREND: | |||
| – Strength Index Score (3 Year Range Pct): | 69.2 | 56.3 | 6.0 |
| – Strength Index Reading (3 Year Range): | Bullish | Bullish | Bearish-Extreme |
| NET POSITION MOVEMENT INDEX: | |||
| – 6-Week Change in Strength Index: | 12.8 | -5.8 | -15.5 |
5-Year Treasury Note Futures:
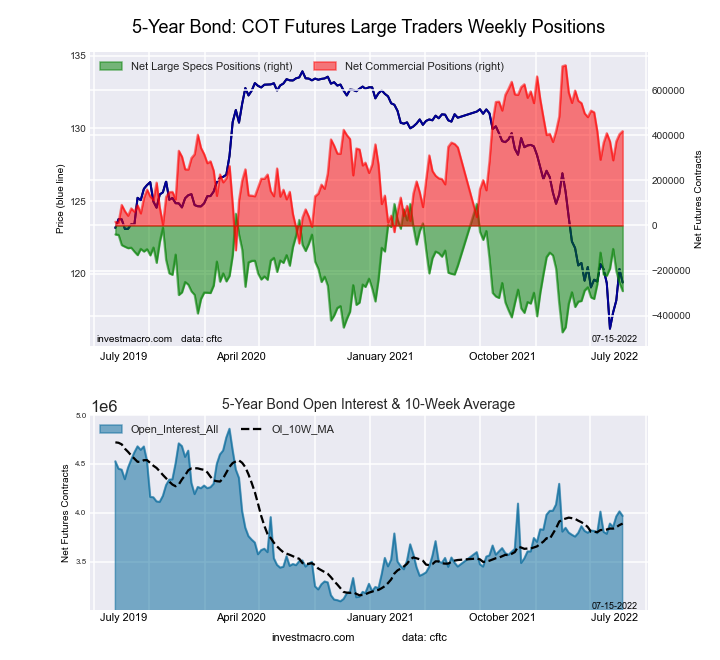
The 5-Year Treasury Note large speculator standing this week totaled a net position of -291,123 contracts in the data reported through Tuesday. This was a weekly reduction of -36,670 contracts from the previous week which had a total of -254,453 net contracts.
This week’s current strength score (the trader positioning range over the past three years, measured from 0 to 100) shows the speculators are currently Bearish with a score of 32.1 percent. The commercials are Bullish with a score of 64.4 percent and the small traders (not shown in chart) are Bearish with a score of 45.9 percent.
| 5-Year Treasury Note Statistics | SPECULATORS | COMMERCIALS | SMALL TRADERS |
| – Percent of Open Interest Longs: | 6.9 | 84.2 | 7.6 |
| – Percent of Open Interest Shorts: | 14.3 | 73.6 | 10.8 |
| – Net Position: | -291,123 | 418,734 | -127,611 |
| – Gross Longs: | 274,551 | 3,340,256 | 301,482 |
| – Gross Shorts: | 565,674 | 2,921,522 | 429,093 |
| – Long to Short Ratio: | 0.5 to 1 | 1.1 to 1 | 0.7 to 1 |
| NET POSITION TREND: | |||
| – Strength Index Score (3 Year Range Pct): | 32.1 | 64.4 | 45.9 |
| – Strength Index Reading (3 Year Range): | Bearish | Bullish | Bearish |
| NET POSITION MOVEMENT INDEX: | |||
| – 6-Week Change in Strength Index: | -12.9 | 6.3 | 6.0 |
10-Year Treasury Note Futures:
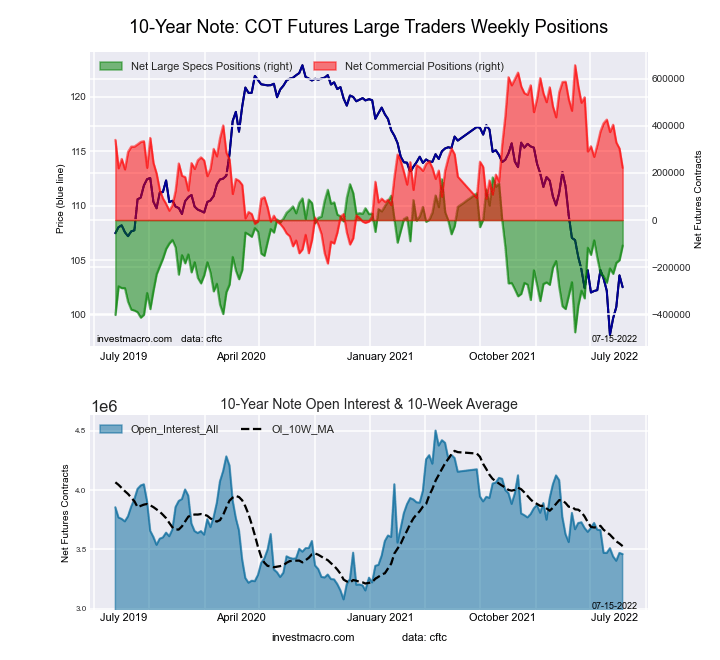
The 10-Year Treasury Note large speculator standing this week totaled a net position of -108,371 contracts in the data reported through Tuesday. This was a weekly increase of 62,129 contracts from the previous week which had a total of -170,500 net contracts.
This week’s current strength score (the trader positioning range over the past three years, measured from 0 to 100) shows the speculators are currently Bullish with a score of 56.0 percent. The commercials are Bearish with a score of 48.2 percent and the small traders (not shown in chart) are Bullish with a score of 52.7 percent.
| 10-Year Treasury Note Statistics | SPECULATORS | COMMERCIALS | SMALL TRADERS |
| – Percent of Open Interest Longs: | 10.4 | 77.6 | 9.3 |
| – Percent of Open Interest Shorts: | 13.5 | 71.2 | 12.5 |
| – Net Position: | -108,371 | 221,849 | -113,478 |
| – Gross Longs: | 360,163 | 2,686,457 | 320,087 |
| – Gross Shorts: | 468,534 | 2,464,608 | 433,565 |
| – Long to Short Ratio: | 0.8 to 1 | 1.1 to 1 | 0.7 to 1 |
| NET POSITION TREND: | |||
| – Strength Index Score (3 Year Range Pct): | 56.0 | 48.2 | 52.7 |
| – Strength Index Reading (3 Year Range): | Bullish | Bearish | Bullish |
| NET POSITION MOVEMENT INDEX: | |||
| – 6-Week Change in Strength Index: | 19.8 | -22.5 | 13.8 |
Ultra 10-Year Notes Futures:

The Ultra 10-Year Notes large speculator standing this week totaled a net position of -27,339 contracts in the data reported through Tuesday. This was a weekly decrease of -4,597 contracts from the previous week which had a total of -22,742 net contracts.
This week’s current strength score (the trader positioning range over the past three years, measured from 0 to 100) shows the speculators are currently Bearish with a score of 21.7 percent. The commercials are Bullish with a score of 74.1 percent and the small traders (not shown in chart) are Bullish with a score of 57.2 percent.
| Ultra 10-Year Notes Statistics | SPECULATORS | COMMERCIALS | SMALL TRADERS |
| – Percent of Open Interest Longs: | 5.1 | 82.2 | 12.0 |
| – Percent of Open Interest Shorts: | 7.4 | 71.1 | 20.8 |
| – Net Position: | -27,339 | 131,498 | -104,159 |
| – Gross Longs: | 60,265 | 973,110 | 141,625 |
| – Gross Shorts: | 87,604 | 841,612 | 245,784 |
| – Long to Short Ratio: | 0.7 to 1 | 1.2 to 1 | 0.6 to 1 |
| NET POSITION TREND: | |||
| – Strength Index Score (3 Year Range Pct): | 21.7 | 74.1 | 57.2 |
| – Strength Index Reading (3 Year Range): | Bearish | Bullish | Bullish |
| NET POSITION MOVEMENT INDEX: | |||
| – 6-Week Change in Strength Index: | 20.3 | -20.2 | 0.7 |
US Treasury Bonds Futures:
 The US Treasury Bonds large speculator standing this week totaled a net position of -23,218 contracts in the data reported through Tuesday. This was a weekly lift of 4,455 contracts from the previous week which had a total of -27,673 net contracts.
This week’s current strength score (the trader positioning range over the past three years, measured from 0 to 100) shows the speculators are currently Bullish with a score of 77.0 percent. The commercials are Bearish-Extreme with a score of 13.6 percent and the small traders (not shown in chart) are Bullish with a score of 64.4 percent.
| US Treasury Bonds Statistics | SPECULATORS | COMMERCIALS | SMALL TRADERS |
| – Percent of Open Interest Longs: | 8.3 | 77.2 | 14.0 |
| – Percent of Open Interest Shorts: | 10.3 | 76.5 | 12.7 |
| – Net Position: | -23,218 | 8,304 | 14,914 |
| – Gross Longs: | 97,335 | 907,260 | 163,928 |
| – Gross Shorts: | 120,553 | 898,956 | 149,014 |
| – Long to Short Ratio: | 0.8 to 1 | 1.0 to 1 | 1.1 to 1 |
| NET POSITION TREND: | |||
| – Strength Index Score (3 Year Range Pct): | 77.0 | 13.6 | 64.4 |
| – Strength Index Reading (3 Year Range): | Bullish | Bearish-Extreme | Bullish |
| NET POSITION MOVEMENT INDEX: | |||
| – 6-Week Change in Strength Index: | -14.0 | 2.4 | 28.8 |
Ultra US Treasury Bonds Futures:
The Ultra US Treasury Bonds large speculator standing this week totaled a net position of -328,295 contracts in the data reported through Tuesday. This was a weekly fall of -9,640 contracts from the previous week which had a total of -318,655 net contracts.
This week’s current strength score (the trader positioning range over the past three years, measured from 0 to 100) shows the speculators are currently Bullish with a score of 51.3 percent. The commercials are Bullish with a score of 61.0 percent and the small traders (not shown in chart) are Bearish with a score of 49.7 percent.
| Ultra US Treasury Bonds Statistics | SPECULATORS | COMMERCIALS | SMALL TRADERS |
| – Percent of Open Interest Longs: | 4.1 | 84.3 | 11.4 |
| – Percent of Open Interest Shorts: | 29.5 | 61.2 | 9.1 |
| – Net Position: | -328,295 | 298,402 | 29,893 |
| – Gross Longs: | 52,766 | 1,087,219 | 146,988 |
| – Gross Shorts: | 381,061 | 788,817 | 117,095 |
| – Long to Short Ratio: | 0.1 to 1 | 1.4 to 1 | 1.3 to 1 |
| NET POSITION TREND: | |||
| – Strength Index Score (3 Year Range Pct): | 51.3 | 61.0 | 49.7 |
| – Strength Index Reading (3 Year Range): | Bullish | Bullish | Bearish |
| NET POSITION MOVEMENT INDEX: | |||
| – 6-Week Change in Strength Index: | -7.8 | 5.3 | 5.9 |
*COT Report: The COT data, released weekly to the public each Friday, is updated through the most recent Tuesday (data is 3 days old) and shows a quick view of how large speculators or non-commercials (for-profit traders) were positioned in the futures markets.
The CFTC categorizes trader positions according to commercial hedgers (traders who use futures contracts for hedging as part of the business), non-commercials (large traders who speculate to realize trading profits) and nonreportable traders (usually small traders/speculators) as well as their open interest (contracts open in the market at time of reporting). See CFTC criteria here.
More By This Author:
COT Week 27 Charts: Soft Commodities Speculators Bets Go Lower Led By Corn, Sugar & Cocoa
COT Week 27 Charts: Bond Market Speculators Bets Higher Overall Led By Ultra US Bonds & 2-Year Bonds
COT Week 27 Charts: Energy Speculator Bets Drop Led By WTI Crude Oil & Gasoline


Comments
Log in or sign up to join the conversation.