
The Atlanta Fed’s nowcast for Q2 as of 7/15 was for -1.5% Q/Q SAAR. What does this tell us about what is likely to be the advance print, and then subsequent releases?
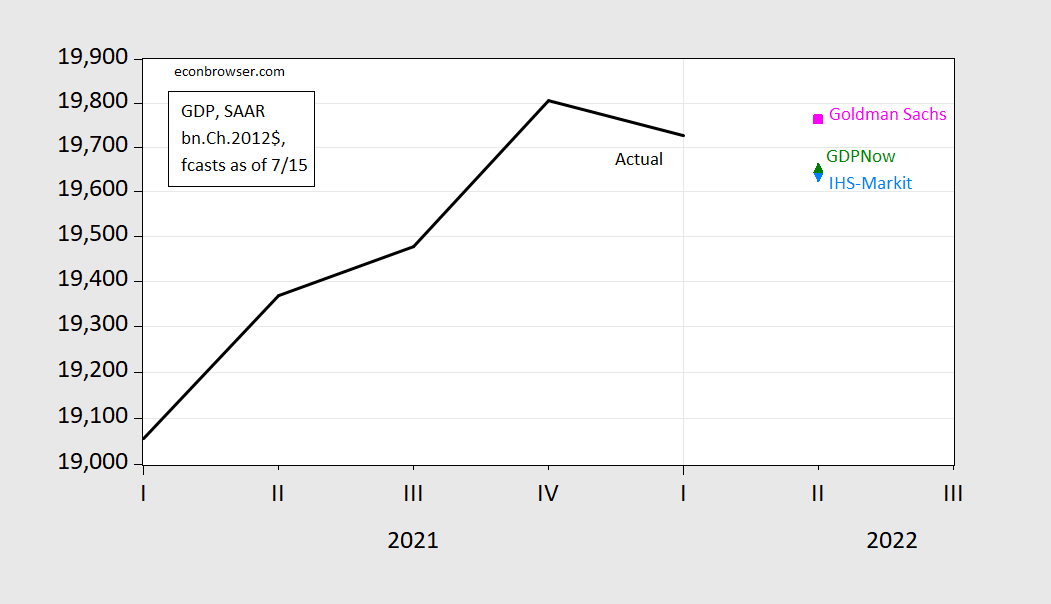
Figure 1: GDP (black), Goldman Sachs (pink square), Atlanta Fed GDPNow (green triangle), IHS-Markit (light blue triangle), in billions Ch.2012$, SAAR. Nowcasts as of 7/15/2022. Source: BEA and Goldman Sachs, Atlanta Fed and IHS-Markit, and author’s calculations.
What does this point estimate mean? From the Atlanta Fed FAQs:
Since we started tracking GDP growth with versions of this model in 2011, the average absolute error of final GDPNow forecasts is 0.84 percentage points. The root-mean-squared error of the forecasts is 1.25 percentage points. These accuracy measures cover initial estimates for 2011:Q3–2022:Q1. Some further analysis of GDPNow’s forecast errors is available in macroblog posts located here and here. We have made some improvements to the model from its earlier versions, and the model forecasts have become more accurate over time (the complete track record is here). When back-testing with revised data, the root mean-squared error of the model’s out-of sample forecast with the same data coverage that an analyst would have just before the “advance” estimate is 1.15 percentage points for the 2000:Q1–2013:Q4 period. The figure below shows how the forecasts become more accurate as the interval between the date the forecast is made and the forthcoming GDP release date narrows.
Overall, these accuracy metrics do not give compelling evidence that the model is more accurate than professional forecasters. The model does appear to fare well compared to other conventional statistical models.
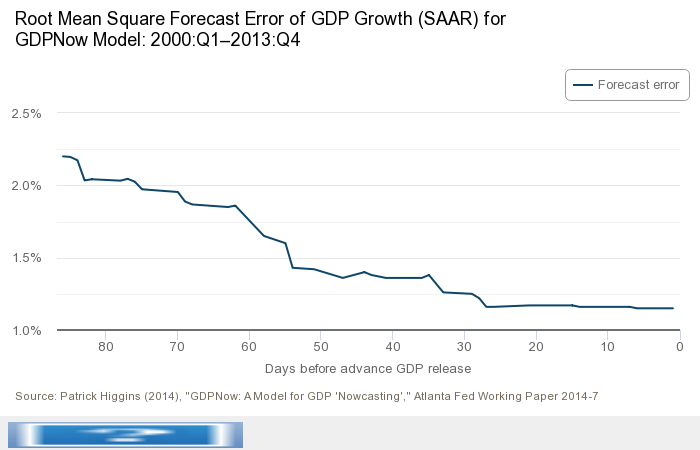
What does a 1.15 percentage point RMSE imply? Given that the RMSE does not decrease substantially from about 25 days to 1 day before announcement, I’ll use that number (we’re 13 days out from the July 28 release) to calculate the 90% interval for the GDPNow nowcast.
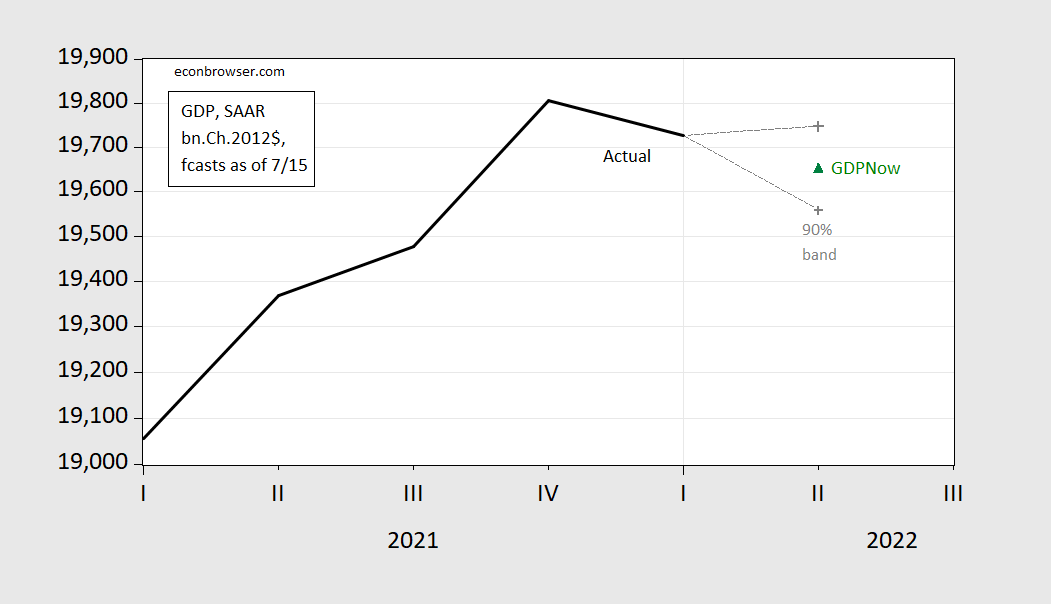
Figure 2: GDP (black), Atlanta Fed GDPNow (green triangle) and 90% interval (gray +), in billions Ch.2012$, SAAR. Nowcasts as of 7/15/2022. Source: BEA Atlanta Fed and IHS-Markit, and author’s calculations.
In other words, there is a possibility that GDPNow will record a positive growth figure for Q2 (or even a more negative one, as well).
One has to take this historical track record with a bit of caution, because the model has been revised a number of times. In addition, from the April 29th release, additional measures have been taken to account for complications to seasonal adjustment and dynamics associated with the sharp downturn in 2020 (see here).
More recently, the forecast errors over the past year have been -0.9 ppts, 1.8 ppts, 0.4 ppts, -1.8 ppts.
More By This Author:
Business Cycle Indicators, Mid-July
IMF Forecast For US GDP: No Recession
Nonresidential Fixed Investment and Prospects for GDP Outlook and Revisions


Comments
Log in or sign up to join the conversation.