

Image Source: Unsplash
Find out the exact price zone that has caught every S&P 500 dip over the past few weeks, and the 2-bar pattern that just trapped thousands of bearish traders — plus the critical level that, if violated, changes everything.
Watch the video from the WLGC session on 2 Feb 2026 to find out the following:
- The exact support zone between two specific price levels that must hold for the market to remain bullish.
- How to identify a classic “shakeout” pattern using just two candlesticks, so you never get trapped on the wrong side of a reversal again.
- The difference between “lack of aggressive demand” and “lack of supply” at resistance, and why this distinction determines if a breakout will succeed.
- And a lot more…
Video Length: 00:11:33
Market Environment
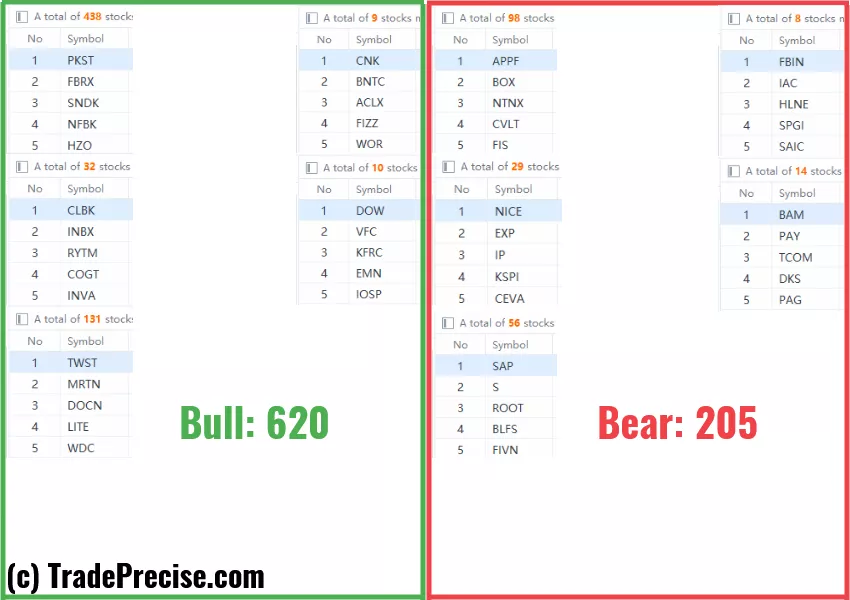
The bullish vs. bearish setup is 620 to 205 from the screenshot of my stock screener below.
(Click on image to enlarge)
Trade Setups
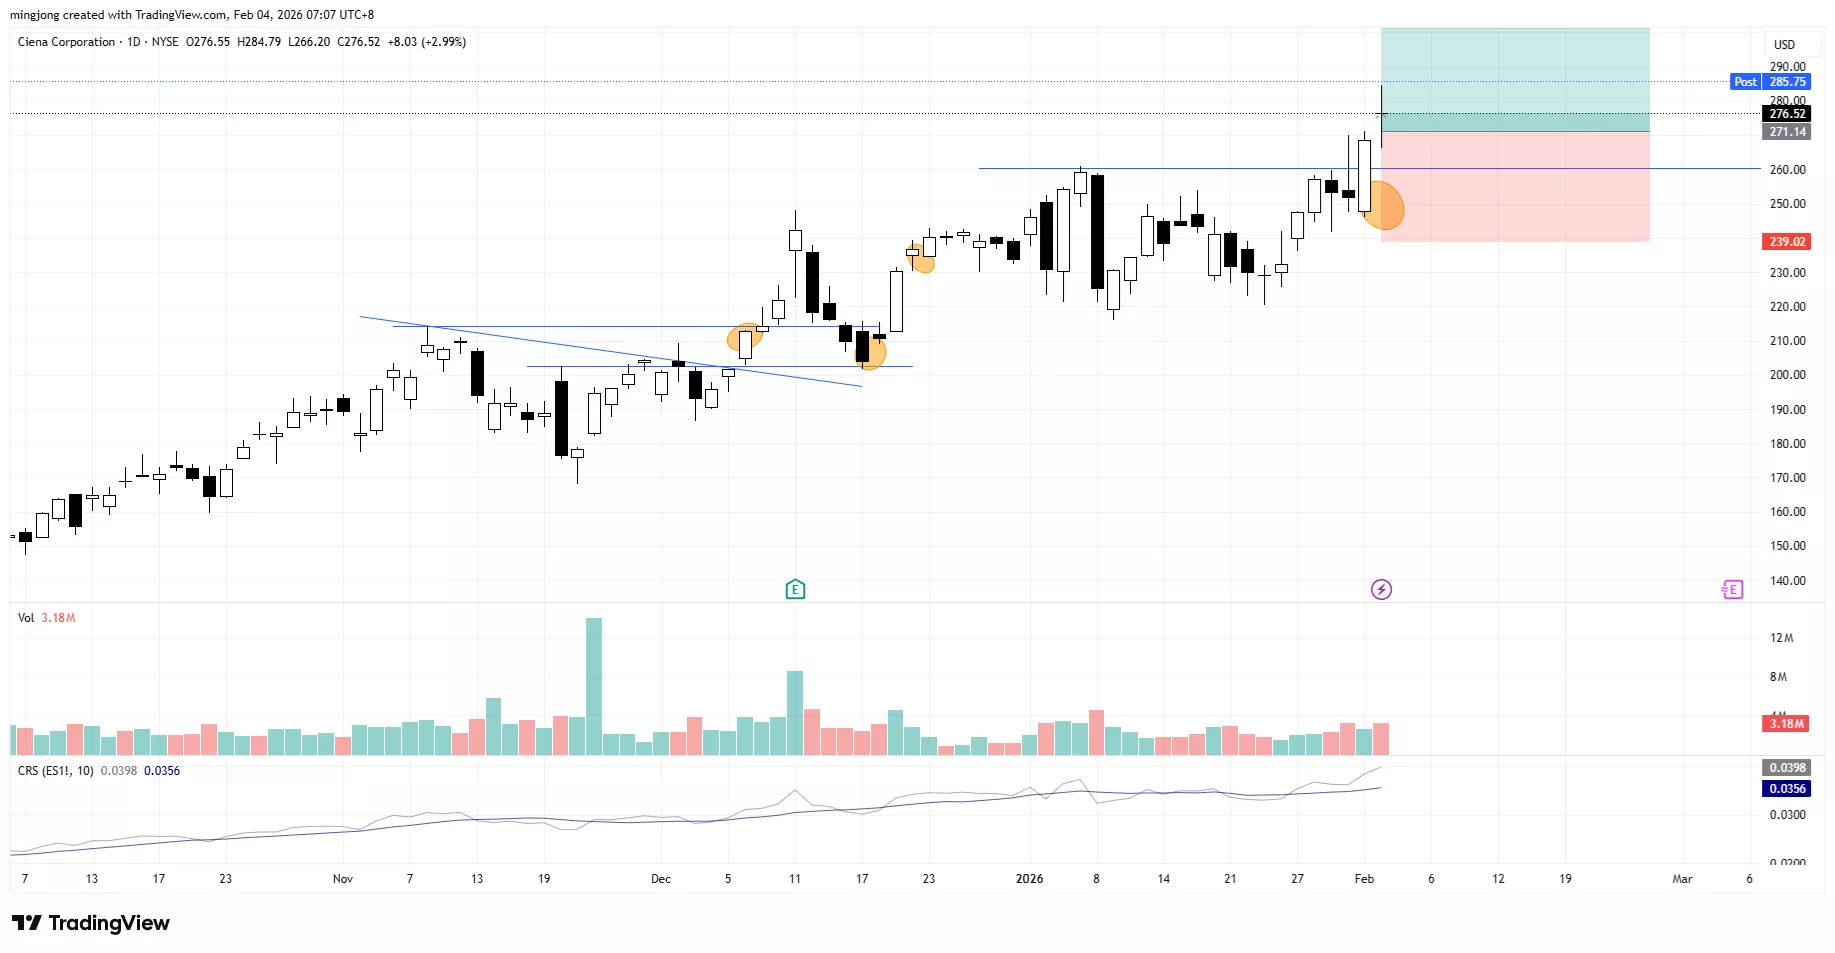
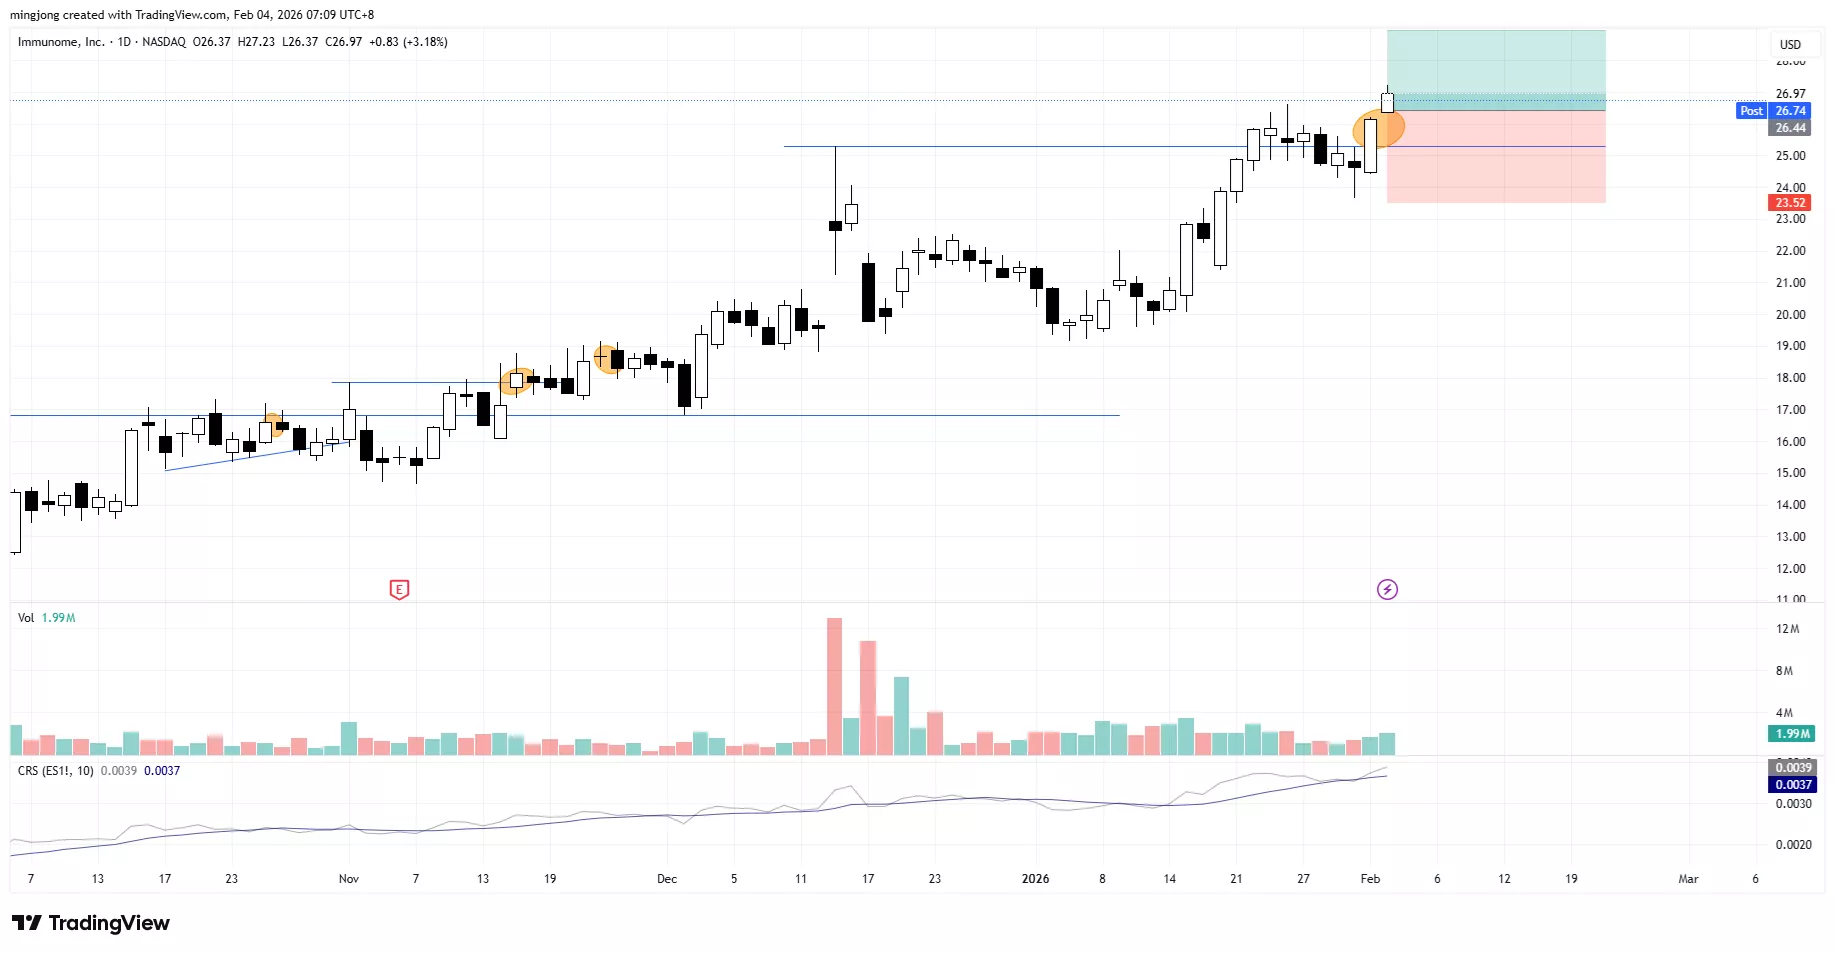
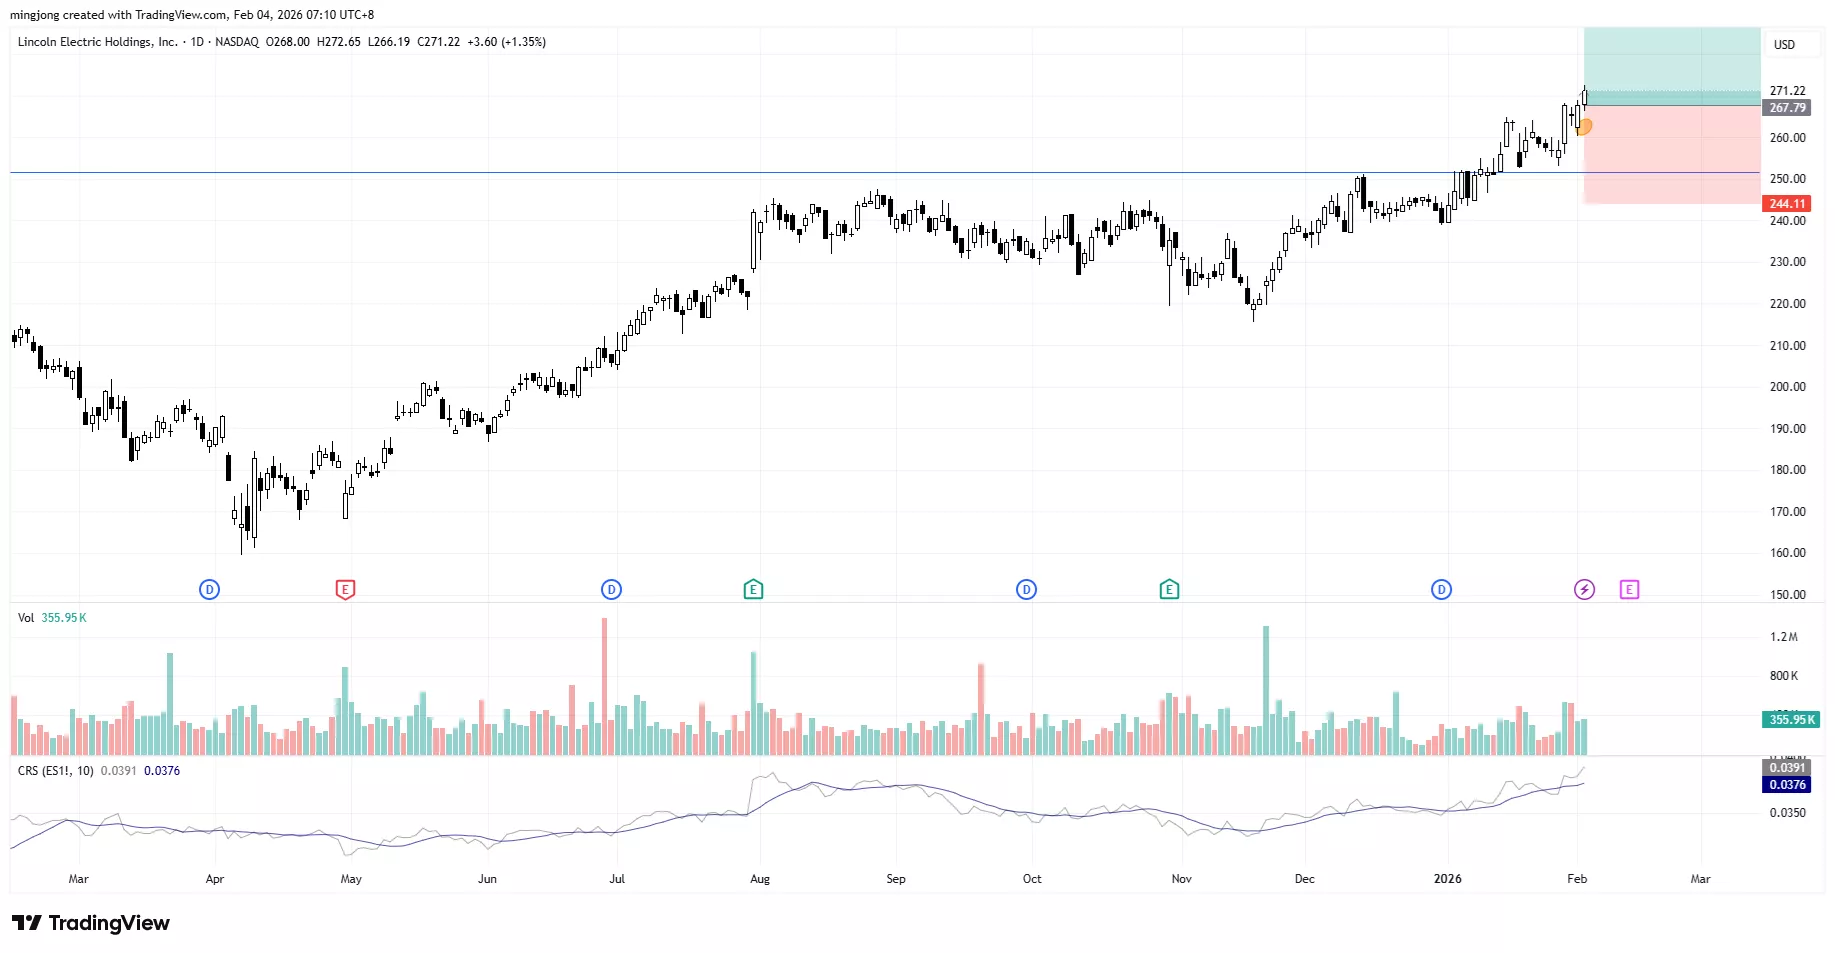
19 actionable setups such as CIEN, IMNM, LECO were discussed during the live session on 3 Feb 2026 before the market open (BMO).
(Click on image to enlarge)
(Click on image to enlarge)
(Click on image to enlarge)
More By This Author:
The S&P 500 "Spring Trap" That Fooled 90% Of Traders
S&P 500 Just Flashed This Rare Signal — Here's What Smart Traders Do Next
4 Years Of Accumulation Complete - This Index Is Where The Real Gains Are In 2026


Comments
Log in or sign up to join the conversation.