
S&P 500 Just Flashed This Rare Signal — Here's What Smart Traders Do Next

Image Source: Unsplash
Find out the exact S&P 500 price level that separates a healthy shakeout from a dangerous breakdown, and the one volume signal that tells you whether institutions are quietly accumulating or aggressively distributing — before the next move happens.
Watch the video from the WLGC session on Jan 20, 2026 to find out the following:
-
The exact price zone where institutional demand has shown up 4 times in a row.
-
The “spring” setup that Wyckoff traders use to catch reversals at the perfect moment — and the one confirmation signal you must wait for before entering
-
The volume characteristic that separates a healthy pullback from a dangerous distribution — and how today’s candle could change everything we thought about this rally.
-
And a lot more…
Video Length: 00:09:06
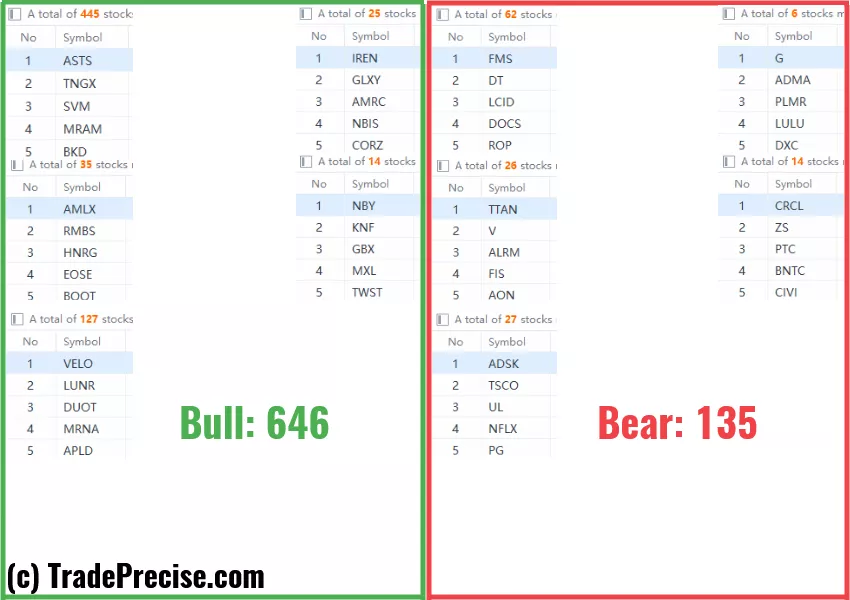
Market Environment
The bullish vs. bearish setup is 646 to 135 from the screenshot of my stock screener below.
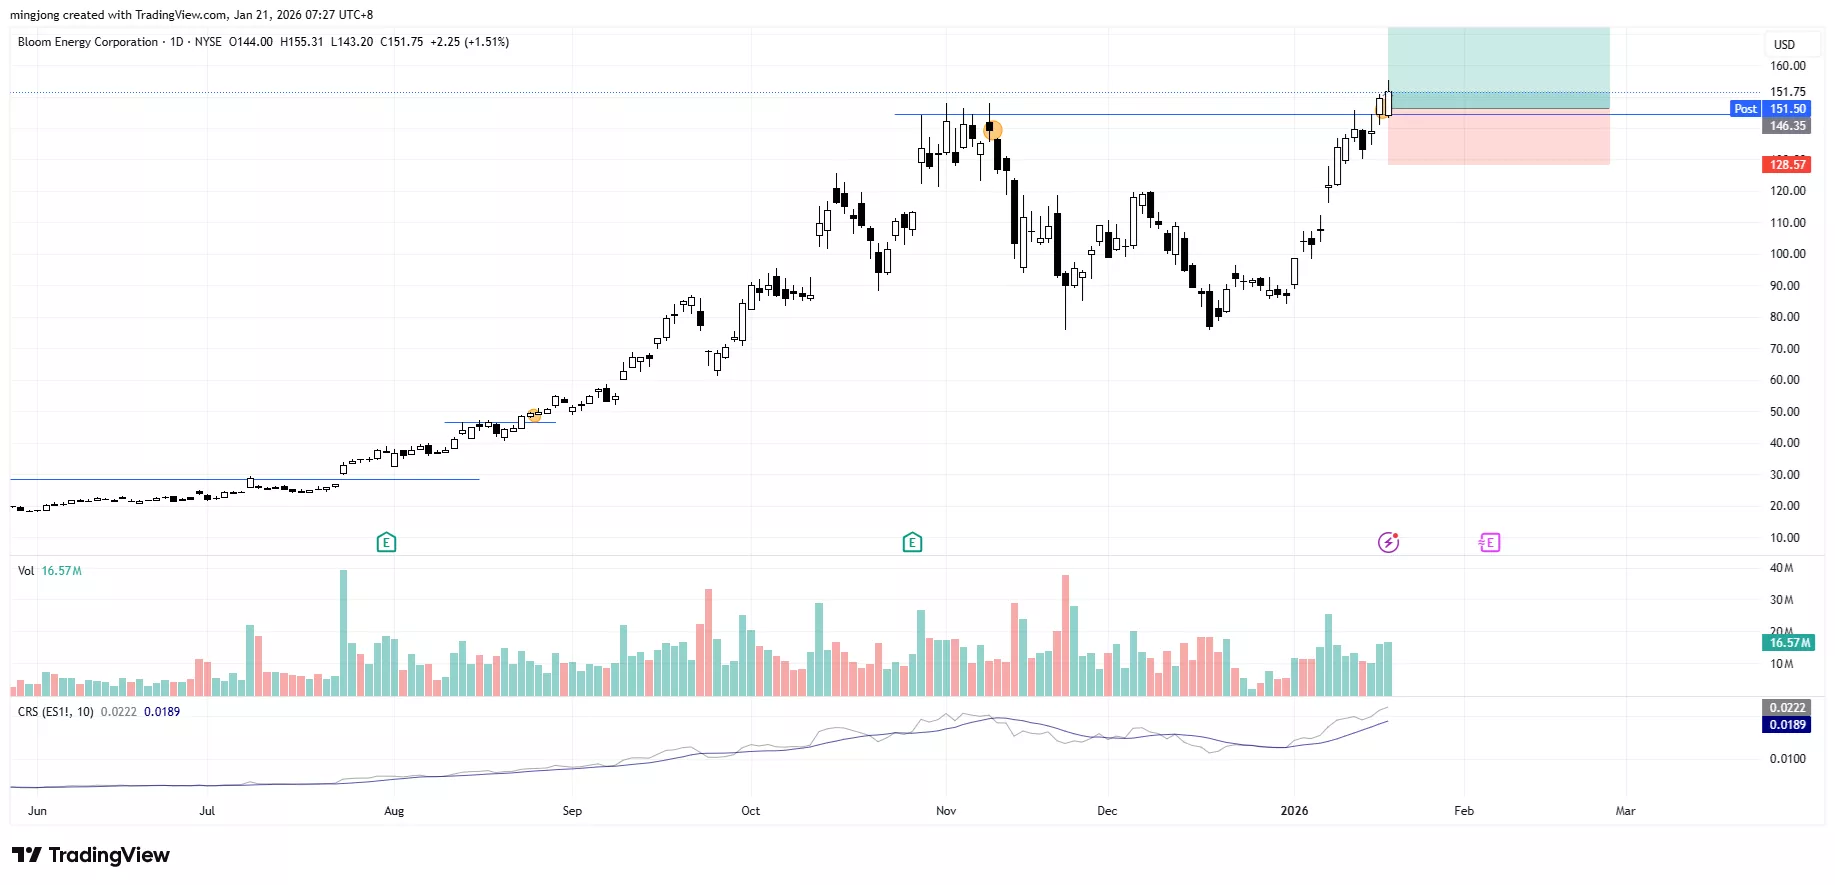
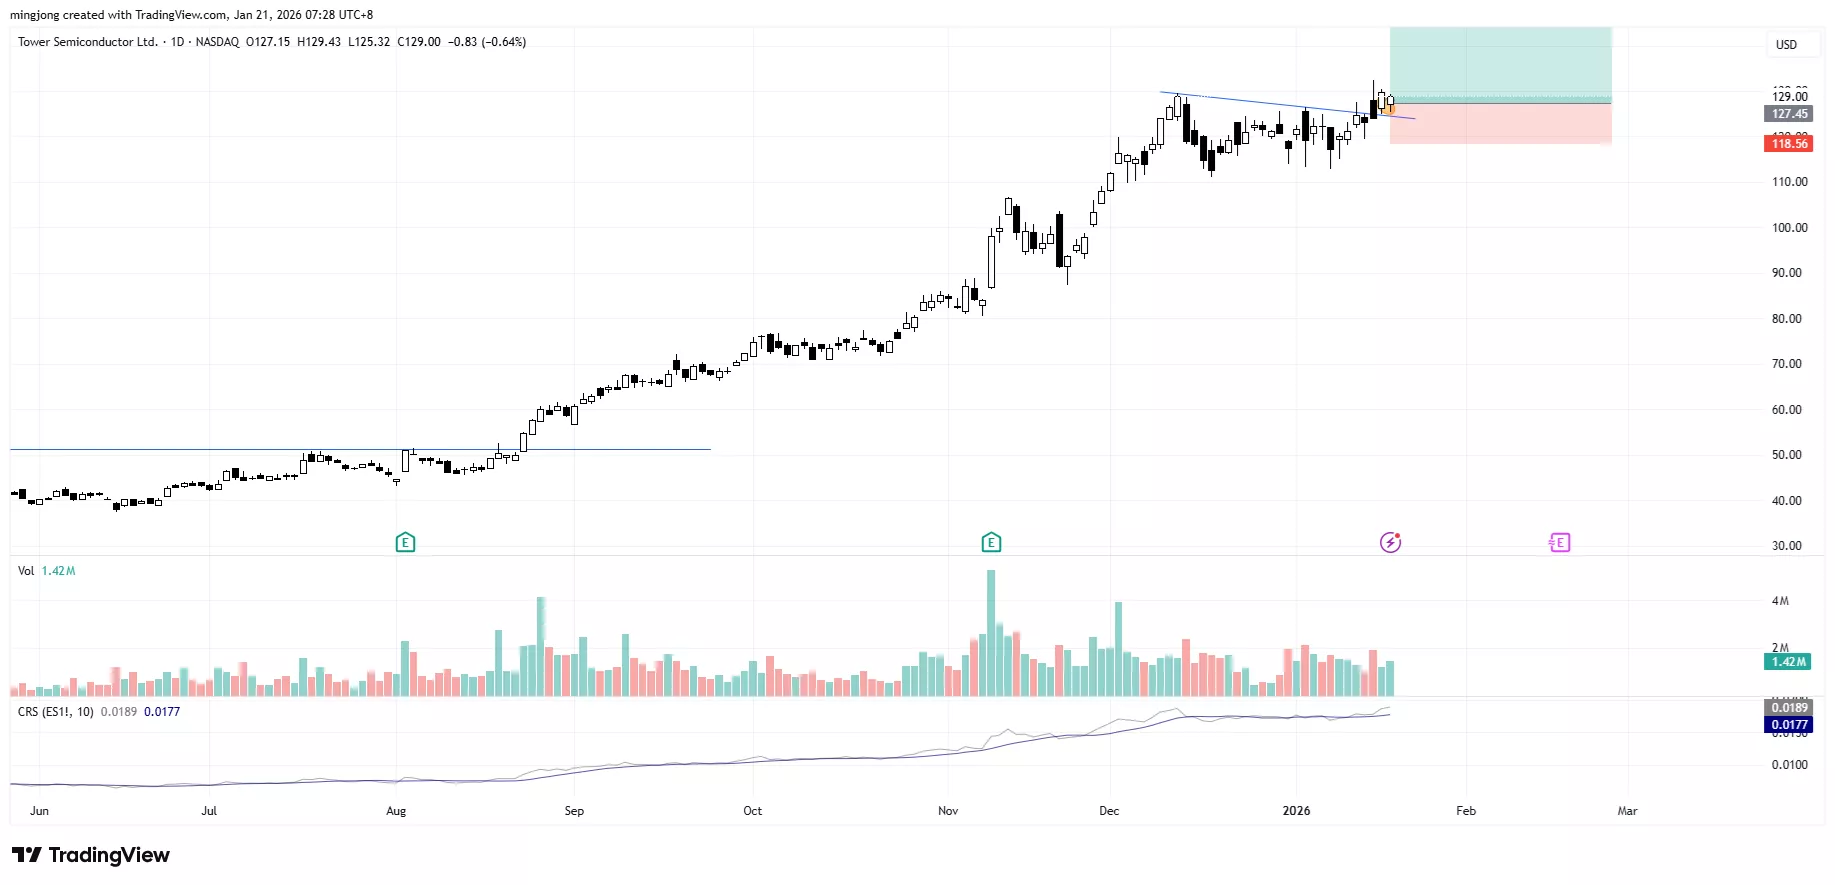
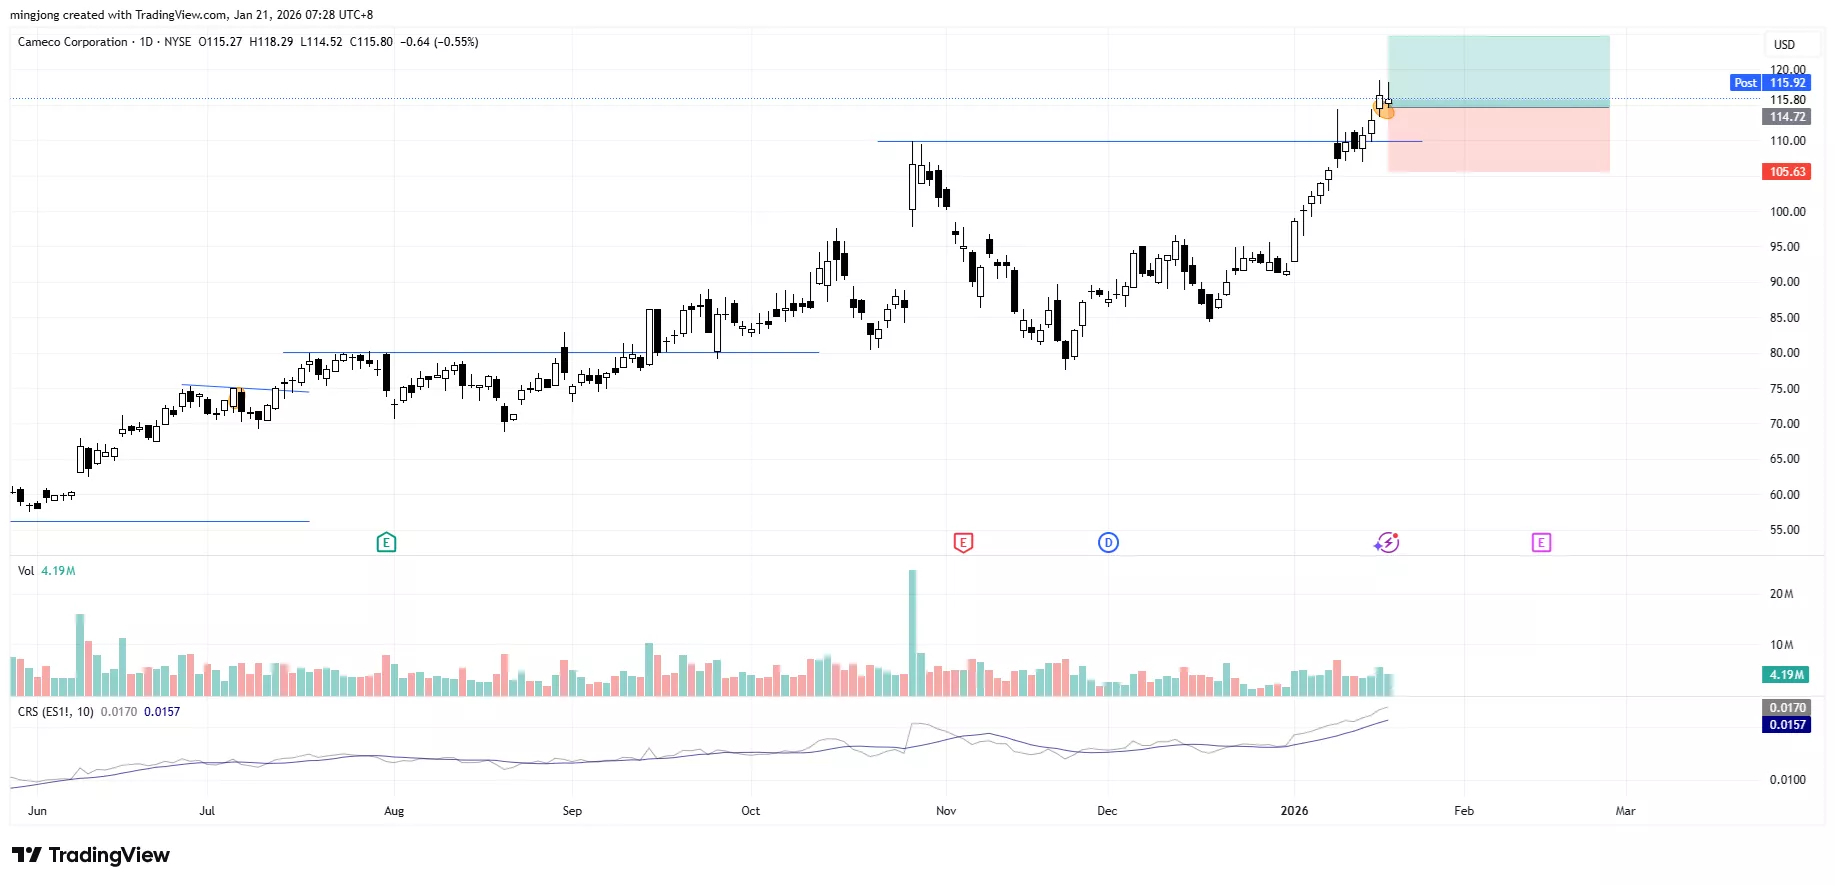
Trade Setups
21 actionable setups such as BE, CCJ, TSEM were discussed during the live session on Jan 20, 2026 before the market open (BMO).
More By This Author:
4 Years Of Accumulation Complete - This Index Is Where The Real Gains Are In 2026
The S&P 500 Flashes Early Breakout Signal As Buyers Defend Critical Zone
This Quiet S&P 500 Rally Is Sending A Clear Message (Most People Are Missing It)
Disclaimer: The information in this presentation is solely for educational purpose and should not be taken as investment advice.


