
4 Years Of Accumulation Complete - This Index Is Where The Real Gains Are In 2026

Photo by Austin Distel on Unsplash
After 4 years of choppy accumulation, the Russell 2000 is finally breaking out — here's the technical setup, key price targets, and why small and mid-cap stocks could outperform the S&P 500 and NASDAQ in 2026.
Watch the video from the WLGC session on 13 Jan 2026 to find out the following:
- The “4-segment secret” that reveals exactly when a breakout is about to happen — most traders miss this pattern entirely, but once you see it, you’ll never look at consolidation the same way again
- Why the “shallow pullback” everyone’s ignoring is actually the most bullish signal on the chart right now — and how to use it to time your entries before the crowd piles in
- The one index that’s been quietly building pressure for 4 years while everyone chased mega-caps — it just triggered a “spring” setup that historically precedes explosive rallies
Video Length: 00:10:10
Market Environment
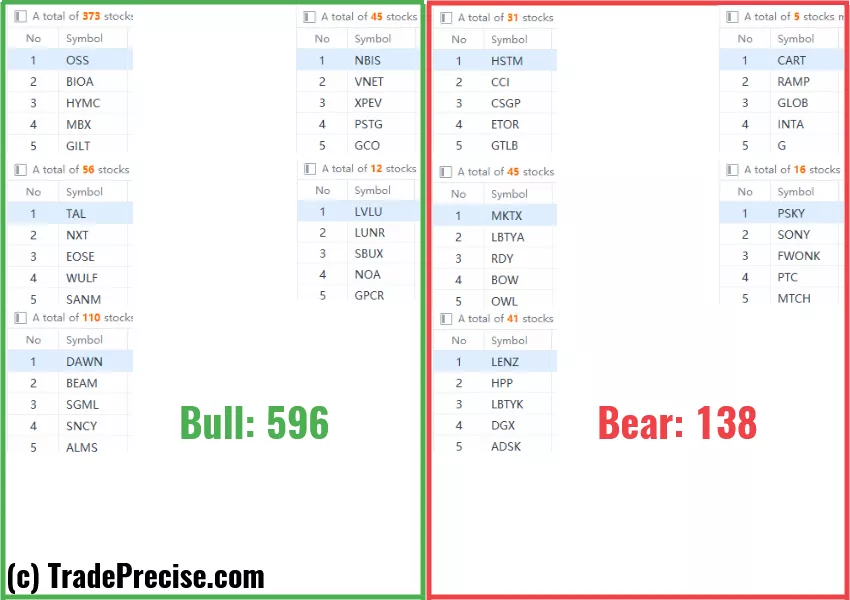
The bullish vs. bearish setup is 596 to 138 from the screenshot of my stock screener below.
(Click on image to enlarge)
Trade Setups
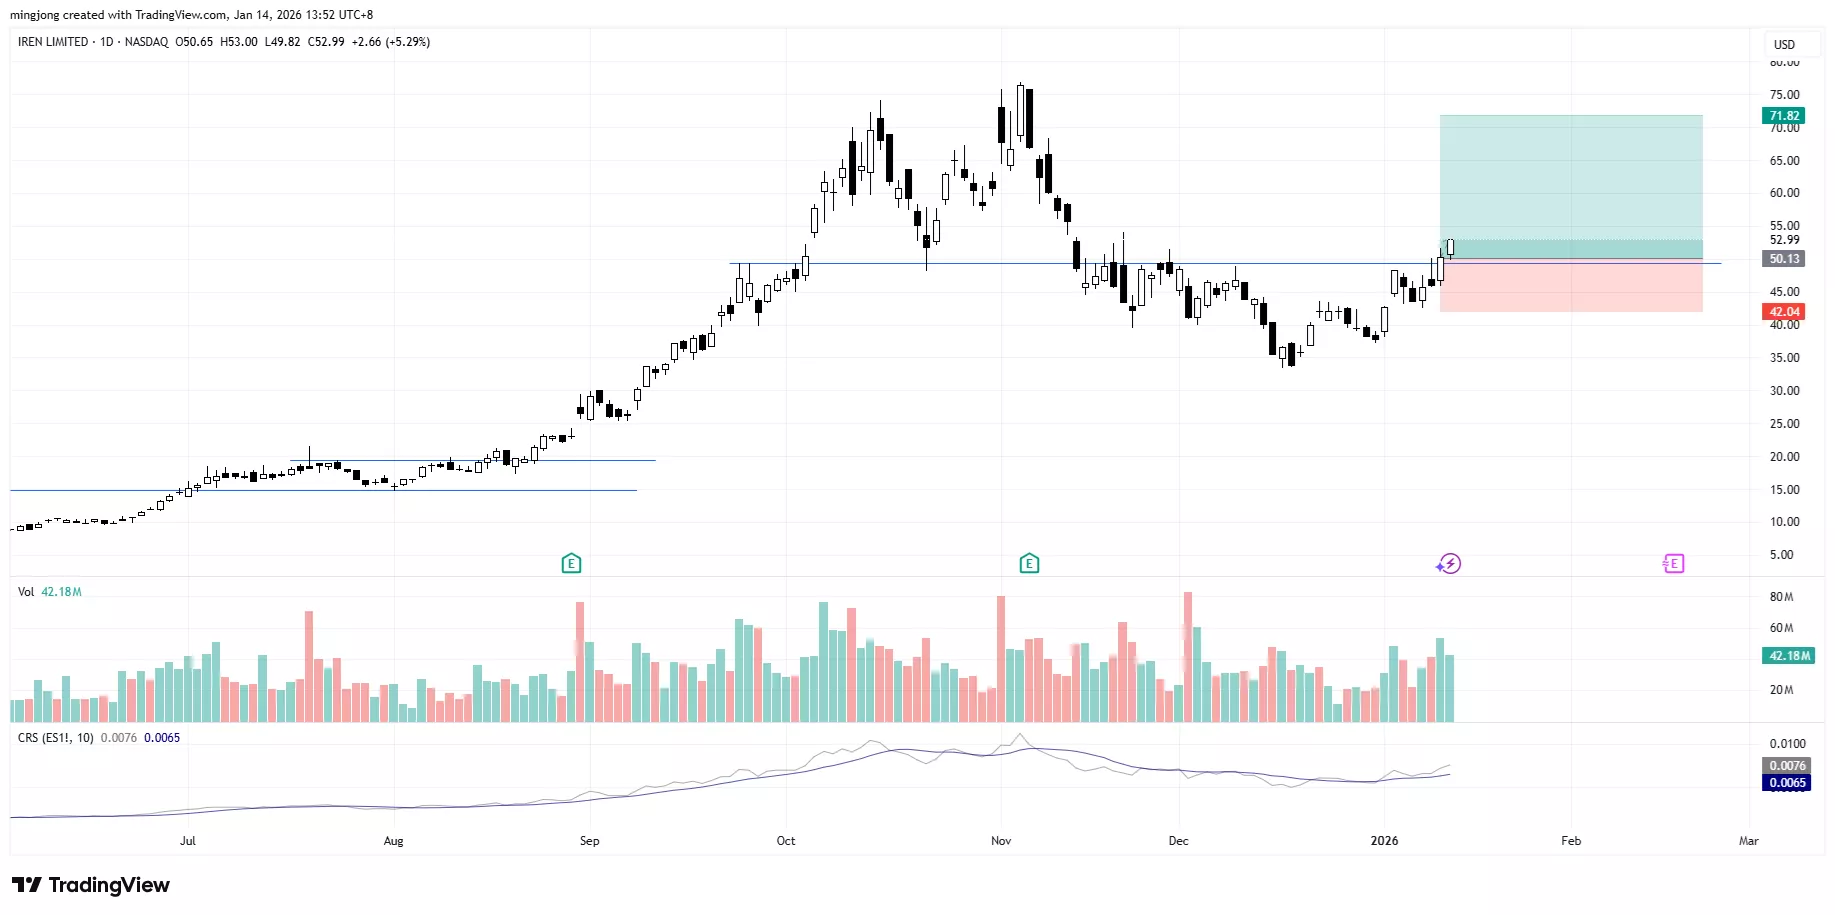
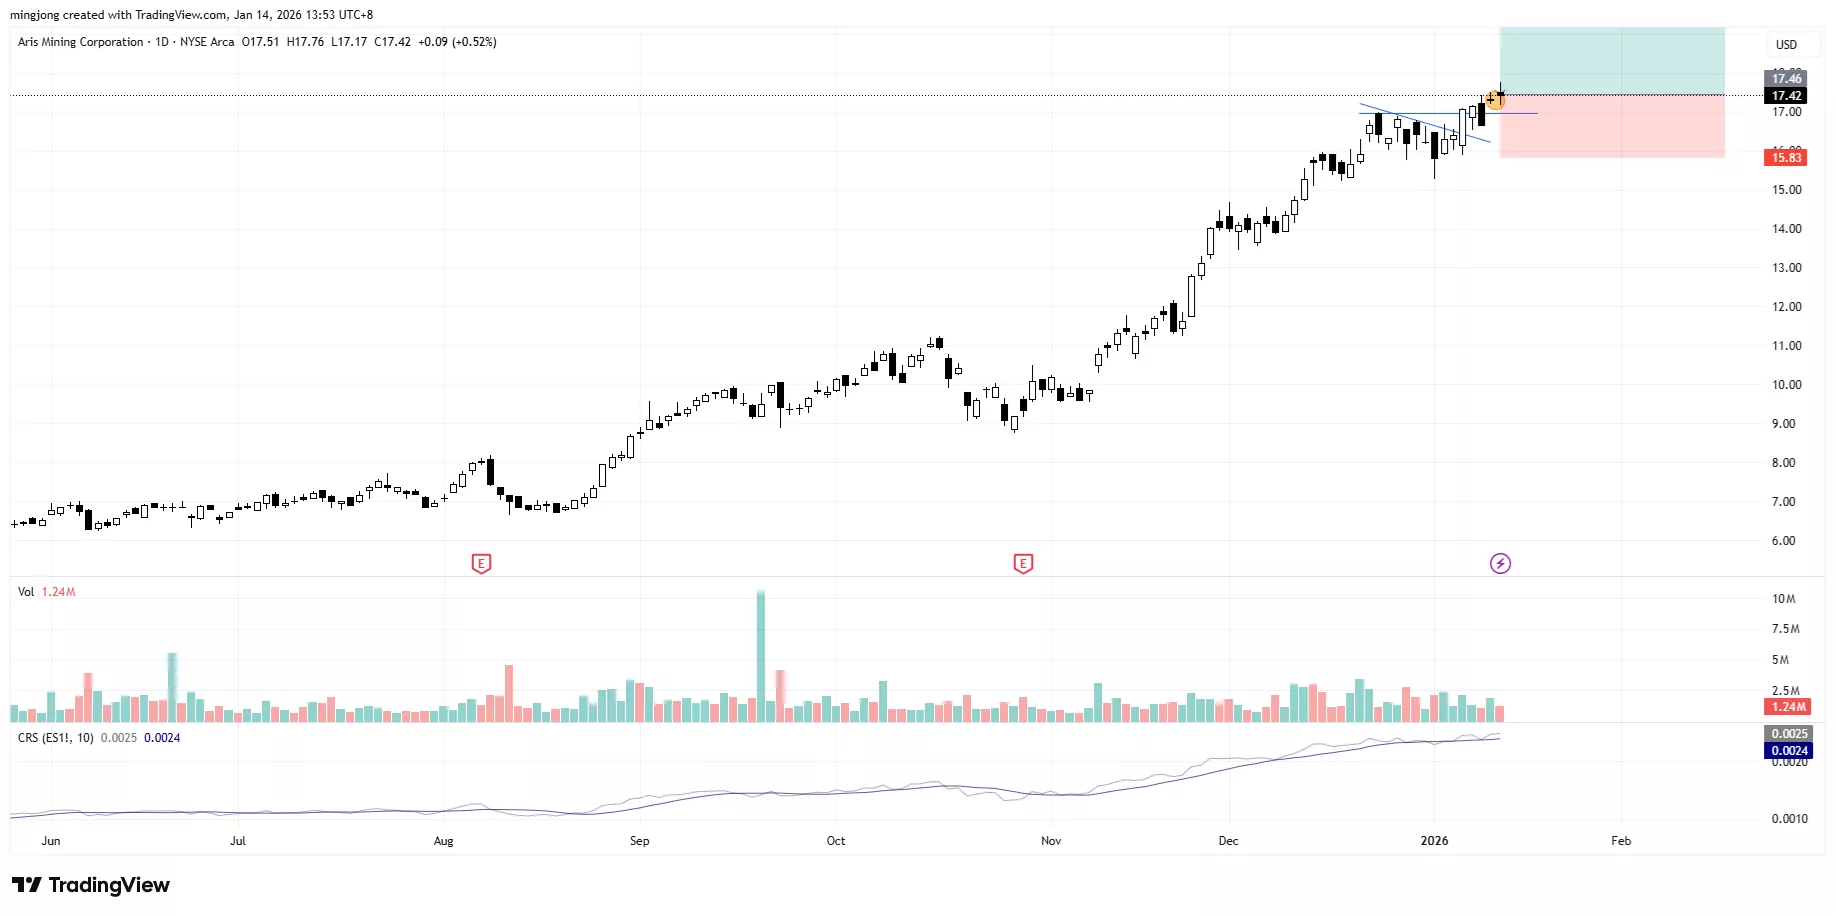
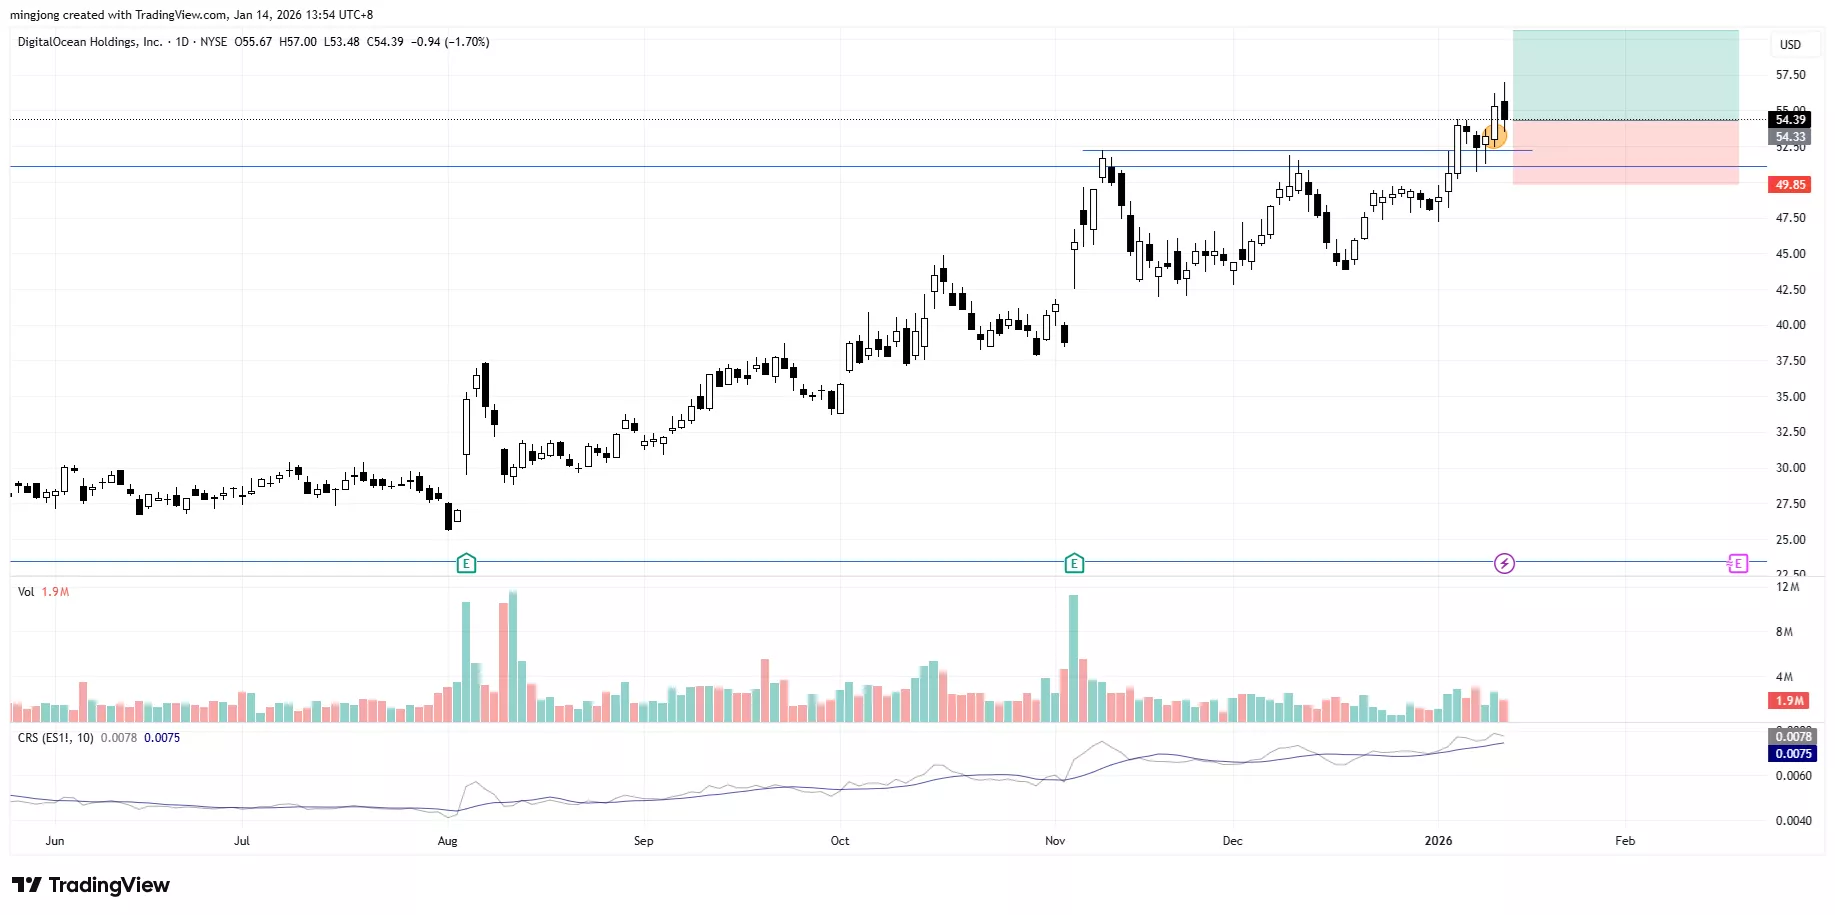
25 actionable setups such as IREN, AMRN, DOCN were discussed during the live session on 13 Jan 2026 before the market open (BMO).
(Click on image to enlarge)
More By This Author:
The S&P 500 Flashes Early Breakout Signal As Buyers Defend Critical Zone
This Quiet S&P 500 Rally Is Sending A Clear Message (Most People Are Missing It)
Supply Absorbed: Watch This Accumulation Pattern Play Out
Disclaimer: The information in this presentation is solely for educational purpose and should not be taken as investment advice.


