
The S&P 500 "Spring Trap" That Fooled 90% Of Traders

Image Source: Pixabay
Find out the spring pattern that's trapping the bear, the exact price level that bulls MUST defend, the volume secret that told me to buy when everyone else was selling, and the coming next big move.
Watch the video from the WLGC session on 27 Jan 2026 to find out the following:
- The exact support zone that, if broken, signals real trouble—but if held, virtually guarantees a push to new all-time highs.
- A simple “change of character” bar technique that told me in October the market was shifting—and how to spot it yourself.
- Why the tariff selloff spring pattern was actually a massive bullish signal once you understand supply absorption (most traders got this completely wrong).
- And a lot more…
Video Length: 00:09:43
Market Environment
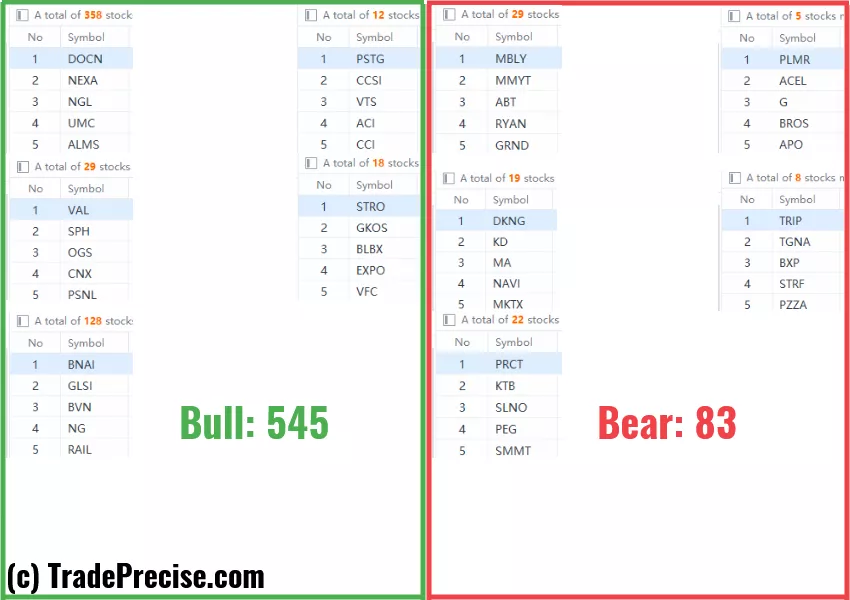
The bullish vs. bearish setup is 545 to 83 from the screenshot of my stock screener below.
(Click on image to enlarge)
Trade Setups
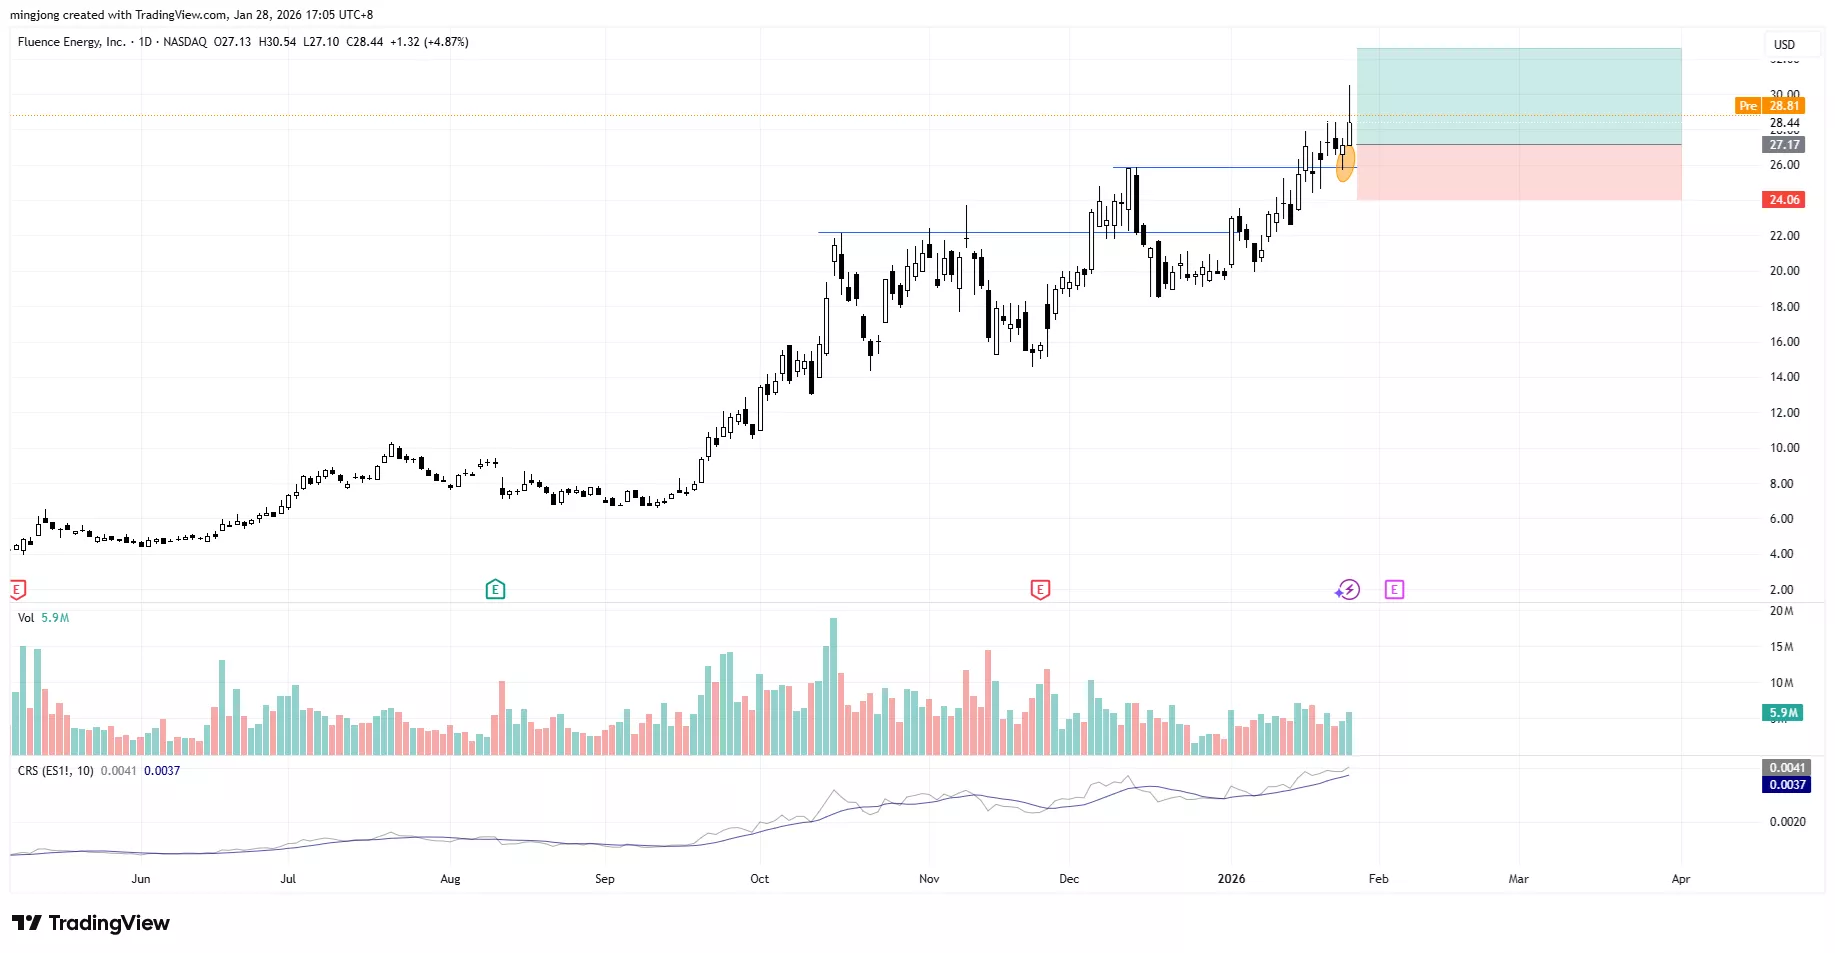
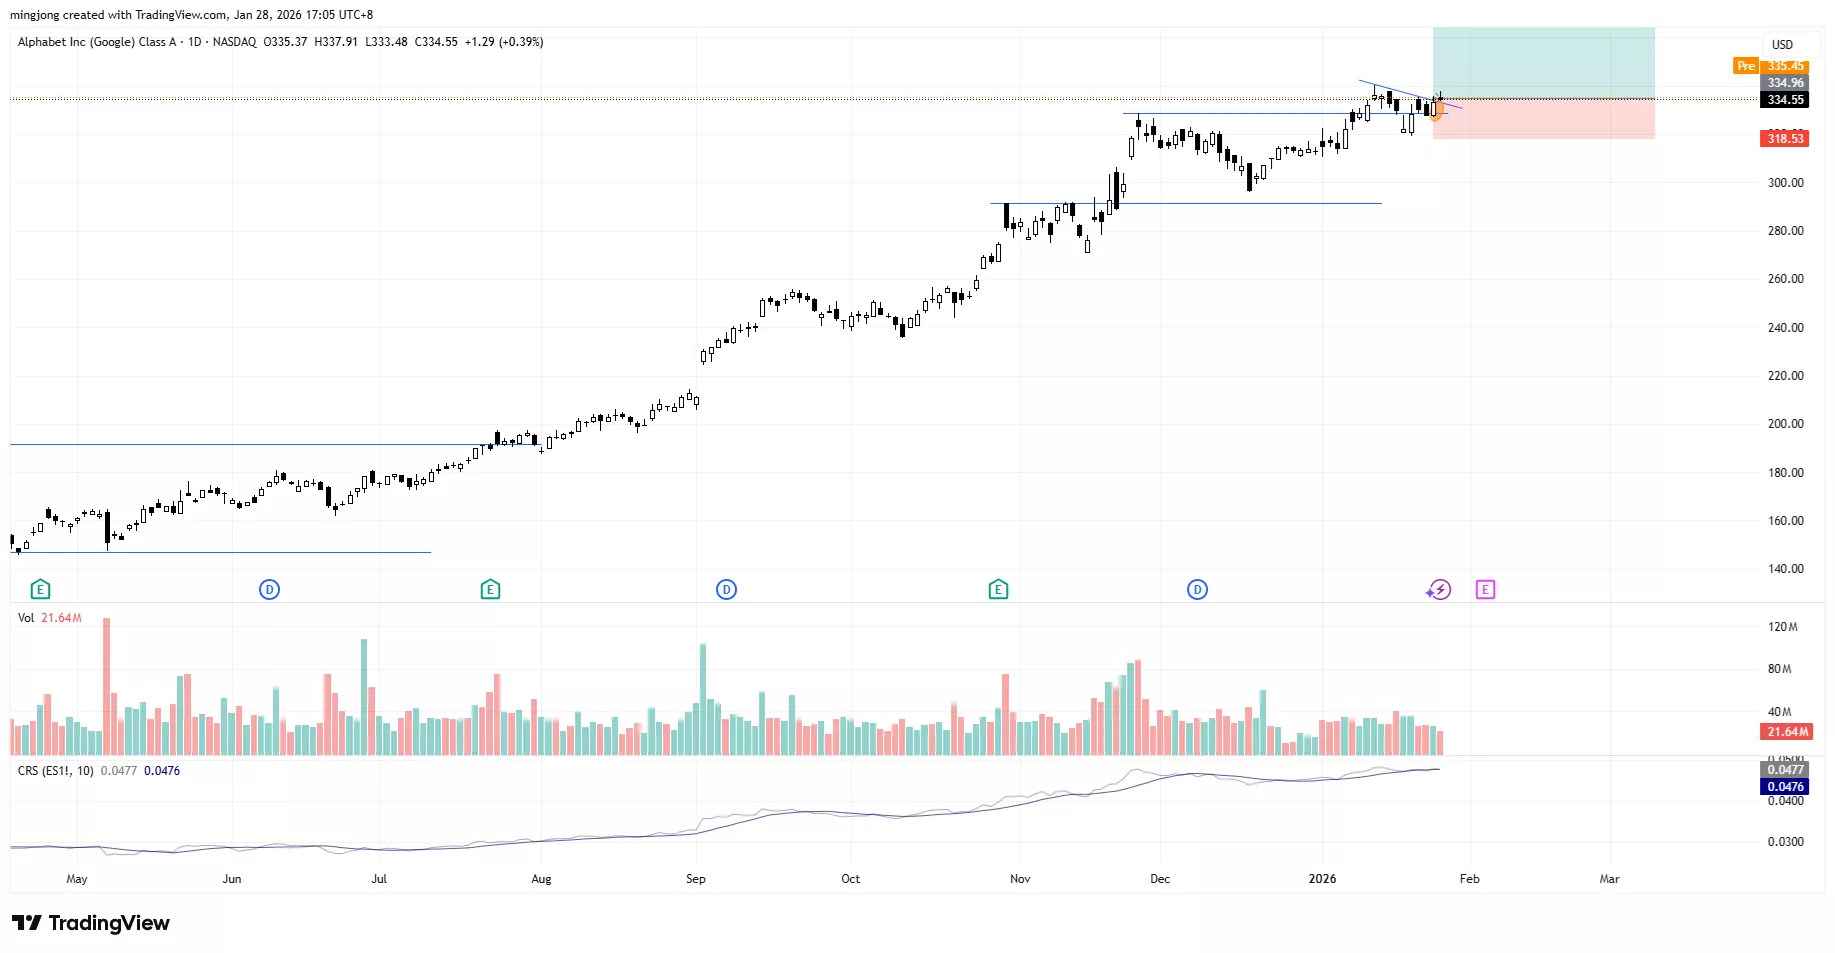
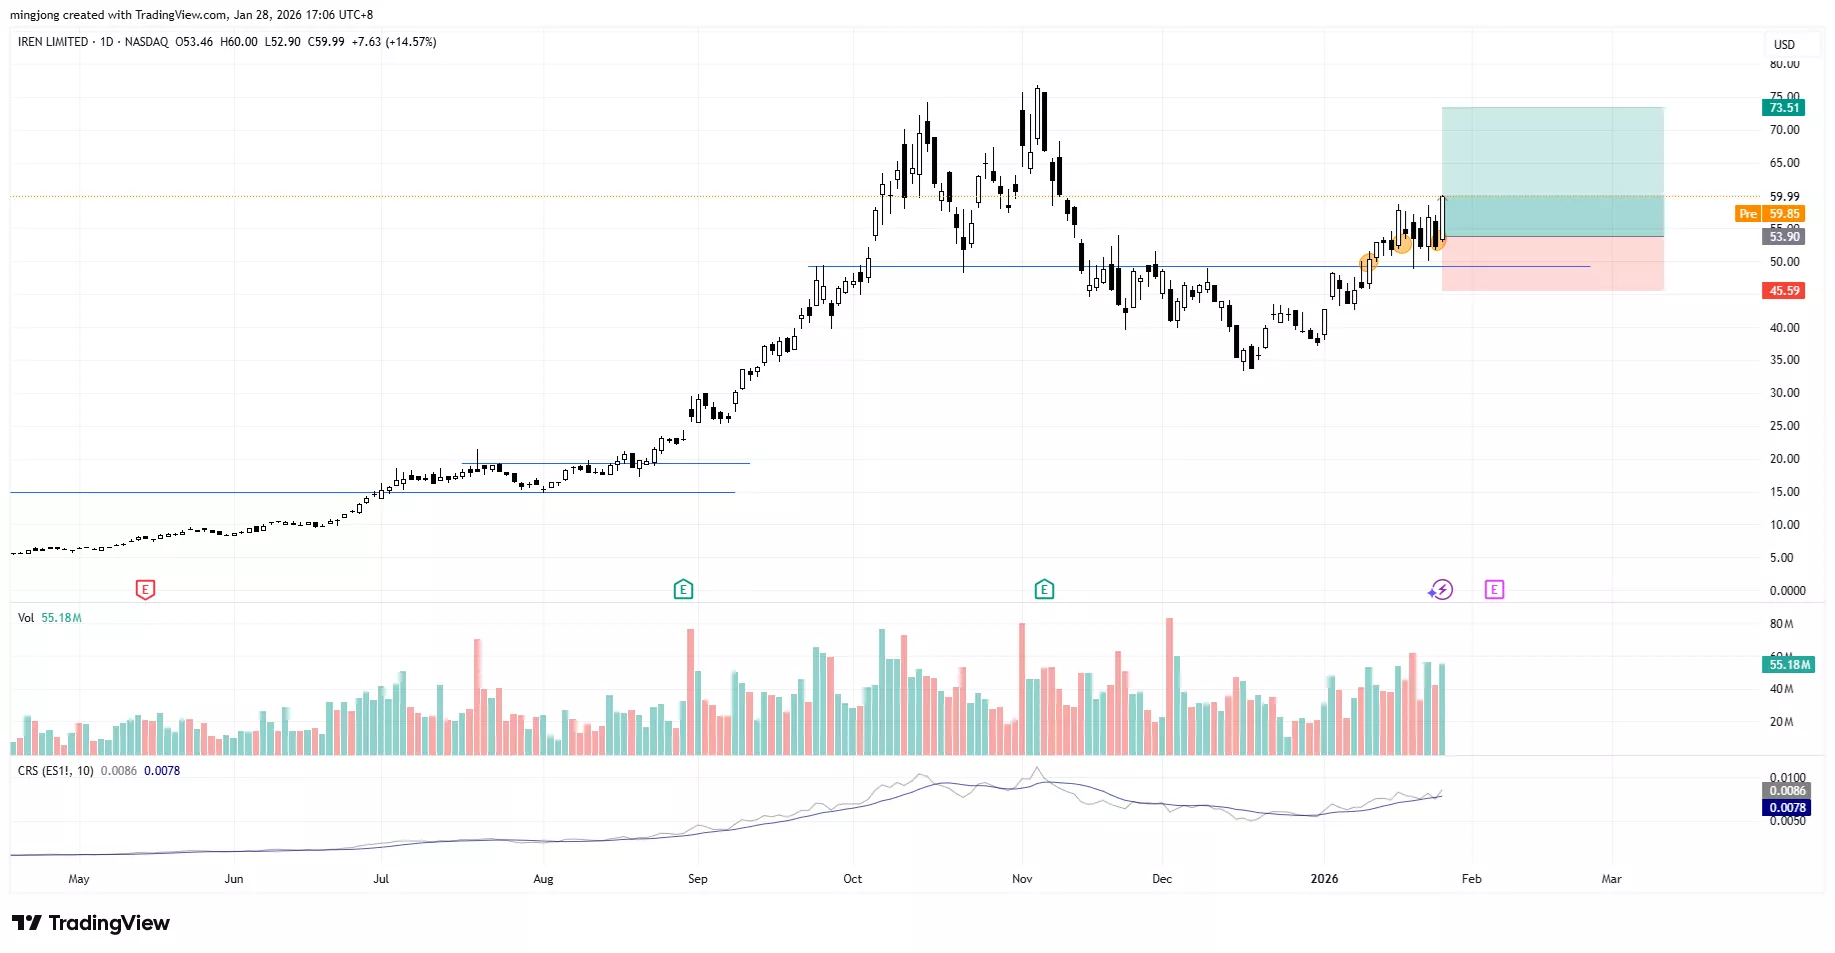
18 actionable setups such as FLNC GOOGL IREN were discussed during the live session on 27 Jan 2026 before the market open (BMO).
(Click on image to enlarge)
(Click on image to enlarge)
(Click on image to enlarge)
More By This Author:
S&P 500 Just Flashed This Rare Signal — Here's What Smart Traders Do Next
4 Years Of Accumulation Complete - This Index Is Where The Real Gains Are In 2026
The S&P 500 Flashes Early Breakout Signal As Buyers Defend Critical Zone
Disclaimer: The information in this presentation is solely for educational purpose and should not be taken as investment advice.


