

Image Source: Pexels
SPX Monitoring purposes; Long SPX on 10/31/25 at 6840.20.
Our gain 1/1/24 to 12/31/24 = 29.28%; SPX gain 23.67%
Our Gain 1/1/23 to 12/31/23 SPX= 28.12%; SPX gain 23.38%
Monitoring purposes GOLD:Long GDX at 75.76; 9/29/25
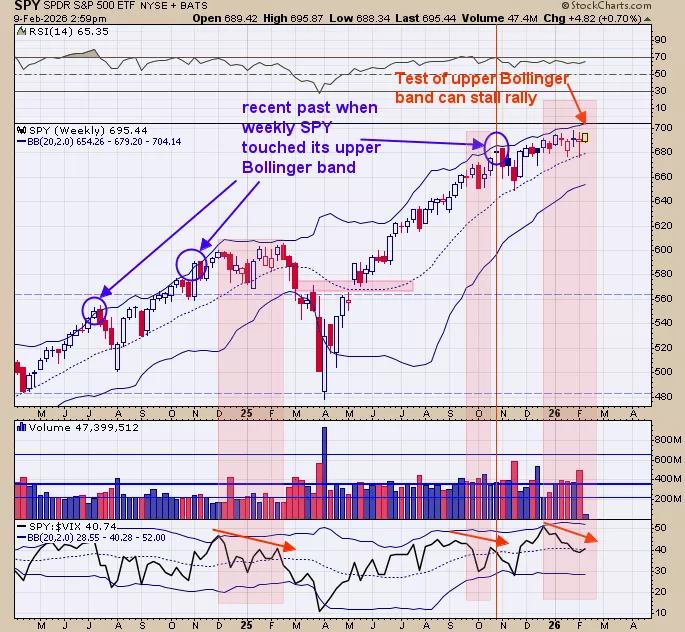
Above is the weekly SPY with its Bollinger band. Market can stall when the weekly SPY tests it upper Bollinger band (noted with blue arrows).Weekly upper Bollinger band lies at 704 on the SPY which in turn is an area to watch. We noted is shaded pink when the weekly SPY was making higher highs while the weekly SPY/VIX ratio was making lower high; which is negative divergence. SPY is now setting on the highs while the SPY/VIX is far below its high which is a negative divergence; but could go away if the SPY/VIX ratio rally to new highs; but that is not what is happening right now. Seasonality turns modestly bearish mid February and if the above mentioned indicators show divergence we may sell our long SPX.
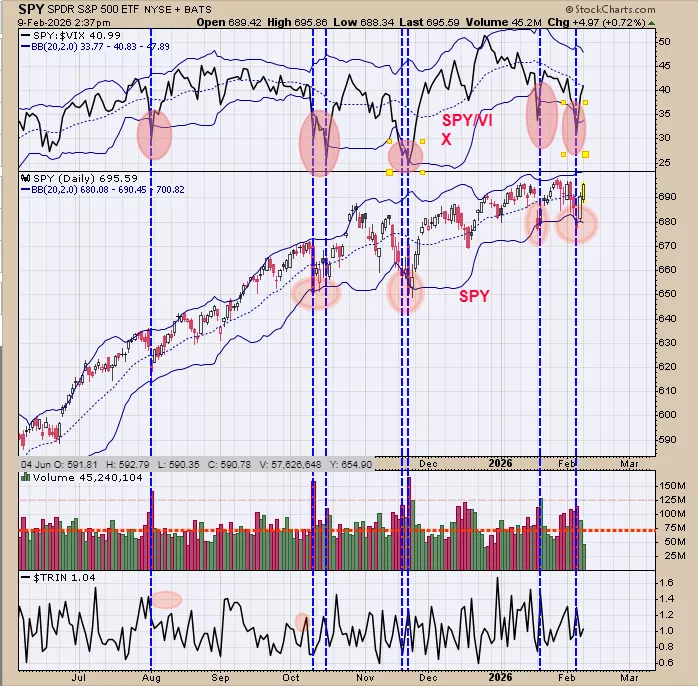
The third window up from the bottom is the daily SPX with its Bollinger band and next higher window is the daily SPX/VIX ratio with its Bollinger band. We noted the times with blue dotted lines when the SPX/VIX ratio and SPY exceeded its lower Bollinger band and each time the market rebounded shortly there after. The upper and lower Bollinger band are two standard deviation from its mid Bollinger band and when either outer Bollinger band is tested, suggests the market is stretched to far and is due for a reversal. The SPX/VIX ratio and SPY where below its lower Bollinger last Thursday. The rally that previously ensued this condition went on to new highs.
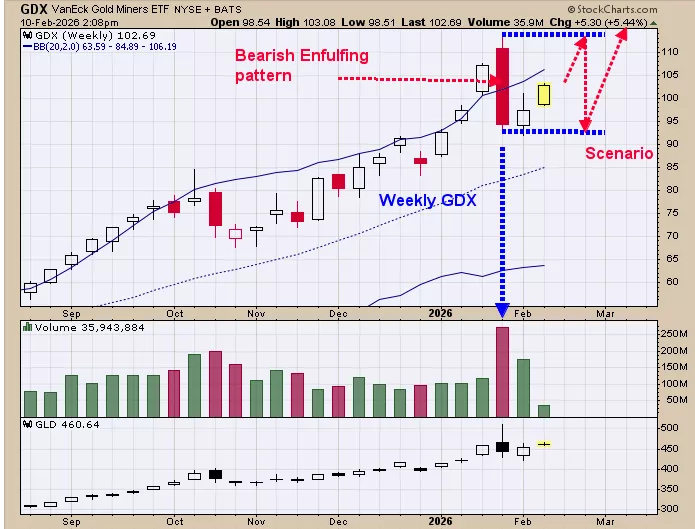
Here is what may transpire in the coming weeks. Above is the weekly GDX. The week of January 26 produced a candlestick pattern called a “Bearish Engulfing pattern” (noted on chart).This candlestick pattern suggests a bearish outcome. Most “Bearish Engulfing patterns” highs are tested and that is what we are expecting here. To get through the “Bearish Engulfing high” the volume would need to be as high as the “Bearish Engulfing” volume; which is unlikely and there fore the high of the “Bearish Engulfing” will have resistance. The up down volume and Advance/decline indicators remain bullish, so we are not expecting a top but rather a trading range where the high of the “Bearish Engulfing” will be resistance (near 113.00) and support will be the low of the “Bearish Engulfing” (near 94.00) Longer term trend remain bullish. Long GDX on /29/25 at 75.76.
More By This Author:
Bullish Signals Emerging After Market Panic
There Is Panic In The Market
Panic Signals Support As SPX And GDX Trends Stay Bullish
Comments
Log in or sign up to join the conversation.