
There Is Panic In The Market

Image Source: Pexels
SPX Monitoring purposes; Long SPX on 10/31/25 at 6840.20.
Our gain 1/1/24 to 12/31/24 = 29.28%; SPX gain 23.67%
Our Gain 1/1/23 to 12/31/23 SPX= 28.12%; SPX gain 23.38%
Monitoring purposes GOLD:Long GDX at 75.76; 9/29/25
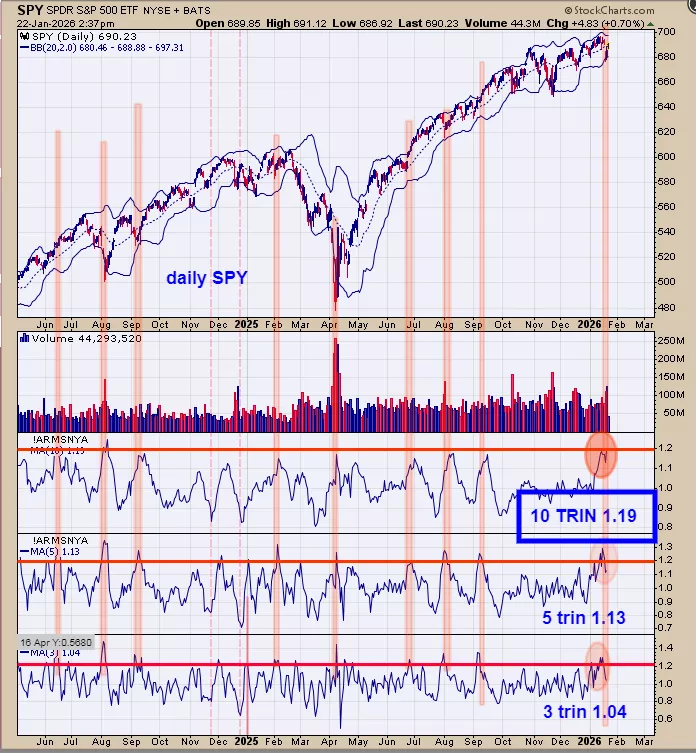
The bottom window is the 3 day TRIN; next higher window is the 5 day TRIN and next higher window is the 10 day TRIN. Trin closes above 1.20 show there is panic in the market and panic only form near lows. The more days of panic readings the stronger the rally and therefore the 10 day TRIN is more important than the 3 or 5 day TRIN. Current 10 day TRIN stands at 1.19. Shaded in pink on the chart above the times when the 3, 5 and 10 day TRIN reached panic levels near 1.20 and higher where those panic reading occurred on the SPY chart. In call cases the market moved higher for the short term and most for the intermediate term.
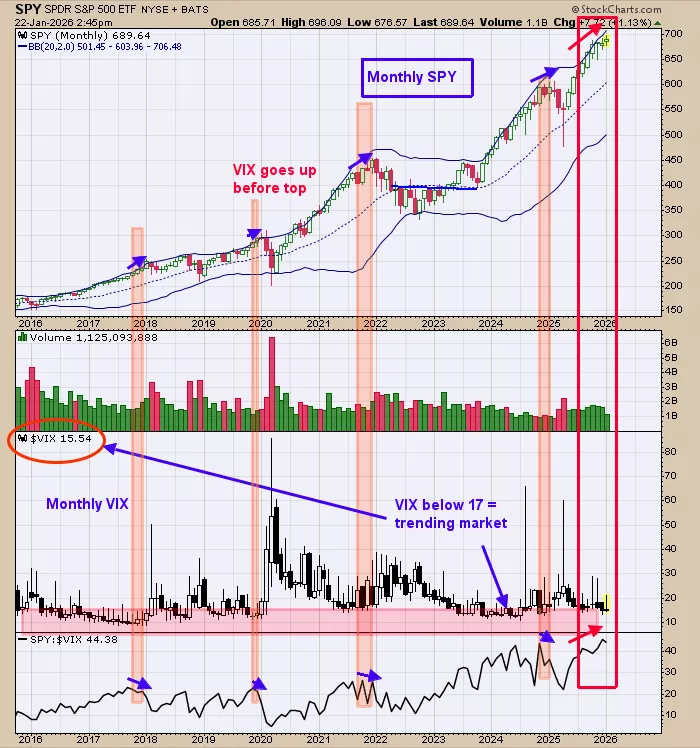
Above looks at the larger picture for the SPY; this chart goes back to 2015 and is on the monthly time frame. Bottom window is the monthly SPY/VIX ratio and top window is the monthly SPY. Usually the VIX will start going up (SPY/VIX will go down) before a top is reached in the SPY. We shaded in pink on the chart above when this condition present. Currently the SPY on the monthly time frame has made higher highs and the SPY/VIX ratio (bottom window) also has made higher highs, though there is a modest dip currently at the end of the chart which is a minor divergence. However this minor divergence may “go away” before the month is out. Staying long the SPX for now.
(Click on image to enlarge)
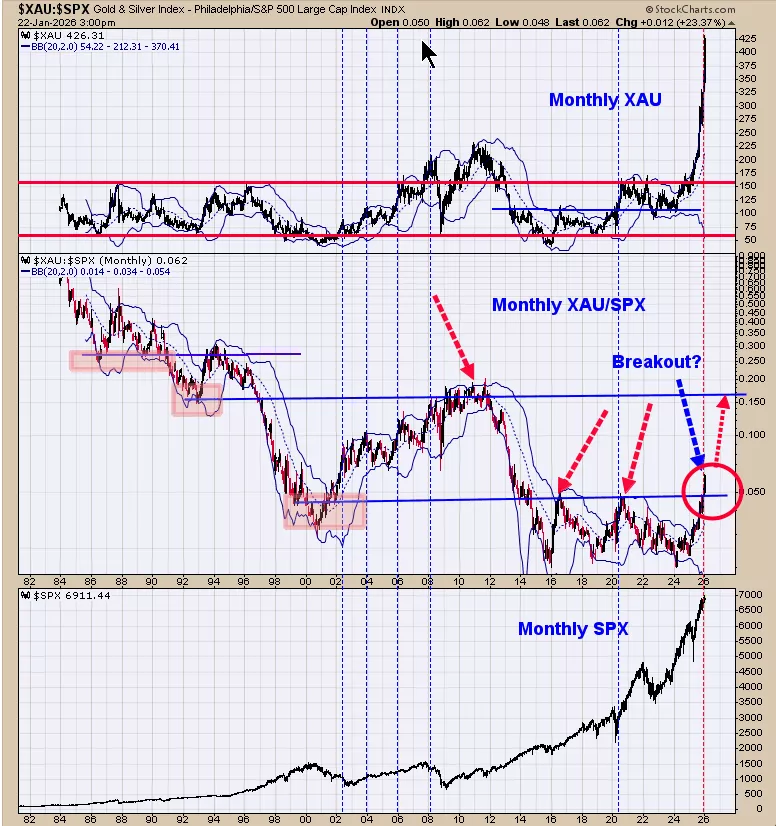
The middle window is the monthly XAU/SPX. When this ratio is rising than XAU is outperforming SPX and when this ratio falling than SPX is outperforming the XAU. This ratio has been rising since the start of 2024 (2 years) showing that gold stocks have been outperforming SPX stocks. The red circle on the chart shows a breakout where it closed above its previous highs of 2016 and 2020 highs near .05. This breakout suggests the XAU/SPX ratio will go (at some point) to the next higher resistance which is the 2010 high near .15. So what does that mean? If the .15 level is reached it will mean that gold stocks (XAU) will outperform the SPX stocks by 300%.Gold stocks may be the place to be over the next several years. Long GDX on 9/29/25 at 75.76.
More By This Author:
Panic Signals Support As SPX And GDX Trends Stay Bullish
Panic Only Forms Near Lows
An Extended Market
Signals are provided as general information only and are not investment recommendations. You are responsible for your own investment decisions. Past performance does not guarantee future performance. ...
more

