

Image Source: Pexels
SPX Monitoring purposes; Long SPX on 10/31/25 at 6840.20.
Our gain 1/1/24 to 12/31/24 = 29.28%; SPX gain 23.67%
Our Gain 1/1/23 to 12/31/23 SPX= 28.12%; SPX gain 23.38%
Monitoring purposes GOLD: Long GDX at 75.76; 9/29/25
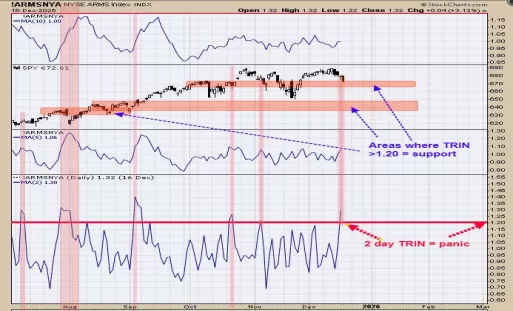
The tick and TRIN closes are showing panic readings over the last couple of days and panic only forms near lows. The bottom window is the two day average of the TRIN; readings above 1.20 are bullish. We noted the times when the 2 day TRIN reached 1.20 with shaded pink and where it corresponded with the SPY price. Yesterday the 2 day TRIN reached 1.30 and bullish. On the SPY window we noted the prices on the SPY when the TRIN reached 1.20 and higher with a vertical pink shaded area which is where panic has formed in the past. Past panic levels in the SPY are a support area and the SPY is testing the previous panic level. Should find support near current levels.
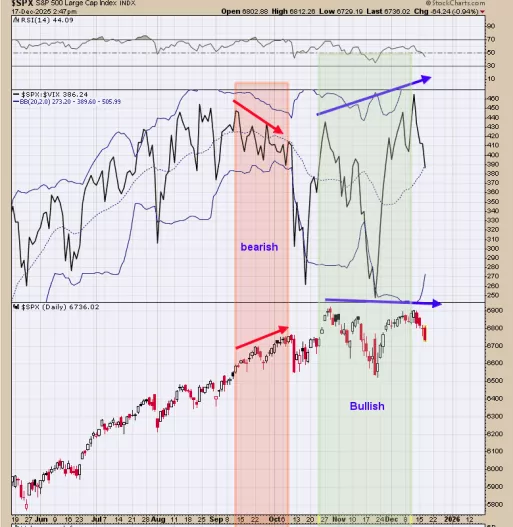
The bottom window is the daily SPX and next window higher is the SPX/VIX ratio. The SPX/VIX ratio leads the SPX. We noted is shaded green where the SPX/VIX ratio made higher high while the SPX made a lower high. Since SPX/VIX leads the SPX, this condition suggests at some point the SPX will rally to a new high. We also pointed out a negative divergence (shaded in pink) where SPX/VIX ratio made lower highs and the SPX made higher highs suggesting a pull back was coming; and it did. Seasonality has turned bullish and the SPX/VIX ratio is showing a bullish divergence and long with panic readings in the trin and tick closes.
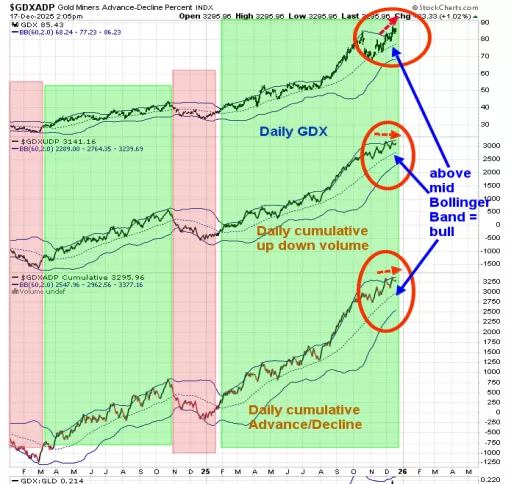
Above is the updated daily short term momentum chart for the up down volume and advance/decline for the GDX components; the monthly GDX chart remain bullish. The bottom window is the GDX cumulative A/D; next higher window is the GDX cumulative up down volume and top window is the GDX. Currently (red circle) GDX is holding near its highs and both indicators have flipped sideways and holding near their highs and holding above their mid Bollinger bands suggesting the GDX trend is still up.A close below their mid Bollinger band by both indicators would suggests that GDX is starting a consolidation. Seasonality turns from neutral to bullish starting December 20 (plus or minus one week).There is evidence the current rally may continue. Long GDX on 9/29/25 at 75.76.
More By This Author:
An Extended Market
Year-End Signals Hint At A Bullish SPX Setup While Gold Miners Enter A Critical Cycle
SPY Eyes New Highs, GDX Signals Possible Consolidation


Comments
Log in or sign up to join the conversation.