
Year-End Signals Hint At A Bullish SPX Setup While Gold Miners Enter A Critical Cycle

Photo by Austin Hervias on Unsplash
SPX Monitoring purposes; Long SPX on 10/31/25 at 6840.20.
Our gain 1/1/24 to 12/31/24 = 29.28%; SPX gain 23.67%
Our Gain 1/1/23 to 12/31/23 SPX= 28.12%; SPX gain 23.38%
Monitoring purposes GOLD: Long GDX at 75.76; 9/29/25
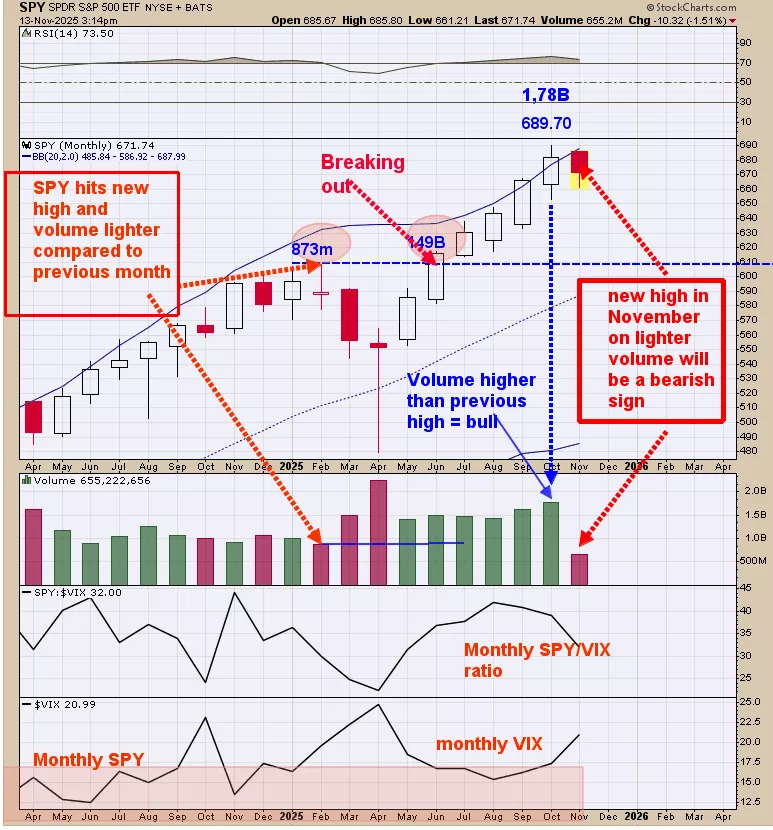
We are going into year end where the monthly charts carry more importance. A bullish run in November and or December will imply a bullish 2026. Above is the monthly SPY. October came in with a new high and volume expanded from the previous month suggesting the rally should continue. If the SPY hits a new high this month (expected) and volume drops 10% or more from the previous month (like last February) a bearish scenario will be setup. It’s still early in November but it’s a head up for what may transpire in the coming weeks. If November manages to work higher with higher volume than December we will be looking for the potential bearish signal. Most likely 2026 could be a difficult year and the bearish setup could come in November or December and maybe not at all. On Friday’s the TRIN closed at 1.21 and the tick at -350 which is a bullish combination and suggests a low will form as early as the day of the readings to as late as two day’s later which is tomorrow. Today’s trading appears to be a test of Friday’s low. New high are still expected.
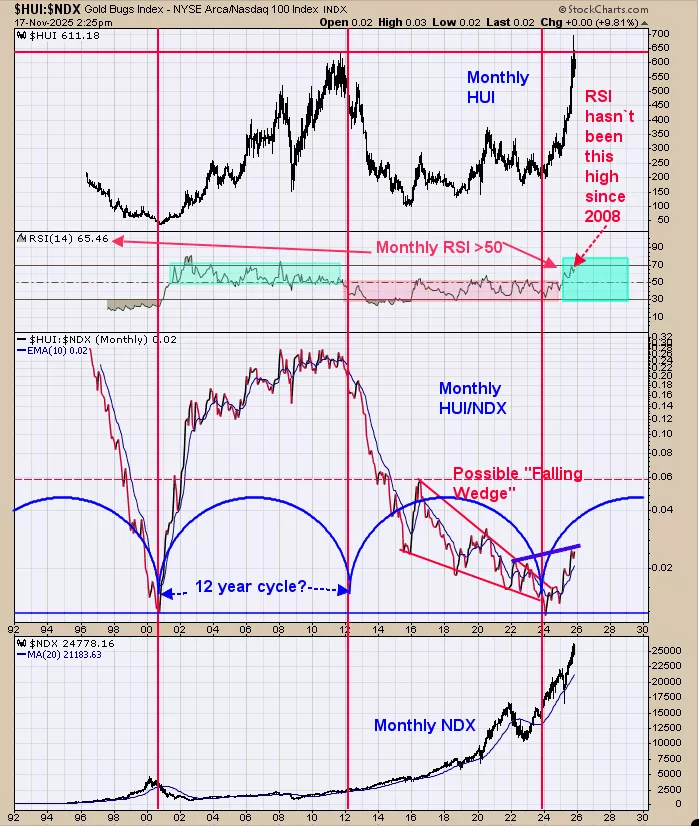
There is always a bull market somewhere and a bull run may have started in the HUI index back in 2024 that could last for 12 years. The middle window is the monthly HUI/NDX ratio and next higher window is the monthly RSI for this ratio. When the RSI is above 50 that show that HUI is out performing NDX (noted in shaded green) and when below 50 than NDX is outperforming HUI (shaded in pink). This ratio turned up in early 2024 showing that HUI is outperforming NDX. The RSI for this ratio hit 70 recently suggesting an “initiation of an uptrend”. The last time this happen was coming off a downtrend in the ratio back in 2001 (see chart above). We don’t have a lot of examples but there appears to be a 12 year cycle to this ratio. As long as the RSI of this monthly ratio stays above 50 than gold stocks will outperform the Nasdaq stocks.
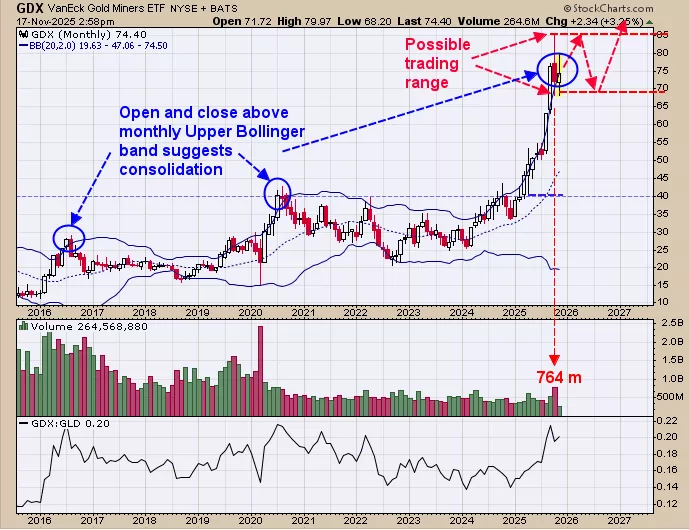
Above is the monthly GDX going back to 2016. We circled in blue the times when GDX open and closed above it’s upper Bollinger band; this condition usually leads to consolidation. October trading in GDX open and closed above its upper Bollinger band suggesting a consolidation is possible. GDX high came in near 85.00 in October with 764 million shares traded. A test of the 85.00 range on 687 million shares (10% lighter volume) will suggest the 85.00 area has resistance. If a market can’t take out the previous high with higher volume it will reverse and attempt to take out the previous low. The previous low in this case is the 70.00 range. Its possible in the coming months for a trading range between 85.00 and 70.00 to develop. Long GDX on 9/29/25 at 75.76.”
More By This Author:
SPY Eyes New Highs, GDX Signals Possible Consolidation
SPY Trend Strong; GDX Remains Internally Bullish
Market Pauses After Selloff; GDX Holds Uptrend Amid Consolidation
Signals are provided as general information only and are not investment recommendations. You are responsible for your own investment decisions. Past performance does not guarantee future performance. ...
more

