
SPY Eyes New Highs, GDX Signals Possible Consolidation
SPX Monitoring purposes; Long SPX on 10/31/25 at 6840.20.
Our gain 1/1/24 to 12/31/24 = 29.28%; SPX gain 23.67%
Our Gain 1/1/23 to 12/31/23 SPX= 28.12%; SPX gain 23.38%
Monitoring purposes GOLD: Long GDX at 75.76; 9/29/25
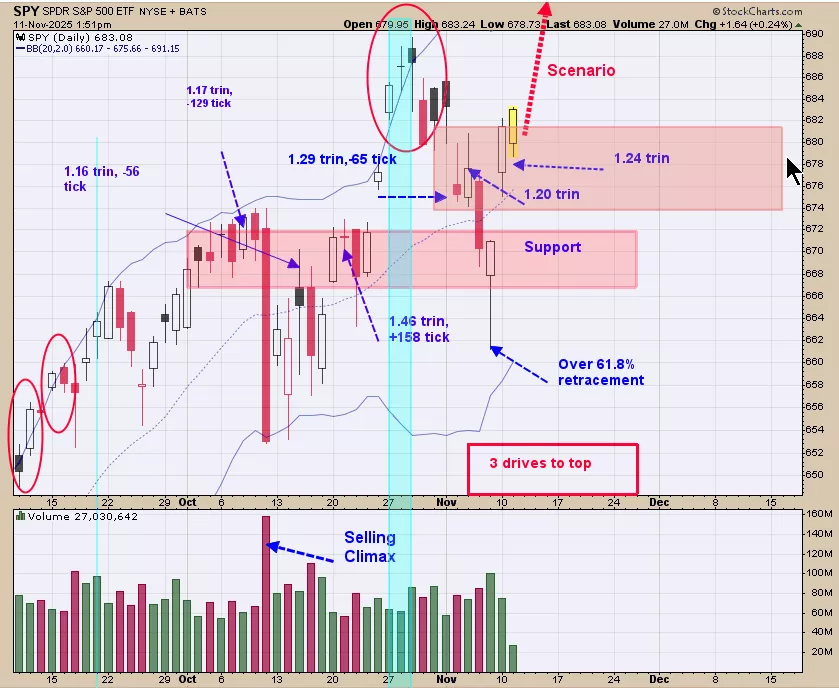
We shaded in pink the price area where the TRIN closed above 1.20. Trin closes above 1.20 show panic is present and panic only forms near lows. Referring to the chart above, the SPY is just now rally out of the panic region near 680 and this rally may go on to new highs. The pattern that may be developing is a “Three Drives to Top”. This pattern has three higher highs and the retracement off of the second high retraces over 61.8% (current SPY did over 61.8% retracement); The third new high completes the pattern and the pattern than predicts a pull back to where the “Three Drives to Top” began; in this case would be a pull back to 654 SPY. New high is expected and see what happens there.
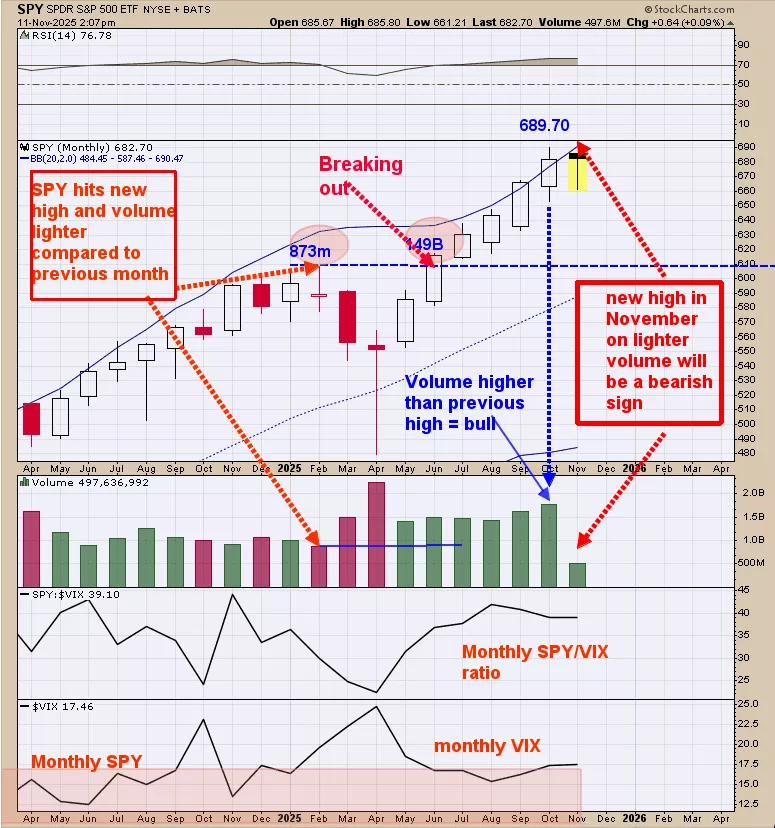
Above is the monthly SPY. Turn your attention to February. Notice a new high was made in February and notice also that Volume decreased to the prior months volume, which was a bearish sign. From the February high the SPY dropped into the April low. Now turn your attention to the current timeframe. October came in with a new high and volume expanded from the previous month suggesting the rally should continue. If the SPY hits a new high this month (expected) and volume drops 10% or more from the previous month (like last February) a bearish scenario will be setup. It’s still early in November but it’s a head up for what may transpire. If November manages to work high with higher volume than December we will be looking for the same bearish setup. Most likely 2026 could be a difficult year and the bearish setup could come in November or December ------- or not at all.
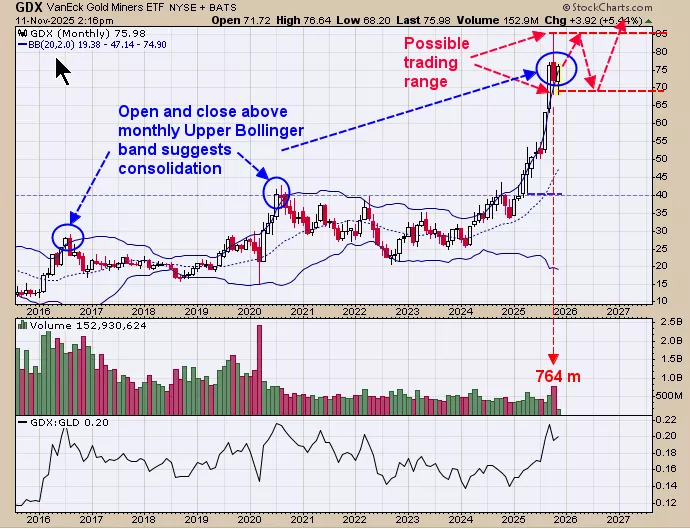
Above is the monthly GDX going back to 2016. We circled in blue the times when GDX open and closed above it’s upper Bollinger band; this condition usually leads to consolidation patterns. October of this year GDX open and closed above its upper Bollinger band suggests a consolidation is possible. GDX high came in near 85.00 in October with 764 million shares traded. A test of the 85.00 range on 687 million shares (10% lighter volume) will suggest the 85.00 area has resistance. If a market can’t take out the previous high with higher volume it will reverse and attempt to take out the previous low. The previous low in this case is the 70.00 range. Its possible in the coming months for a trading range between 85.00 and 70.00 ranges to develop. Long GDX on 9/29/25 at 75.76.
More By This Author:
SPY Trend Strong; GDX Remains Internally Bullish
Market Pauses After Selloff; GDX Holds Uptrend Amid Consolidation
Market Near Highs; Holding Cash, Bullish on Gold
Signals are provided as general information only and are not investment recommendations. You are responsible for your own investment decisions. Past performance does not guarantee future performance. ...
more

