
Market Near Highs; Holding Cash, Bullish On Gold

Image Source: Pexels
SPX Monitoring purposes; sold long 10/2/25 at 6715.35 = gain .4%; Long SPX on 9/30/25 at 6688.64.
Our gain 1/1/24 to 12/31/24 = 29.28%; SPX gain 23.67%
Our Gain 1/1/23 to 12/31/23 SPX= 28.12%; SPX gain 23.38%
Monitoring purposes GOLD: Long GDX at 75.76; 9/29/25
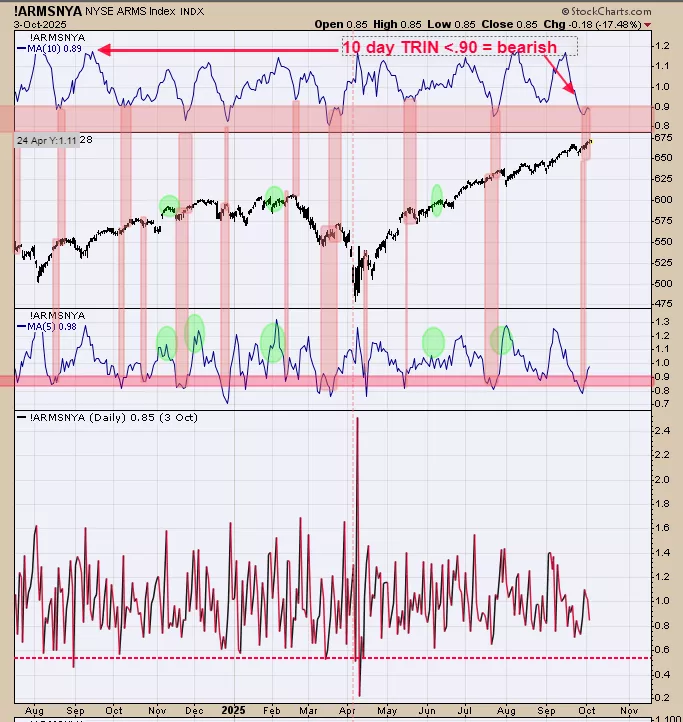
Top window is the 10 day average of the TRIN; next lower window is the SPY and next lower is the 5 day average of the TRIN. When 10 day and 5 day TRIN average .90 and lower the market is usually near a high. We shaded in pink the times when the 10 and 5 day TRIN reached .90 and lower and than extended that area to the SPY chart. Notice in majority of the case when both the 5 and 10 day TRIN reached .90 and lower the SPY was near a high. This indicator can be early which may be the case here. Seasonality turns bearish the week after option expiration week and expiration week is next week. This condition suggests market could hold up this week and next week. Keeping our powder dry for now. Sold long SPX on 10/2/25 at 6715.35 = gain .4%.
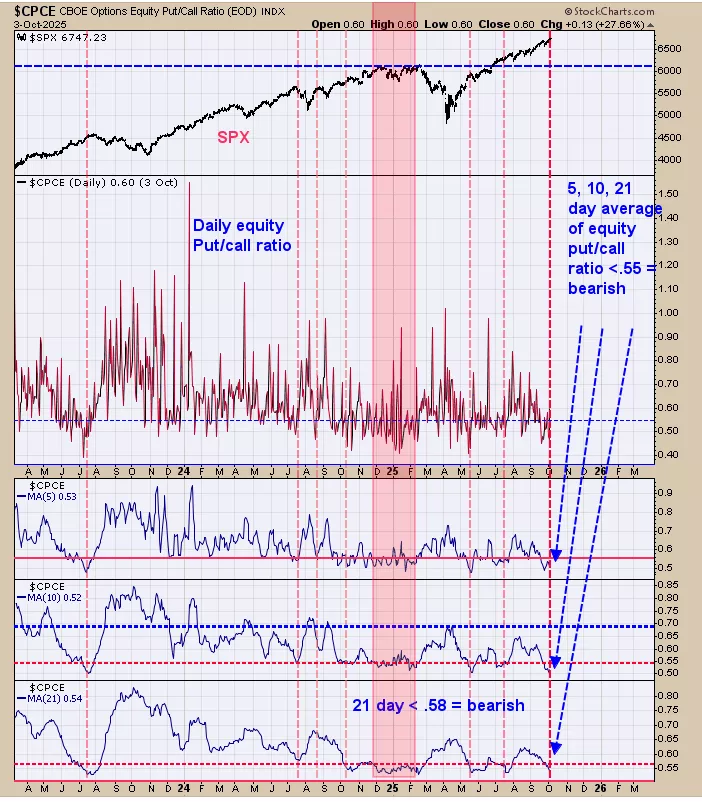
The bottom window is the 21 day average of the Equity put call ratio, next higher window is the 10 day average and next higher window is the 5 day average. All 3 moving averages of the equity put call ratio has moved into bearish levels suggesting the market is nearing a high. Chart above goes back near three years and we noted times when all three moving average for the equity put call ratio reached bearish levels with a dotted red line. In some cases when bearish levels where reached the market did move up but very modestly suggesting upside here is limited.
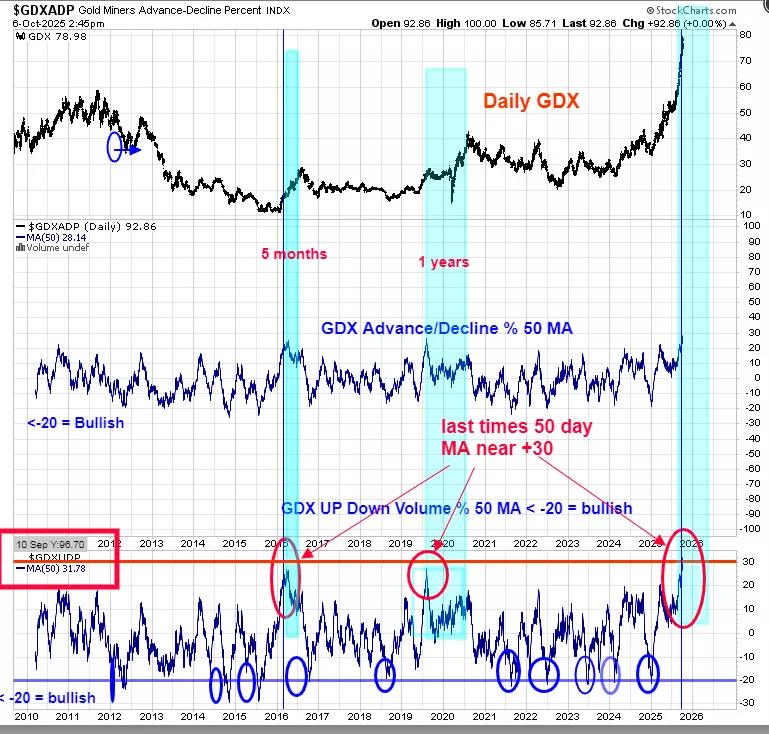
This chart bodes well for the intermediate term. The bottom window is the 50 day average of GDX up down volume percent. This chart goes back to 2010 which is the data limit for this indicator. The 50 day average for the up down volume for GDX reached near +30 three times; a very rare occurrence. The previous two times this indicator reached +30 range, GDX rallies another 5 months in 2016 and another year in 2019. Both previous times when this indicator approached +30 it did not touch +30; this time around this indicator exceeded +30 (currently standing at +31.79); we view this to have a stronger setup and possibly rally longer and stronger. Long GDX on 9/29/25 at 75.76.
More By This Author:
SPY Support Levels And GDX Momentum Signal Ongoing Strength
SPX Support Strengthens, Gold Uptrend Holds
“Bearish Rising Wedge”
Signals are provided as general information only and are not investment recommendations. You are responsible for your own investment decisions. Past performance does not guarantee future performance. ...
more

