
SPX Monitoring purposes; sold 8/29/25 at 6460.26= gain .02%; Long SPX on 8/18/25 at 6449.15.
Our gain 1/1/24 to 12/31/24 = 29.28%; SPX gain 23.67%
Our Gain 1/1/23 to 12/31/23 SPX= 28.12%; SPX gain 23.38%
Monitoring purposes GOLD: Back to neutral.
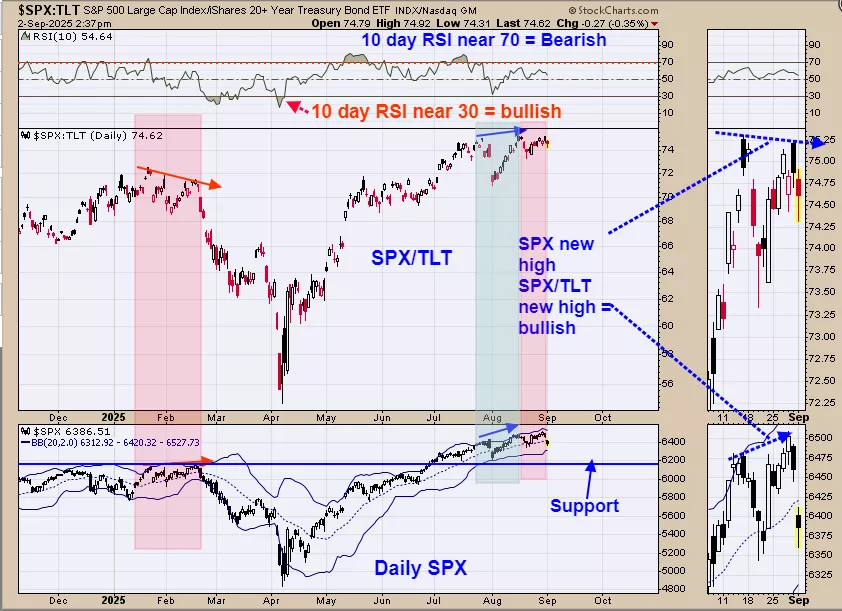
The middle window is the SPX/TLT ratio and bottom window is the SPX. A negative divergence is present when the SPX makes higher highs while the SPX/TLT ratio makes lower highs); take notice of far right window. This negative divergence started early last week. Support lays near the February high near 6200 SPX and a possible down side target. Neutral the SPX for now.
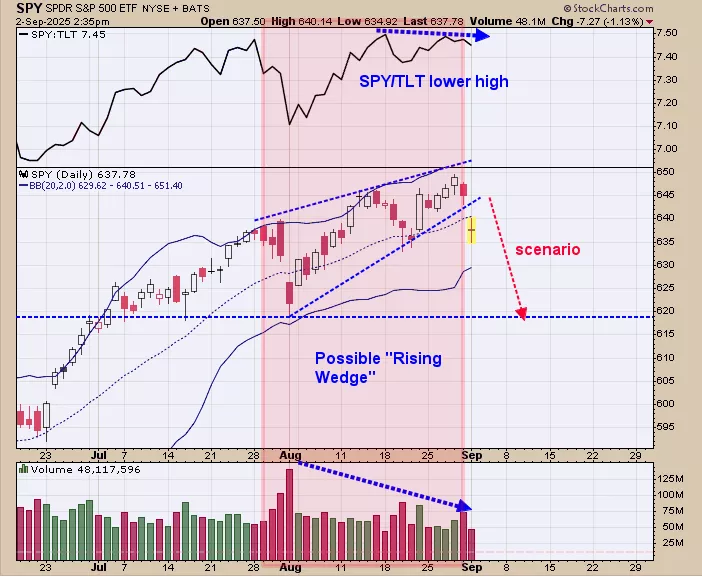
The pattern forming on the SPY could be a “Bearish Rising Wedge”. This pattern is characterized by decreasing volume as market makes higher highs and higher lows. This pattern has a downside target to where the pattern began which is near the 620 SPY range. The top window is the SPY/TLT ratio which is showing a bearish divergence. Ideally for a bullish divergence the SPY/TLT ratio should be making higher highs as the SPY makes higher highs as the SPY/TLT leads the SPY. The SPY/TLT ratio has made a lower high while SPY has made a higher high which is the bearish divergence. We still expect the support zone near 6200 – 6100 SPX range will be tested either in September or October or possible in both months.”
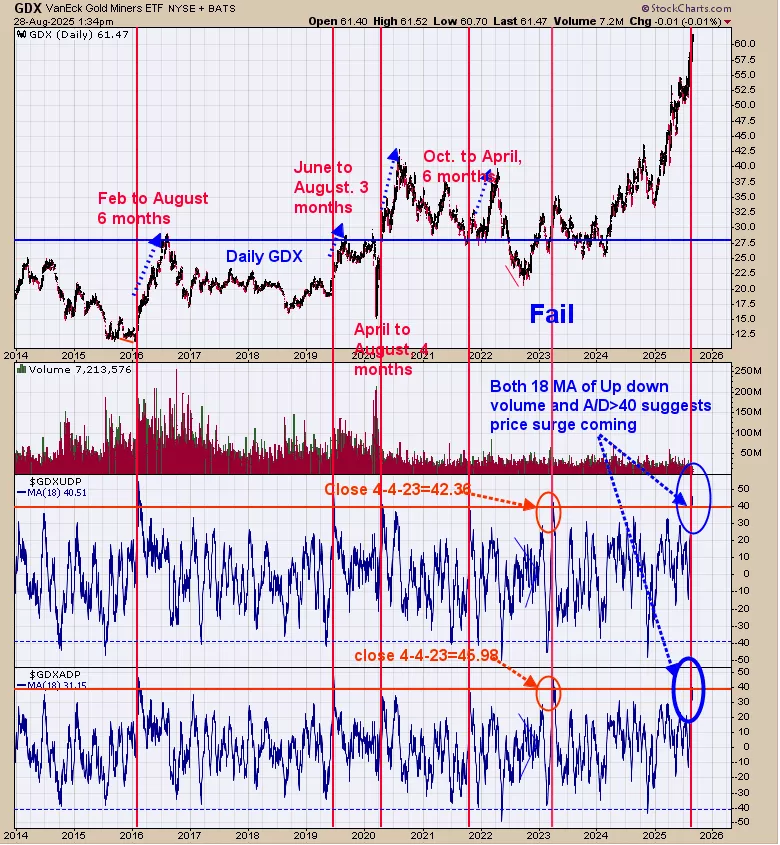
Chart has been updated from last week; worth repeating from last week, “We found this chart interesting. The bottom window is the 18 ma of the Advance/Decline for GDX and next higher window is the 18 ma of the up down volume for GDX. This chart goes back to 2014. We marked the times with red lines when both indicators reached +40 (bottom indicator reached 39.48 yesterday and current reading on other indicator is 44.99). What happens next is sometimes a mild consolidation before another surge higher that cans last 3 to 6 months. This is a rare occurrence as it has happened five times (not counting the current event) since 2014. Of the five times it occurred there was one failure in April 4 2023 (noted on chart); so that works out to be an 80% chance the current market will produce a surge in the coming weeks that may last 3 to 6 months. Want point out that the mild consolidation can last several weeks. We are thinking the senior sector may rest; where the junior sector will perform. This information suggests no top of any significant for GDX.”
More By This Author:
The Weakest Quarter
Bigger Trend Remains Bullish
GDX: Longer Term Uptrend Intact


Comments
Log in or sign up to join the conversation.