
SPX Monitoring purposes; Sold SPX on 7/14/25 at 6268.56= gain 2.90%; Long SPX on 6/25/25 at 6092.16.
Our gain 1/1/24 to 12/31/24 = 29.28%; SPX gain 23.67%
Our Gain 1/1/23 to 12/31/23 SPX= 28.12%; SPX gain 23.38%
Monitoring purposes GOLD: Sold long GDX 4/11/25 at 49.66 = gain 21.33%.
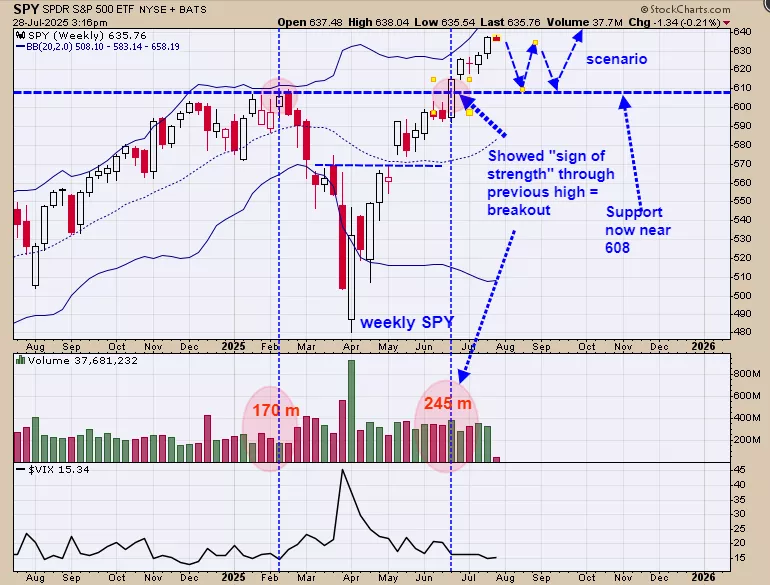
We ended up 29.28% for 2024; SPX up 23.67% for the year. The market is entering into the weakest quarter of the year, which lasts into October. Support lies near the 608 SPY. Above is the weekly SPY. The week of June 23 broke through the previous high of the week of February 11 (608 spy range) with a “Sign of Strength” which confirms the breakout. Now the previous high of 608 range should now act as support. Don’t have a clear sign but could end up with a short signal in this area. Sold long SPX (7/14/25) at 6268.56 = gain of 2.90%; Long SPX on 6/25/25 at 6092.16.
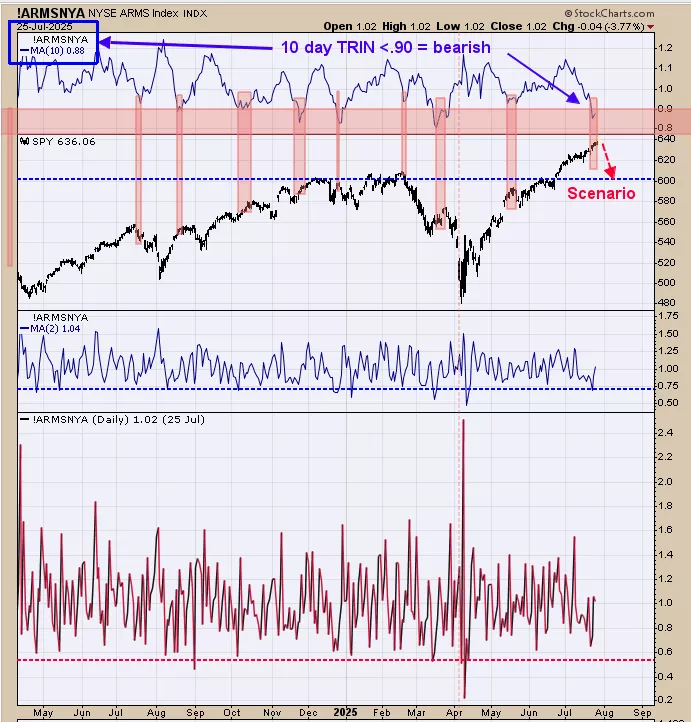
The top window is the 10 day average of the TRIN; readings above 1.20 are bullish and below .90 bearish. Current reading is .88 (see squared blue box top left). We shaded in light pink horizontally on the 10 day TRIN at .90 and below and than shaded in pink again vertically down to the SPY chart below when the 10 day TRIN fell below .90. There is mounting evidence that market is nearing a stall area if not a short term top. Tops take longer to develop than bottoms so patience is needed short term. Bigger trend remains bullish but may see a test of the breakout area near 609 SPY level at least once if not more.
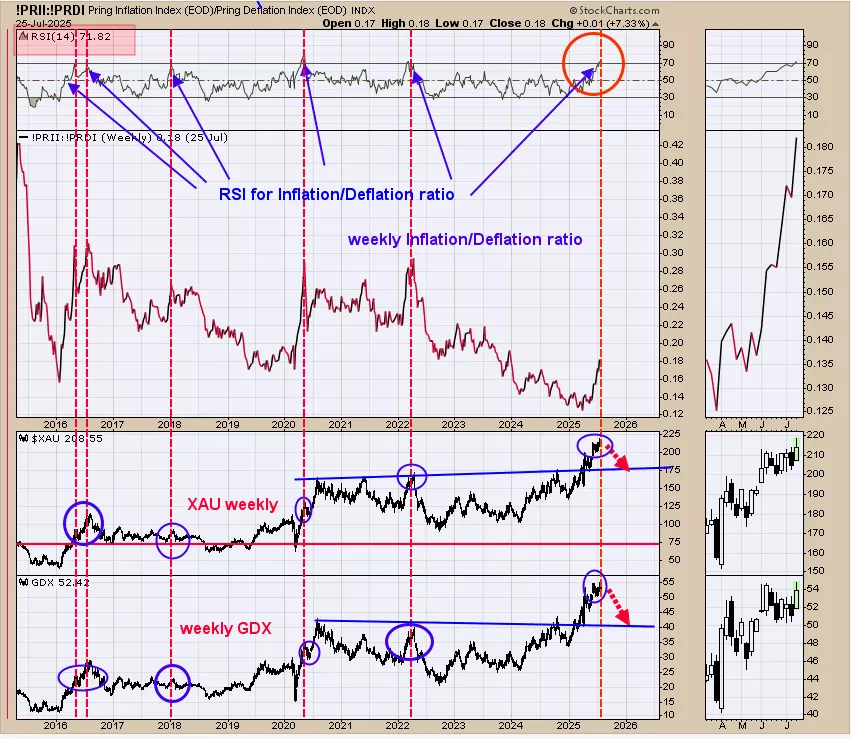
More evidence that a high in the gold stocks is near. The bottom window is the weekly GDX; next higher window is the weekly XAU and above that is the weekly inflation/deflation ratio and top window is the weekly RSI for this ratio. Highs in GDX and XAU have occurred when the weekly RSI for the inflation/deflation ratio reaches above 70 (current reading is 71.82). The chart above goes back to mid 2015 and we noted the times when the weekly RSI reached above +70 with red dotted lines. We exited our long GDX back in mid April near the 50.00 range and GDX has changed little since then. There is potential for a pull back in GDX that may test the 40.00 range and XAU may test the 185 range.
More By This Author:
Bigger Trend Remains Bullish
GDX: Longer Term Uptrend Intact
The Weekly Charts Are Bullish


Comments
Log in or sign up to join the conversation.