

Image Source: Pexels
SPX Monitoring purposes; Sold SPX on 7/14/25 at 6268.56= gain 2.90%; Long SPX on 6/25/25 at 6092.16.
Our gain 1/1/24 to 12/31/24 = 29.28%; SPX gain 23.67%
Our Gain 1/1/23 to 12/31/23 SPX= 28.12%; SPX gain 23.38%
Monitoring purposes GOLD:Sold long GDX 4/11/25 at 49.66 = gain 21.33%.
(Click on image to enlarge)
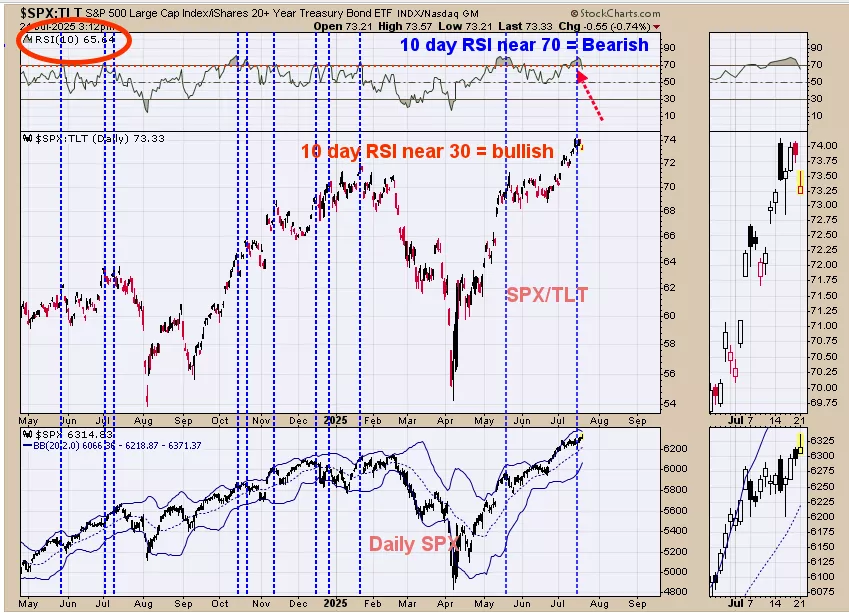
We ended up 29.28% for 2024; SPX up 23.67% for the year. The bottom window is the daily SPX; next higher window is the SPX/TLT ratio. We noted times when the RSI for the SPX/TLT ratio reached +70 (Last Thursday RSI reached +79 and current RSI is +65) with blue dotted lines. In most cases (80% of the time) the market was near at least a short term high if not a longer term high. The market is entering into the weakest quarter of the year that last into October. Most likely the SPX in entering into a trading range that may last into October. Bigger trend is up and 740 on the SPY are possible in the coming months, but that rally may not start until October. Sold long SPX (7/14/25) at 6268.56= gain of 2.90%; Long SPX on 6/25/25 at 6092.16.
(Click on image to enlarge)
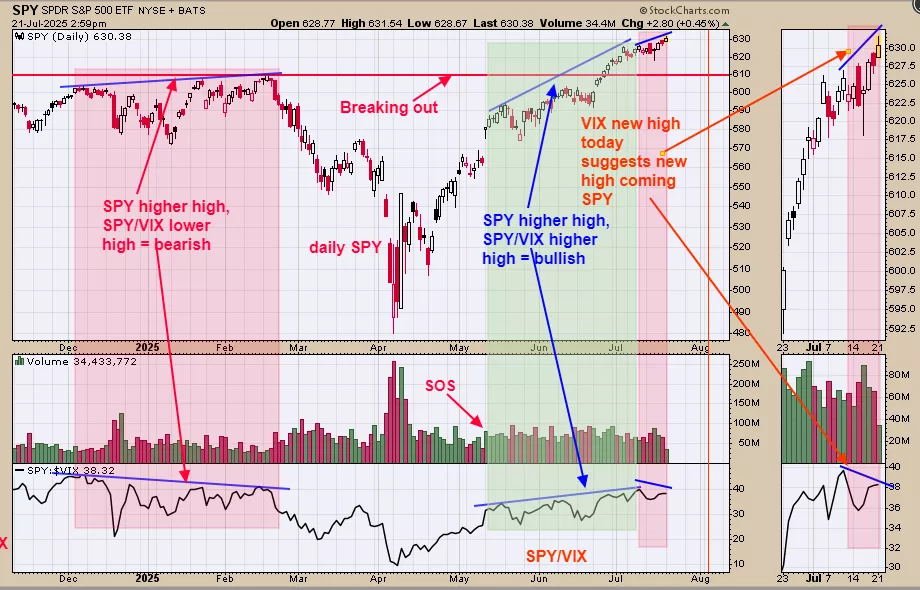
The bottom window is the SPY/VIX ratio. This ratio trades in the same direction of the SPY for a bullish divergence; and a bearish divergence is produced when the SPY/VIX trades in the opposite direction of the SPY. Over the last week the SPY pushed to new highs where the SPY7VIX ratio made lower highs and in turn produced a negative divergence (far right window shaded in pink).We dated the chart back to late 2024 and noted negative divergences in shaded pink and bullish divergences shaded in green. According to the SPY/VIX ratio the SPY is due for a pull back; support lies near 609 SPY range. Bigger trend remains bullish but may see a test of the breakout area near 609 level at least once if not more.
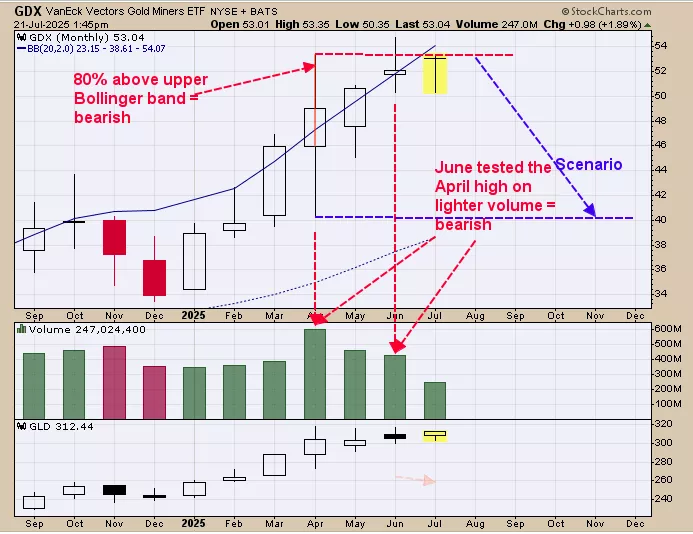
The top window is the monthly GDX and next lower window is the monthly volume for GDX. The month of April trading made a high near 53.00 and a low near 40.00.Current the high of April was tested in June on over 20% lighter volume and than closed below the April high suggesting a top was made. If a market can’t take out the previous high with volume it will reverse and attempt to take out the previous low. The previous low in this case is April low; which comes in near the 40.00 level. The GDX 40.00 level is our target for now.July trading so far has not changed our thinking and the GDX 40.00 range is still our target for the next low. Once the pull back is completed, new highs in GDX and XAU are expected.
More By This Author:
GDX: Longer Term Uptrend Intact
The Weekly Charts Are Bullish
Option Expiration Week Leans Bullish


Comments
Log in or sign up to join the conversation.