

Image Source: Pexels
SPX Monitoring purposes; Sold long 6/5/25 at 5936.30 = gain .033%; long SPX on 5/15/58 at 5916.93
Our gain 1/1/24 to 12/31/24 = 29.28%; SPX gain 23.67%
Our Gain 1/1/23 to 12/31/23 SPX= 28.12%; SPX gain 23.38%
Monitoring purposes GOLD:Sold long GDX 4/11/25 at 49.66 = gain 21.33%.
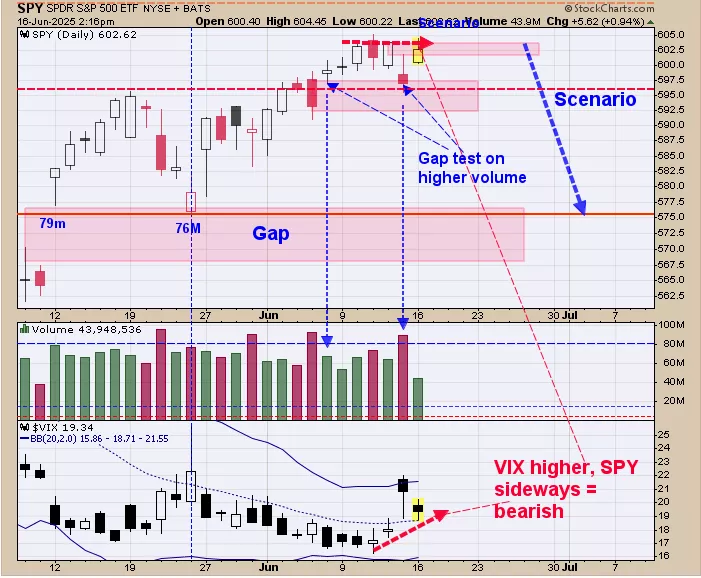
We ended up 29.28% for 2024; SPX up 23.67% for the year. There are VIX and Volume divergences for the SPY. The bottom window is the VIX which has made higher lows over the last four days where the SPY (more or less) has traded sideways which is a bearish divergence. Last Friday the SPY tested the gap that formed on June 6 on higher volume suggesting at some point the gap will be tested again (see chart above). This is option expiration week which leans bullish and market could hold up a short while longer. Thursday of this week is a holiday and markets are closed and therefore volume may decrease as traders take off for the holiday. Seasonality turns Bearish on Thursday adding to the bearish picture. Still neutral for now.
(Click on image to enlarge)
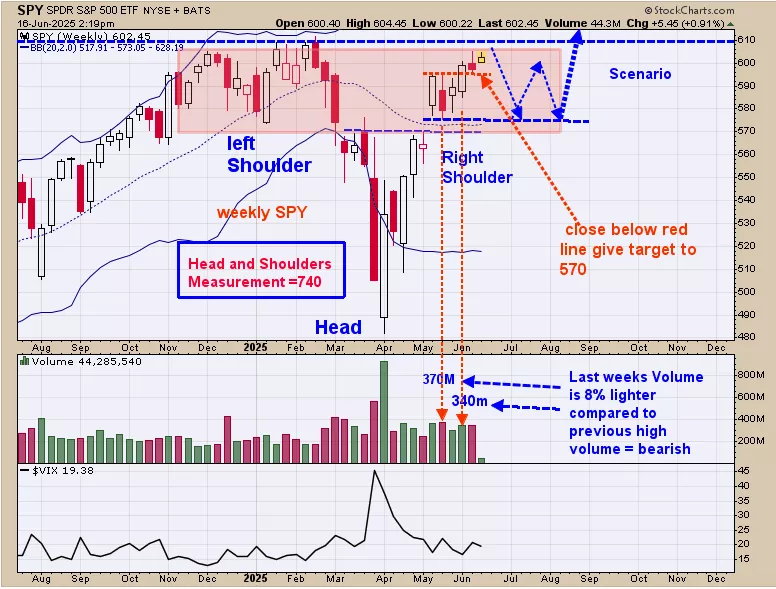
Above is the weekly SPY. The week of June 2, the SPY broke above its previous high May 19 on 8% lighter volume, suggesting a false break to the upside. If a market can’t break above a previous high on equal or greater volume, it will reverse and attempt to take out its previous low. The previous low in this case is near 575 SPY (the weekly May 19 low) and a possible down side target. A sell setup for a target near 575 on the SPY is possible this week. The pattern forming that started back in November 2024 appears to be a bullish Head and Shoulders pattern that has a measured target near 740 range which is over 23% higher than current levels.
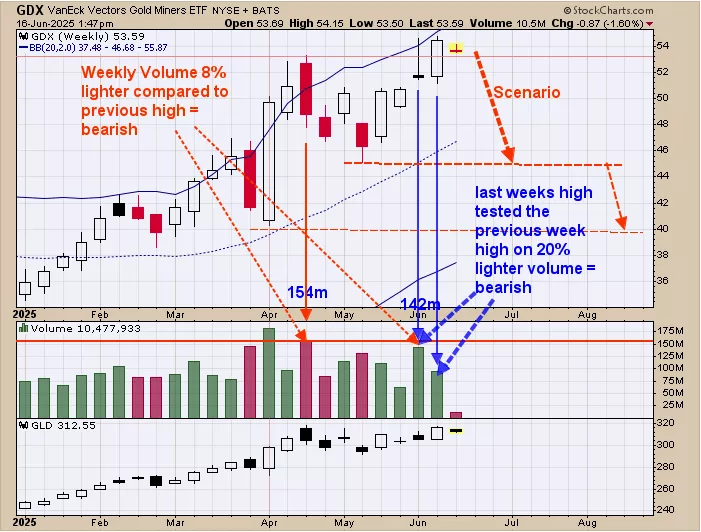
Above is the weekly GDX with it weekly volume. The June 2 week, GDX tested it previous weekly high of April 21 on 8% lighter volume suggesting the April 21 high (near 53.00) has resistance.If a market can’t take out its previous high on equal or higher volume, it will reverse and attempt to take out its previous low. The previous low in this example is the May 12 low near 45.00.If the weekly May 12 low is tested on equal or higher volume (suggesting there energy to push lower), GDX will head down to the next lower low which is the weekly April 7 low near 40.00.Adding to the bearish picture, last week high tested the previous week high on 20% lighter volume; showing the uptrend is weak (noted in blue in chart above).Pull back in GDX is still expected. First area of support comes in near 45.00 range; however we have evidence that the 40.00 range is where the next significant low may form. Bigger trend in GDX remains up but over the next several weeks a consolidation is possible.
More By This Author:
SPY May Pull Back
SPY Forming A Head And Shoulders Pattern
New High In The Stock Market


Comments
Log in or sign up to join the conversation.