

Image Source: Pexels
SPX Monitoring purposes; long SPX on 5/15/58 at 5916.93
Our gain 1/1/24 to 12/31/24 = 29.28%; SPX gain 23.67%
Our Gain 1/1/23 to 12/31/23 SPX= 28.12%; SPX gain 23.38%
Monitoring purposes GOLD:Sold long GDX 4/11/25 at 49.66 = gain 21.33%.
(Click on image to enlarge)
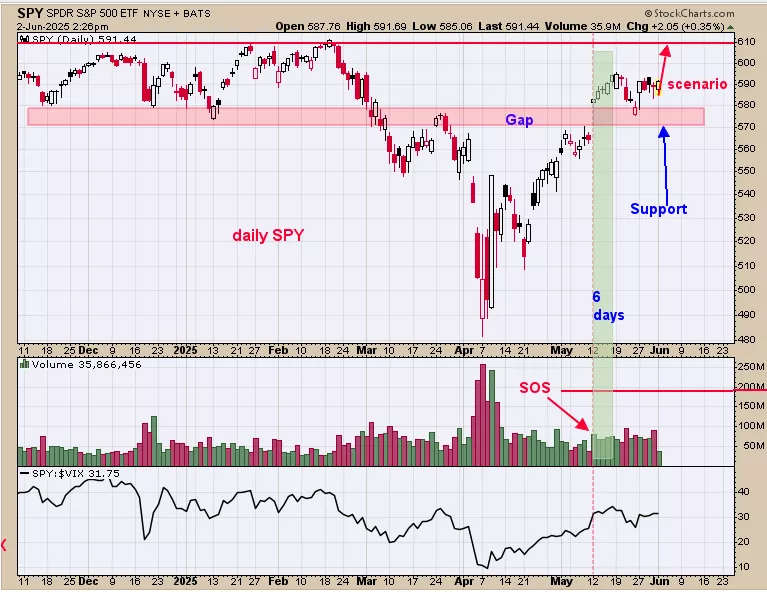
We ended up 29.28% for 2024; SPX up 23.67% for the year. The sixth best week of the year according to seasonality is May 24 to June 5 and we are in that timeframe now. Above is the daily SPY. SPY broke below the previous lows of 570 back in March and then closed above the 570 in mid May (shaded in light pink) with a “Sign of Strength” suggesting a breakout and now the 570 should act as support. When a market can’t hold below its previous lows it will attempt to take out it previous highs and in this case the previous highs is 610 range; the February highs. Most likely the next attempt at 610 may find resistance and therefore a place we may exit our long SPX.
(Click on image to enlarge)
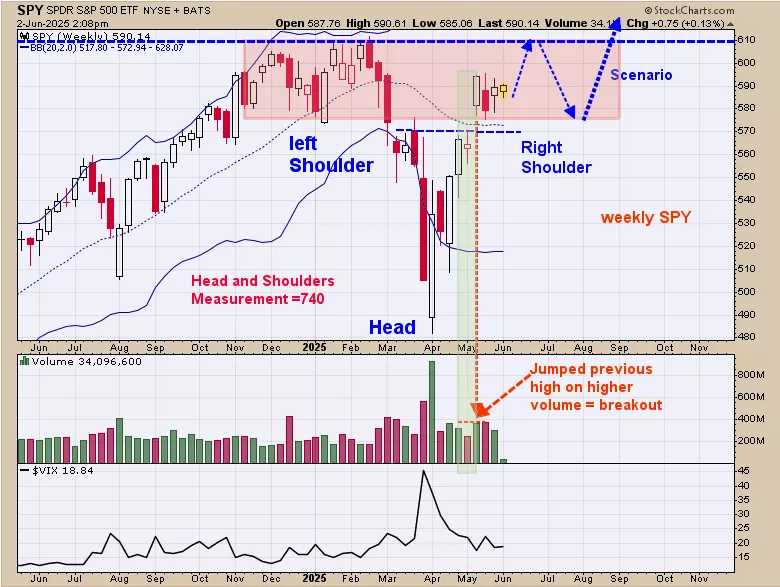
The weekly pattern that appears to be forming on SPY is a Head and Shoulders pattern.The Left Shoulder developed from December 2024 to January 2025; the Head formed at the April 2025 low and the Right Shoulder is starting now and may not complete until July or August. This potential Head and Shoulders pattern has a measured target near 740 on the SPY which is over 25% higher than current levels. Support comes in near 575 range which is where a gap lies and the week of March 24 high. Added to above is that the week of May 12 (shaded in light green) did have a “Sign of Strength” through the previous highs of early March and late April near 570 range suggesting strong support at the area.Long SPX on 5/15/25 at 5916.93.
(Click on image to enlarge)
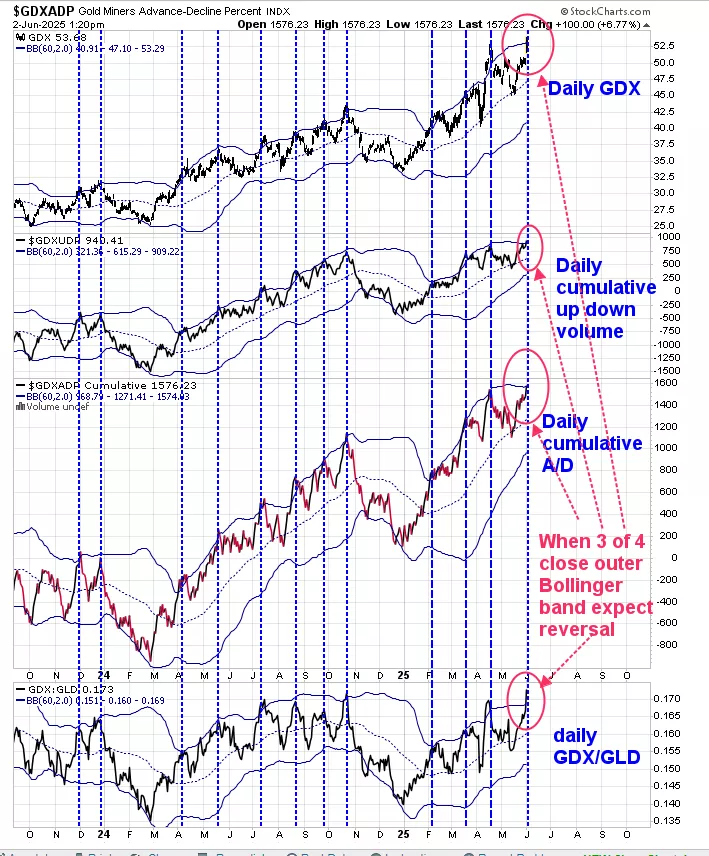
The bottom window is the GDX/GLD ratio; next up is the GDX Advance/decline; next higher is GDX up down volume and top window is the daily GDX. We put Bollinger bands on all four of these indexes.Short term consolidation in GDX can occur when at least 3 of the four indexes close above the upper Bollinger band (noted with blue dotted lines); currently we have all our indexes above the upper Bollinger bands.At the mid April high in GDX, we had three of the four indexes close above their upper Bollinger band.What this condition suggests is the GDX is making a double top near the 53.00 range.The evidence suggests a pull back is likely and possible target is still the 39.00 range on GDX.
More By This Author:
New High In The Stock Market
SPY Momentum Builds As RSI Approaches Key Level
Three Gap Play


Comments
Log in or sign up to join the conversation.