

Image Source: Pexels
SPX Monitoring purposes; long SPX on 5/15/58 at 5916.93
Our gain 1/1/24 to 12/31/24 = 29.28%; SPX gain 23.67%
Our Gain 1/1/23 to 12/31/23 SPX= 28.12%; SPX gain 23.38%
Monitoring purposes GOLD:Sold long GDX 4/11/25 at 49.66 = gain 21.33%.
(Click on image to enlarge)
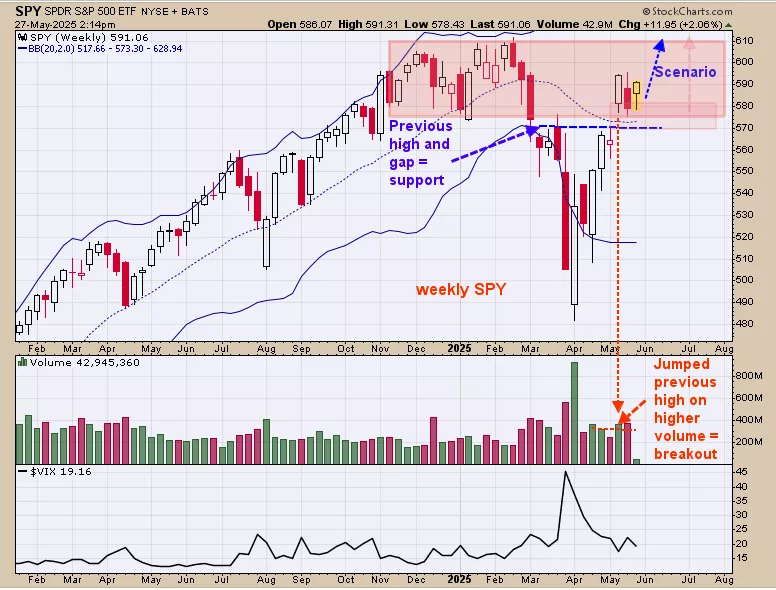
We ended up 29.28% for 2024; SPX up 23.67% for the year. SPY was up 6 days in a row going into last Monday; suggesting the market will be higher within five days 85% of the time (Check). The sixth best week of the year according to seasonality is May 24 to June 5; starts today. Above is the weekly SPY. SPY broke below the previous lows of 570 back in March and then closed above those lows in early May (shaded in light pink). When a market can’t hold below its previous lows it will attempt to take out it previous highs and in this case the previous highs is 610 range; which is our upside target for now.
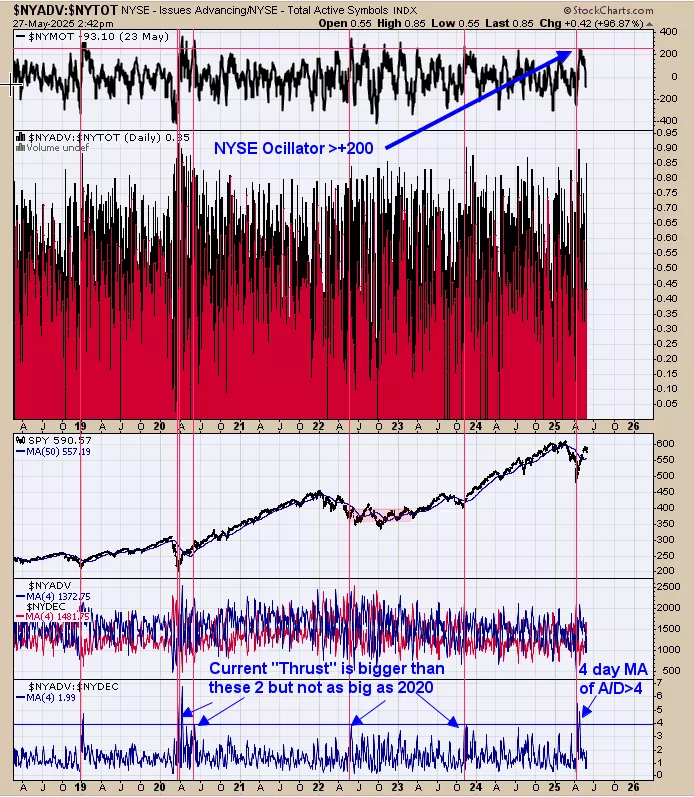
We updated this chart; commentary still applies, “The bottom window is the NYSE advancing issues/NYSE declining issues with a 4 period moving average. Reading at 4 and higher shows a “Thrust” of a bottom and new high in the market are suggested. These “Thrust” patterns suggests the rally will last a year or longer. Notice also the current “Thrust” is bigger than the last two (the one in 2022 and 2023) but not as big coming of the Covid crash of 2020. This condition suggests the current “Thrust” and rally will be stronger than 2022 and 2023 but not as strong as the rally off the of the 2020 Covid low.” Long SPX on 5/15/25 at 5916.93
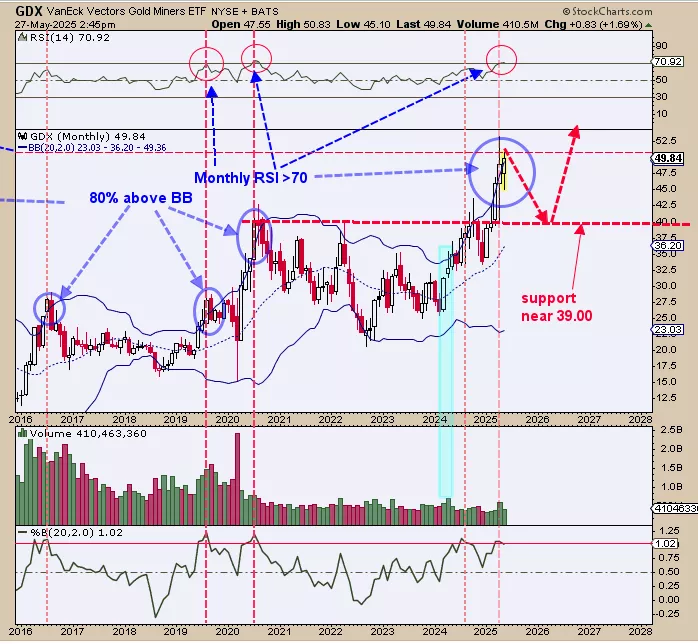
Above is the monthly GDX dating back to 2016 with the RSI in the top window. Monthly RSI reading above 70 have produced consolidation in GDX (noted with red dotted lines). Current monthly RSI stands at 70.92. We also circled in blue the times when the monthly GDX rallied 80% or move above its upper Bollinger band showing the market is extended and a bearish sign. In general the current pull back that started in mid April may continue possibly into the July 4 holiday. There is strong support near the previous highs of 39.00 range
More By This Author:
SPY Momentum Builds As RSI Approaches Key Level
Three Gap Play
Potential Pull Back


Comments
Log in or sign up to join the conversation.