
Potential Pull Back
SPX Monitoring purposes; Sold 4/9/25 at 5456.90= gain 9.52%;Long SPX 4/8/25 at 4982.77.
Our gain 1/1/24 to 12/31/24 = 29.28%; SPX gain 23.67%
Our Gain 1/1/23 to 12/31/23 SPX= 28.12%; SPX gain 23.38%
Monitoring purposes GOLD:Sold long GDX 4/11/25 at 49.66 = gain 21.33%.
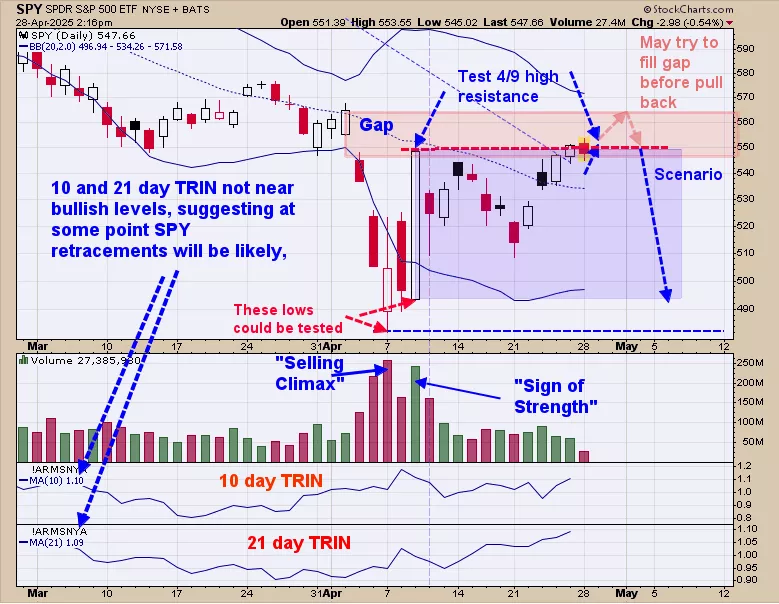
We ended up 29.28% for 2024; SPX up 23.67% for the year. The April 9 high is being tested and tested on lighter volume suggesting resistance. We noted in shaded pink where a gap lies and that gap could be filled before the potential pull back begins; though the gap doesn’t have to be filled it’s that it could be filled. If the SPY can’t get through the 4/9 high with equal or higher volume, it will reverse and attempt to take out the previous low which is also on April 9. The April 9 low comes in near 493 SPY. The low low is the April 7 low which comes in at 482 and may be tested before the next run higher starts (we will worry about that later once we get closer to that level). Intermediate term the SPY appears to be building a base especially with a ZBT trigger (see page two).
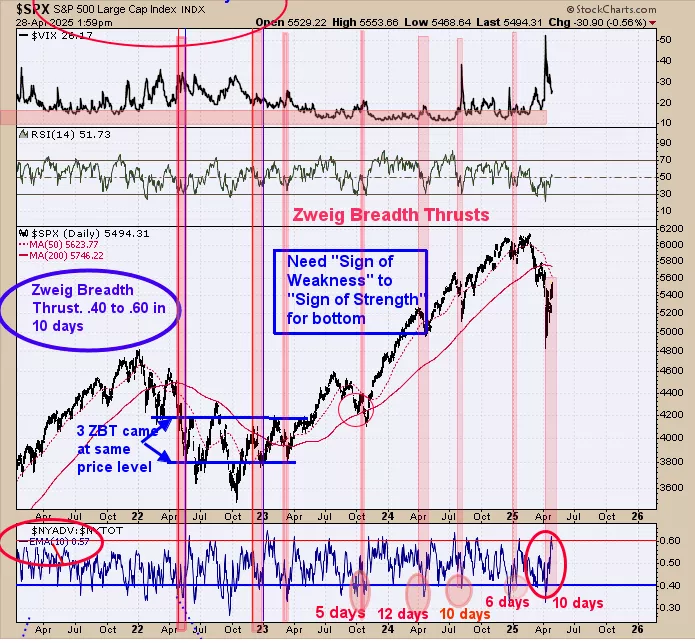
The bottom window is the chart above is the “Zweig Breadth Thrust indicator (ZBT). A ZBT is the NYSE Advancing issues/NYSE total issues with a 10 period moving average. A ZBT is triggered when this indicators reaches .40 or lower and than rallies to .60 or higher in 10 days or less. A ZBT was triggered last Thursday. We noted previous ZBT’s in shaded pink. It is said that a ZBT only shows up in bull markets. ZBT can trace back down where to where the pattern began if not bit lower (note the 2022 early 2023 bottom). A triggered ZBT suggests a bottom pattern has started.
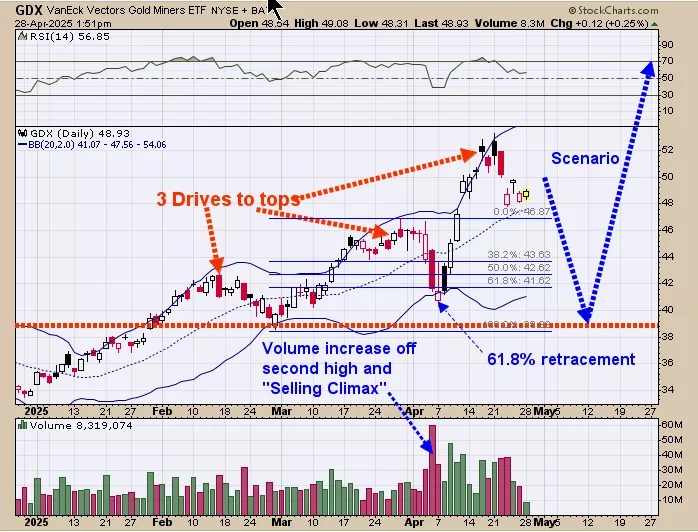
We updated this chart from last Thursday and last Thursday’s commentary still stands, “The “Three Drives to a top” appears to be working out.It is said that “Three Drives to a top” is not a topping pattern but rather a “Time out in an uptrend”. GDX gapped down yesterday and today’s trading is testing yesterday’s gap on much lighter volume suggesting the gap has resistance. This condition suggests the pull back will resume. This pattern has a downside target to where the pattern began which in the current case would have a price projection near 39.00.From the 39.00 range it would be expected for the next rally to begin from and most likely to new highs.We have presented chart studies over the last several months that a multi year rally is possible in the gold stocks.
More By This Author:
The Potential SPY Bounce Will Be Limited"Three Drive To Top"
A “Three Gap Play”
Signals are provided as general information only and are not investment recommendations. You are responsible for your own investment decisions. Past performance does not guarantee future performance. ...
more

