
SPX Monitoring purposes; Long SPX on 6/25/25 at 6092.16.
Our gain 1/1/24 to 12/31/24 = 29.28%; SPX gain 23.67%
Our Gain 1/1/23 to 12/31/23 SPX= 28.12%; SPX gain 23.38%
Monitoring purposes GOLD:Sold long GDX 4/11/25 at 49.66 = gain 21.33%.
(Click on image to enlarge)
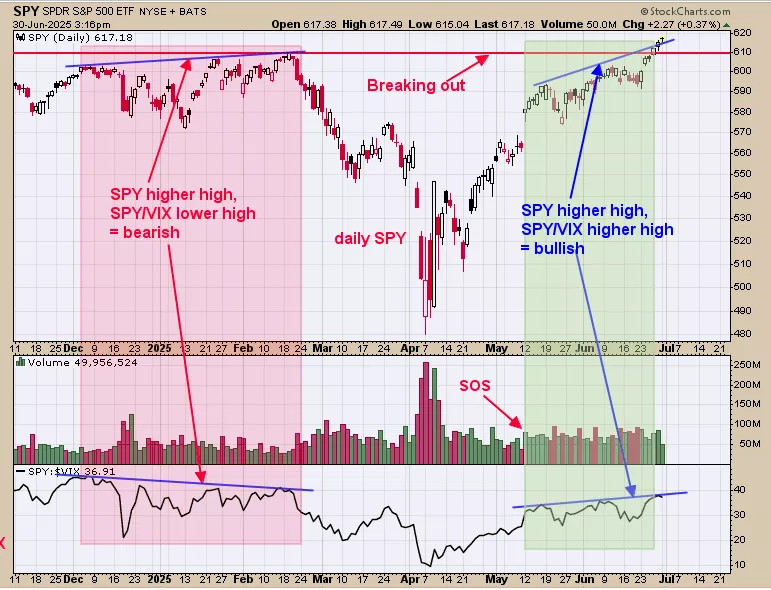
We ended up 29.28% for 2024; SPX up 23.67% for the year. Above is the SPY going back to November 2024 with the SPY/VIX ratio in the bottom window. It a bearish sign when the SPY makes higher highs while the SPY/VIX ratio makes lower high (noted in pink) and a bullish sign when the SPY makes higher highs while the SPY/VIX ratio makes higher highs (noted in shaded green). The current higher highs in the SPY and the SPY/VIX ratio suggest the current rally should continue. Also worth noting, today marks the 6 day up in a row, suggesting market will be higher within 5 days 80% of the time. Long SPX on 6/25/25 at 6092.16.
(Click on image to enlarge)
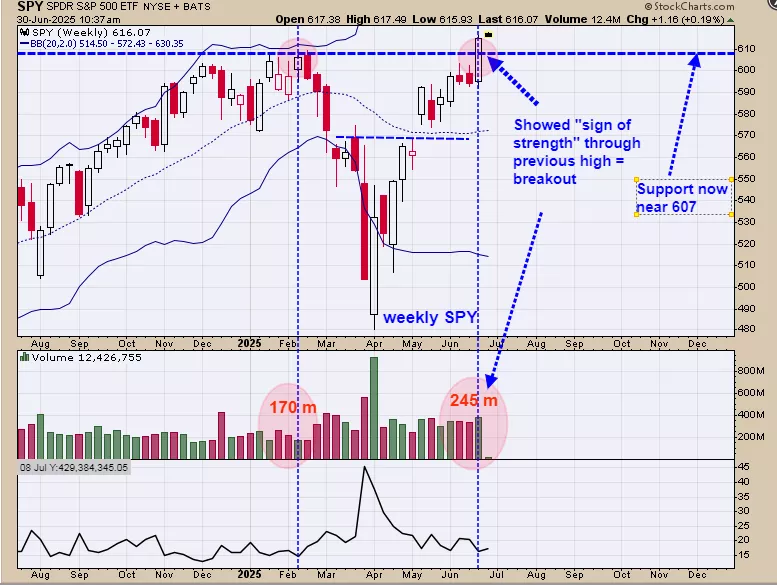
Above is the weekly SPY. Last week the SPY showed a “Sign of Strength” through the previous high of February suggesting a Breakout to the upside. The breakout level comes in near the 607 SPY level and that area should now act as support. The week charts are bullish and the breakout appears to be confirmed.
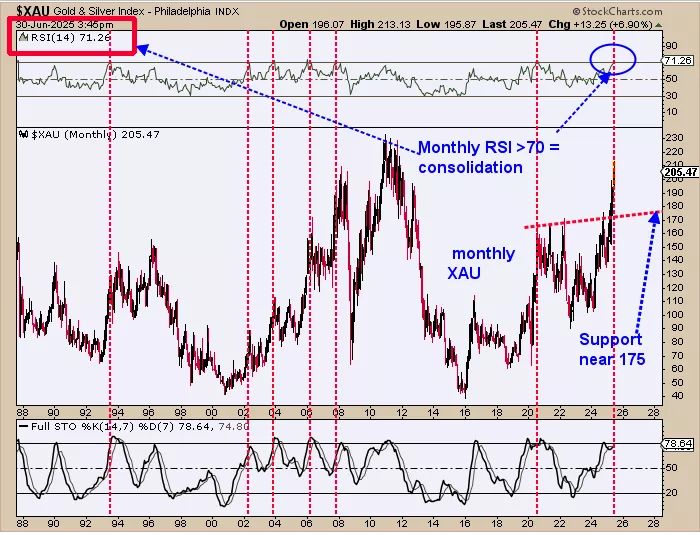
Updated this chart from last Thursday and the monthly RSI will close above +70 as month end is today; which in turn suggests that the XAU is near a high.Last week commentary still stands, “The chart above is the monthly XAU; going back to 1988 with its monthly RSI in the top window. Going back to 1988 (37 years) the monthly RSI reached above +70; 7 times (counter current example). The previous 6 times the monthly RSI reached +70, all examples started a multi month consolidation. The changes that XAU will not start a consolidation are 14% or put it another way, the changes that a consolidation will start is 86%.Strong support starts near 175 on the XAU which is about 15% lower than current levels.Longer term uptrend intact for the XAU but a consolidation is likely for the next several weeks if not longer.”
More By This Author:
Option Expiration Week Leans BullishSPY May Pull Back
SPY Forming A Head And Shoulders Pattern


Comments
Log in or sign up to join the conversation.