
SPY Support Levels And GDX Momentum Signal Ongoing Strength

Image Source: Pexels
SPX Monitoring purposes; sold 8/29/25 at 6460.26= gain .02%; Long SPX on 8/18/25 at 6449.15.
Our gain 1/1/24 to 12/31/24 = 29.28%; SPX gain 23.67%
Our Gain 1/1/23 to 12/31/23 SPX= 28.12%; SPX gain 23.38%
Monitoring purposes GOLD: Back to neutral.
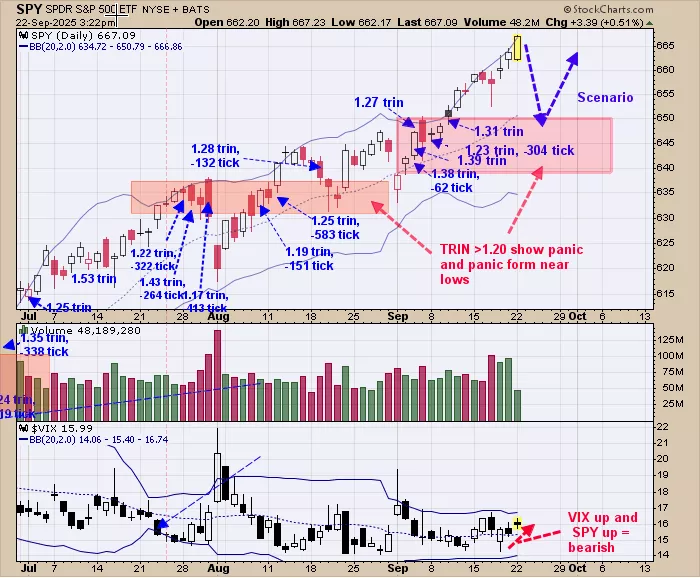
We shaded in light pink the times when the TRIN closed >1.20. Trin closes >1.20 show there is panic in the market and panic only forms near lows. The recent TRIN closes above 1.20 came between 640 to 650 SPY ranges and in turn suggests this area has support. Previously we where thinking that the February highs near 620 SPY range would be tested; the data now suggests that level may not be reached because there are panic region near 630 to 640 that appeared in mid July to mid August and a panic region near 640 to 650 that formed in early to mid September. SPX is showing strength and the next pull back may be mild and find support in the 650 to 640 range. The best strategy may be to buy the pull back that shows panic in the 650 to 640 SPY. Seasonality turns bearish starting tomorrow. SPY and VIX have been up 3 days in a row which is a bearish sign. Neutral SPX for now.
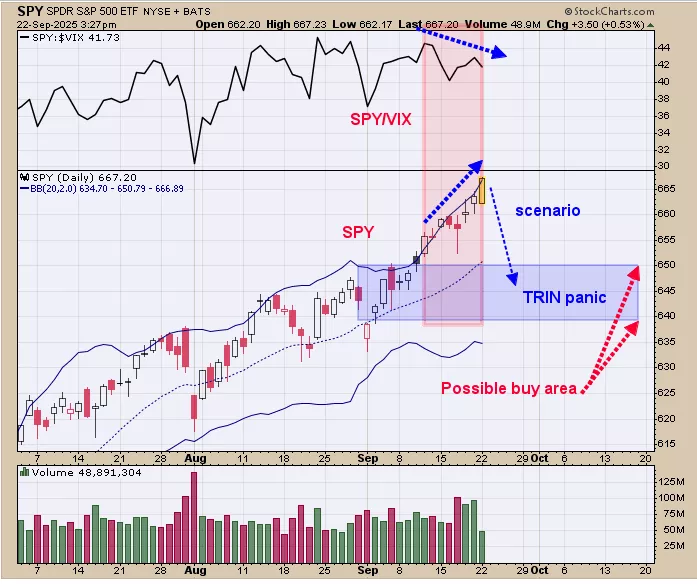
Over the last couple weeks the SPY has moved higher while the SPY/VIX ratio has moved lower (noted in shaded pink on the chart above) which is a negative divergence. The down side appears to be minimal as panic is present in the 650 to 640 range which in turns suggests this region has support. There are quite a few TRIN closes above 1.20 in the 650 to 640 range on the SPY which shows panic and in turn, support. Once panic forms near a price level, going back into the price level the panic should resurface and into turn suggest support again. We may end up with a bullish setup in the 650 to 640 range if panic reappears in the price zone.
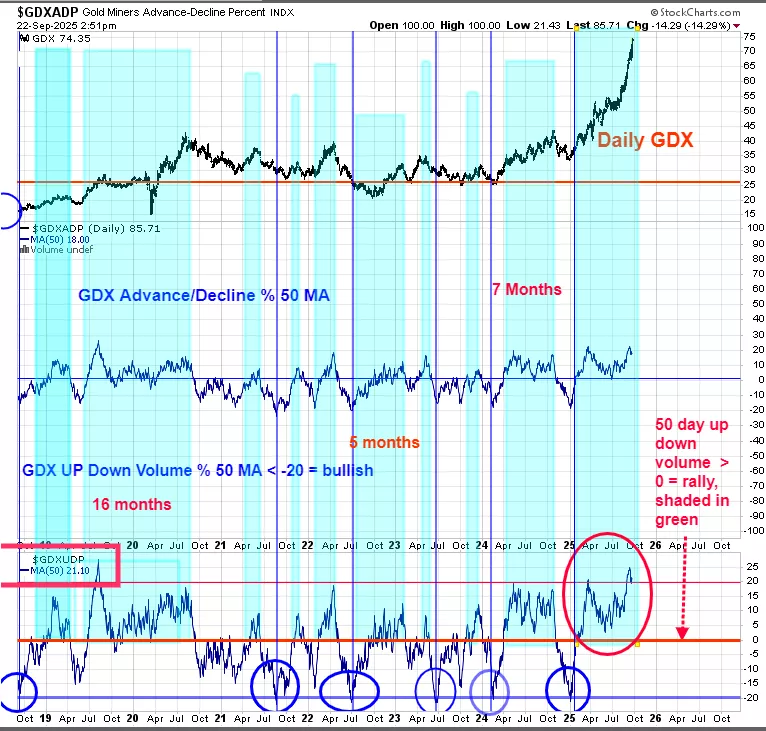
The bottom window is the 50 day average of the up down volume for GDX. This chart is a momentum chart for up down volume. This chart goes back to late 2018. We shaded in green the times when this indicator remained above “0” which is when GDX was in an uptrend. As long as the 50 day average of the up down volume remains above “0” the uptrend in GDX should continue. We circled in red when this indicator reached above “0” which was late January of this year. Currently this indicator is setting at +21 and at the highest point since 2019 and showing a strong market.
More By This Author:
SPX Support Strengthens, Gold Uptrend Holds
“Bearish Rising Wedge”
The Weakest Quarter
Signals are provided as general information only and are not investment recommendations. You are responsible for your own investment decisions. Past performance does not guarantee future performance. ...
more

