
SPX Monitoring purposes; sold 8/29/25 at 6460.26= gain .02%; Long SPX on 8/18/25 at 6449.15.
Our gain 1/1/24 to 12/31/24 = 29.28%; SPX gain 23.67%
Our Gain 1/1/23 to 12/31/23 SPX= 28.12%; SPX gain 23.38%
Monitoring purposes GOLD: Back to neutral.
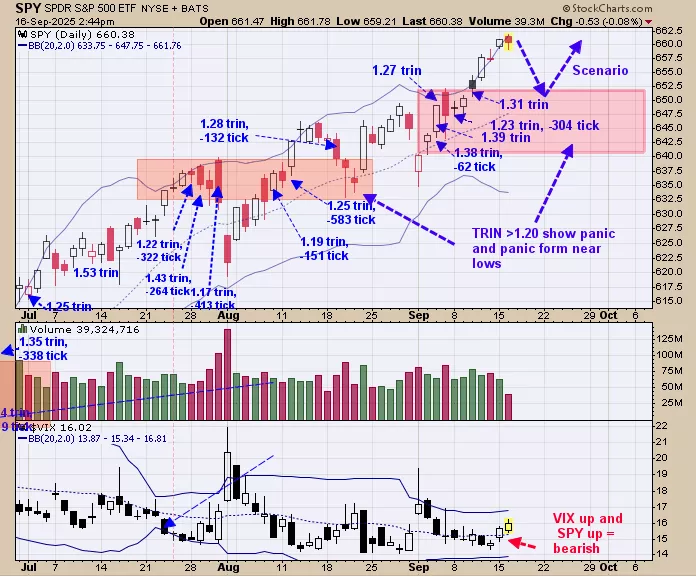
We shaded in light pink the times when the TRIN closed >1.20. Trin closes >1.20 show there is panic in the market and panic only forms near lows. The recent TRIN closes above 1.20 came between 640 to 650 ranges and in turn suggests this region is a support region. Previously we where thinking that the February highs near 620 SPY range would be tested; the data now suggests that level may not be reached because there are panic region near 630 to 640 that appeared in mid July to mid August and a panic region near 640 to 650 that formed in early to mid September. SPX is showing strength and the next pull back may be mild. The best strategy may be to buy the pull back that shows panic. Neutral SPX for now.
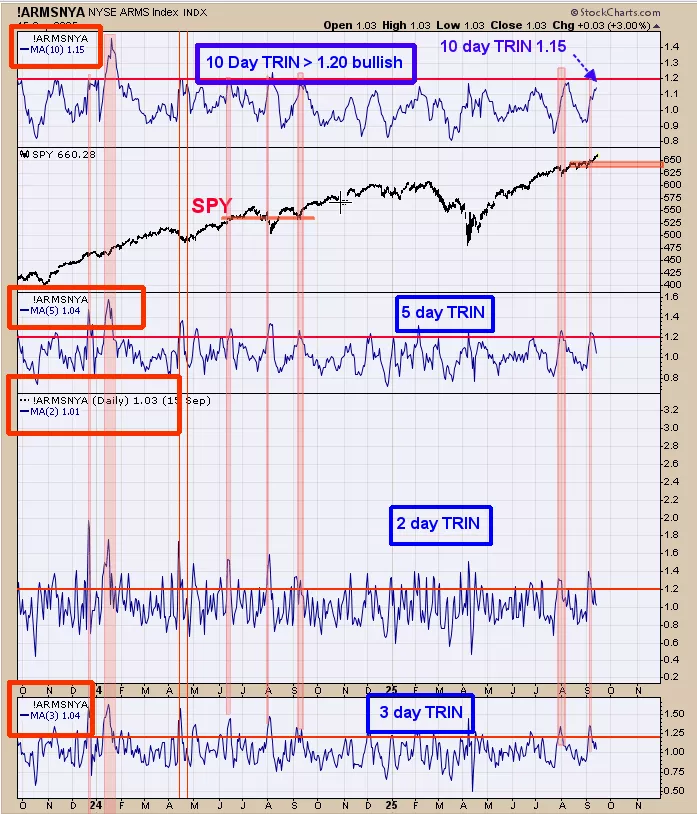
The top window is the 10 day TRIN; next lower window is the SPY dating back to 2023; next lower window is the 5 day TRIN; next lower is the 2 day trin and bottom window is the 3 day TRIN. Trin closes above 1.20 show panic in the market and panic only forms neat lows. The more days of panic in the market the more bullish the picture becomes and is the reason when the 10 day TRIN of 1.20 is more bullish than say a 5 day TRIN 1.20. The 10 day TRIN stands at 1.15 and near bullish levels. There are quite of TRIN closes above 1.20 near the 640 to 650 range on the SPY which suggests support and not far from current levels. Once panic forms near a price level, going back into the price level the panic should resurface and into turn suggest support again. We may end up with a bullish setup in the 650 to 640 range if panic reappears in the price zone.
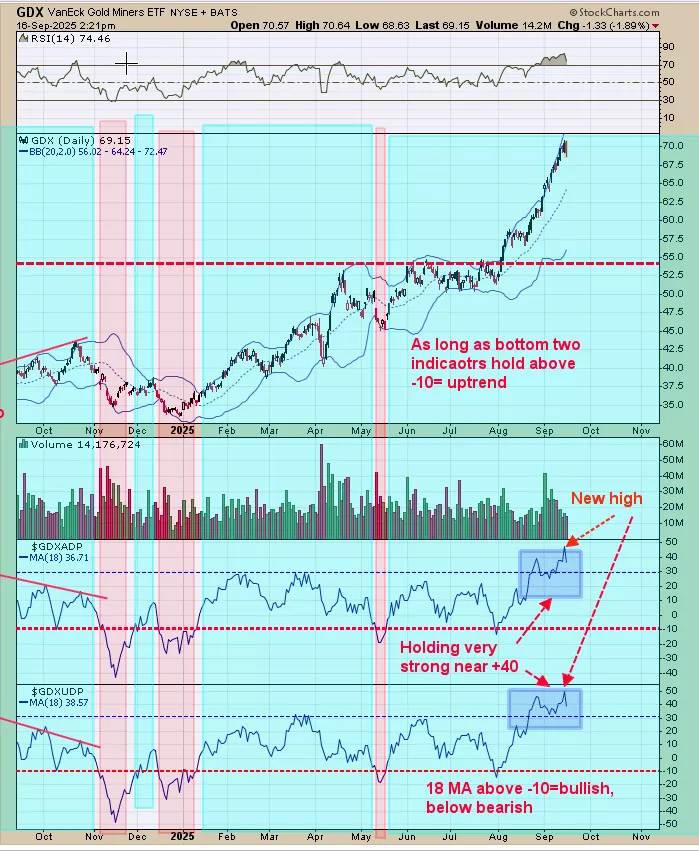
Short term trend remains up. Yesterday the bottom two indicators both closed above +40 which where at new highs (see chart above); showing strength and suggests the GDX uptrend should continue. Last weeks commentary still applies, “Momentum rules all indicators. Last week we showed momentum indicators on the cumulative advance decline and up down volume on the weekly and monthly time frame. The bottom window is the GDX 18 day average of the Up down volume percent and next higher window is the GDX Advance/decline percent (both momentum indicators). As long as both indicators remain above -10 the uptrend in GDX is in force (shaded in green). When both indicators are below -10, GDX is considered in a downtrend (Shaded in pink). Strong rallies in GDX occur when both indicators hold above +20; both indicators are above +30 right now. We do own gold stocks but we don’t have a long position in GDX as a good entry hasn’t been found. If we were long GDX at this point we don’t see a reason to get out.”
More By This Author:
“Bearish Rising Wedge”
The Weakest Quarter
Bigger Trend Remains Bullish


Comments
Log in or sign up to join the conversation.