
Market Pauses After Selloff; GDX Holds Uptrend Amid Consolidation
SPX Monitoring purposes; sold long 10/2/25 at 6715.35 = gain .4%; Long SPX on 9/30/25 at 6688.64.
Our gain 1/1/24 to 12/31/24 = 29.28%; SPX gain 23.67%
Our Gain 1/1/23 to 12/31/23 SPX= 28.12%; SPX gain 23.38% Monitoring purposes GOLD: Long GDX at 75.76; 9/29/25
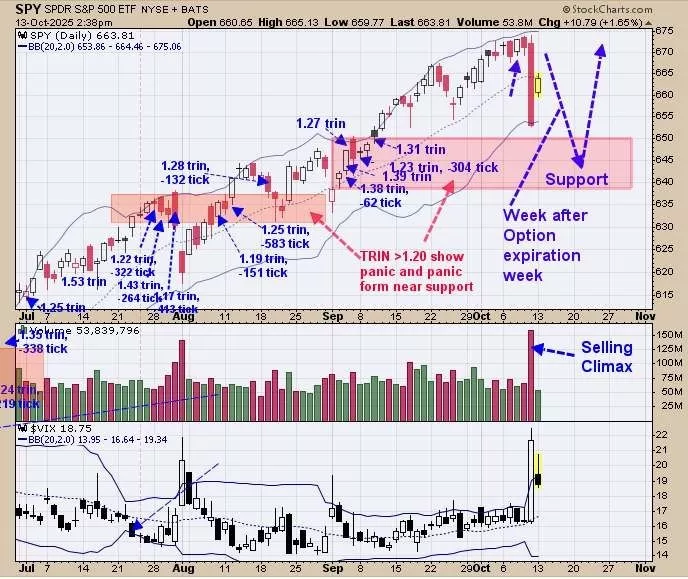
Friday the market fell by 2.71%. Declines over 2% usually come in clusters; suggesting another decline is coming. This is option expiration week which usually leans bullish suggesting this week may be an up week. The week after option expiration week the market usually declines, and may be the time where the next 2% or larger pull back begins. We noted on the chart above shaded in pink where panic formed in the TRIN closes and panic only forms near lows suggesting this shaded pink area is support. Last Friday produced a “Selling Climax” day (volume doubles from the previous days trading) which suggests exhaustion, ending the decline. Support comes in the 650 range on the SPY and an area where the next buy signal may develop. If market pushes near last Friday’s high this week, we could issue a sell signal for a trade down to 650 range. Keeping our powder dry for now. Sold long SPX on 10/2/25 at 6715.35 = gain .4%.
The bottom window is the 21 day average of the Equity put call ratio, next higher window is the 10 day average and next higher window is the 5 day average. All 3 moving averages of the equity put call ratio has moved into bearish levels suggesting the market is at a high. Chart above goes back near three years and we noted times when all three moving average for the equity put call ratio reached bearish levels with a dotted red line. In some cases when bearish levels where reached the market did move up but very modestly suggesting upside here is limited. This week is option expiration week which leans bullish and market may hold today’s gain through this week. The week after option expiration week normally declines and this is where the Equity put/call signal is forecasting
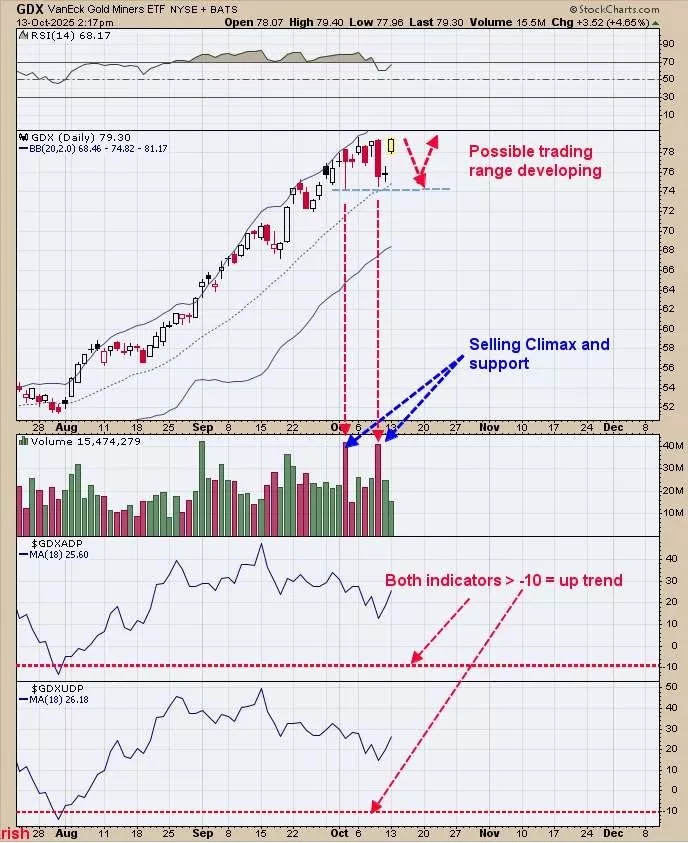
Long term trend in GDX remains up. Short term a possible trading range may be developing. October 2 and 9, GDX developed “Selling Climaxes” (noted on chart) at the same price level near 74.00. “Selling Climax’s” are exhaustion moves to the downside and normally end the decline. Most “Selling Climax’s” are tested and are support levels. Today GDX rallied off support and is not testing the high of the last two “Selling Climaxes” high which comes in near 80.00 range and is also a resistance area. Most likely a trading range is developing with support near 74.00 and resistance near 80.00 creating a consolidation pattern. Bigger trend remains up and higher highs will be seen once the current consolidation runs its course. Long GDX on 9/29/25 at 75.76.
More By This Author:
Market Near Highs; Holding Cash, Bullish on Gold
SPY Support Levels And GDX Momentum Signal Ongoing Strength
SPX Support Strengthens, Gold Uptrend Holds
Signals are provided as general information only and are not investment recommendations. You are responsible for your own investment decisions. Past performance does not guarantee future performance. ...
more

