


SPX Monitoring purposes; Long SPX on 4/8/26 at 6782.81.
Our gain 1/1/24 to 12/31/24 = 29.28%; SPX gain 23.67%
Our Gain 1/1/23 to 12/31/23 SPX= 28.12%; SPX gain 23.38%
Monitoring purposes GOLD: Long GDX at 75.76; 9/29/25
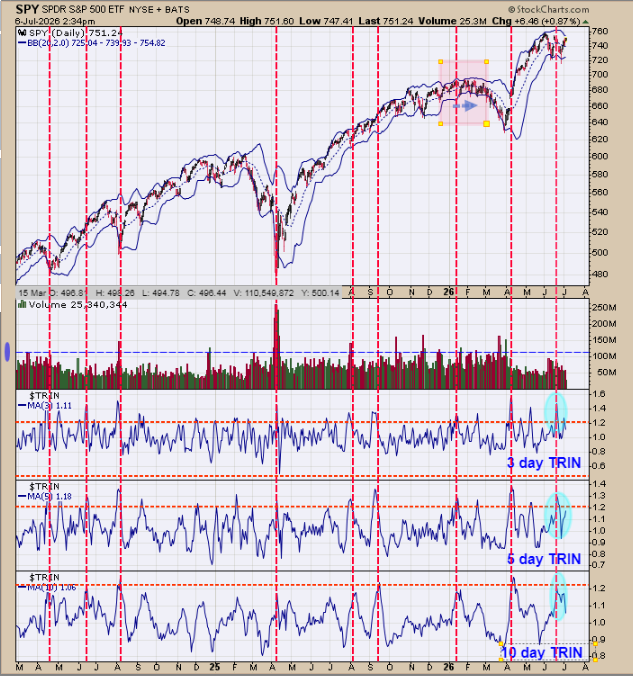
Chart above goes back about three years. We noted with red dotted lines the times when the 10, 5 and 3 day TRIN reached 1.20 or higher at the same time. Going back three years, this condition happened nine times, and of the nine times 8 times the market rallied for at least another month. The one time that the market did not respond was back in January, when it flipped sideways for several weeks. In simpler terms, the market has an 89% chance of moving higher short-term.
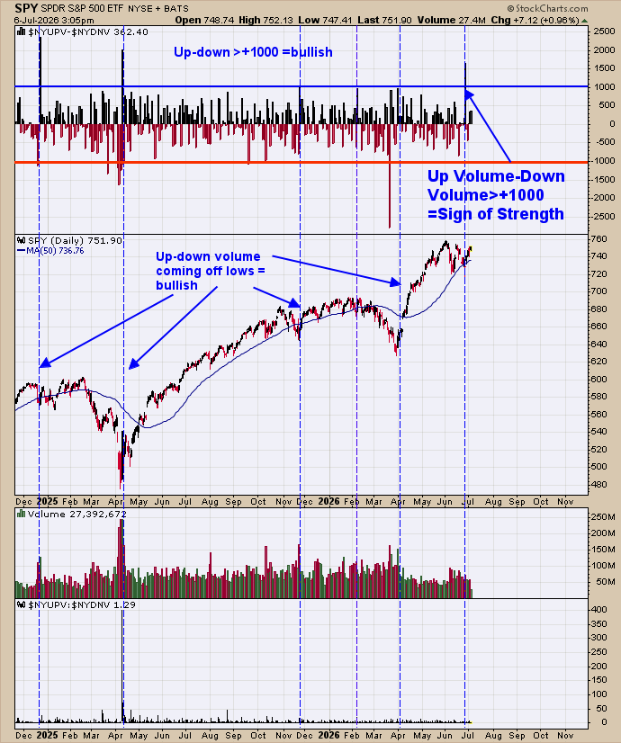
We posted this a few reports back, and it appears to be working out. “We may have “liftoff”. The top window is the NYSE up volume minus NYSE down volume. When this indicator reaches +1000 or higher on the close; it’s been a good indication that a rally is starting. This indicator closed at +1651 on June 26, the day of the last low. We noted previous instances with a blue dotted line. Next rally phase is near starting or has started.”
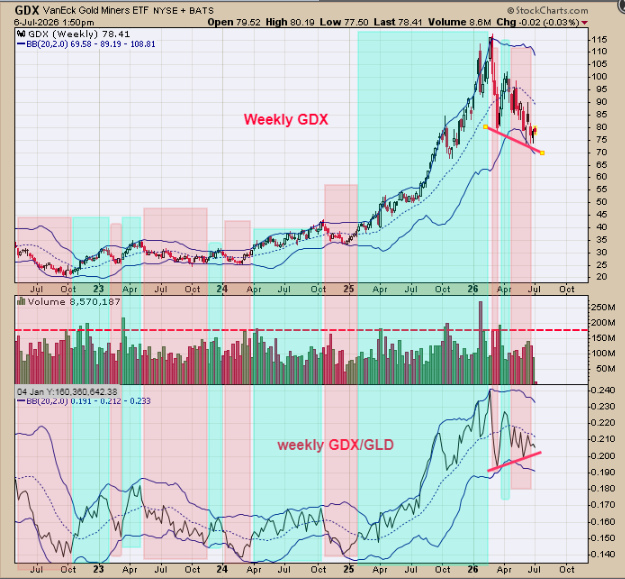
There is positive divergence present. Looking form March to July of 2026, notice that the weekly GDX/GLD ratio has made higher lows while the GDX has made lower lows (red lines) suggesting a bullish outcome is likely. The GDX/GLD ratio leads GDX. When the weekly ratio is above its mid Bollinger band it produces an uptrend in GDX (shaded in green). When the weekly ratio is below its mid Bollinger band it produces a downtrend in GDX (shaded in pink). Though currently the weekly GDX/GLD ratio is still below its mid Bollinger band a bullish divergence is present. Seasonality has turned bullish into August and we are looking for signs for the uptrend to begin near current levels. Long GDX 9/29/25 at 75.76.



Comments
Log in or sign up to join the conversation.