


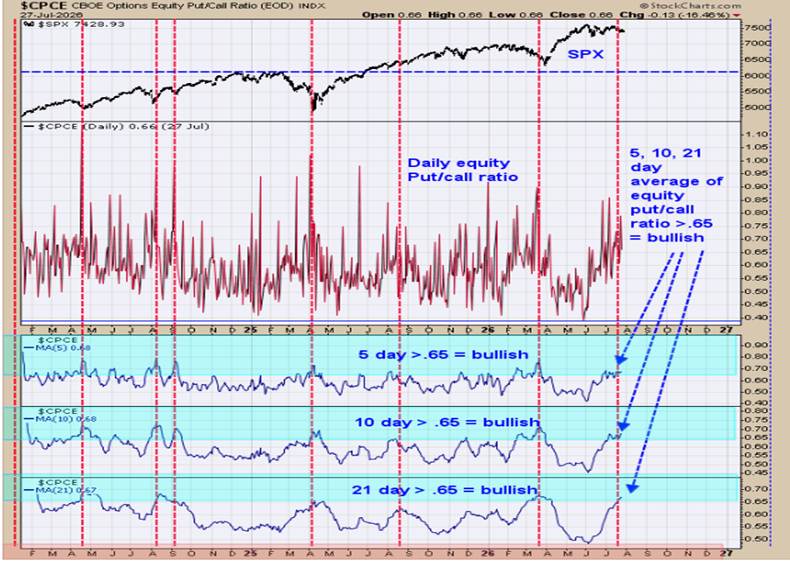
The chart above has been updated. Sentiment remains bullish; should see a bounce in the market shortly. The bottom window is the 21 day average of the equity put/call ratio (current reading is .67); next higher window is the 10 day average (current reading is .68); next higher window is the 5 day average (current reading is .68). I noted with red dotted lines the times when all three moving averages of the equity put/call ratio reached .65 and higher. In call cases, the market was near or at a low. Listen to us on TFNN.com on Tuesday and Thursday at 3:30 Eastern
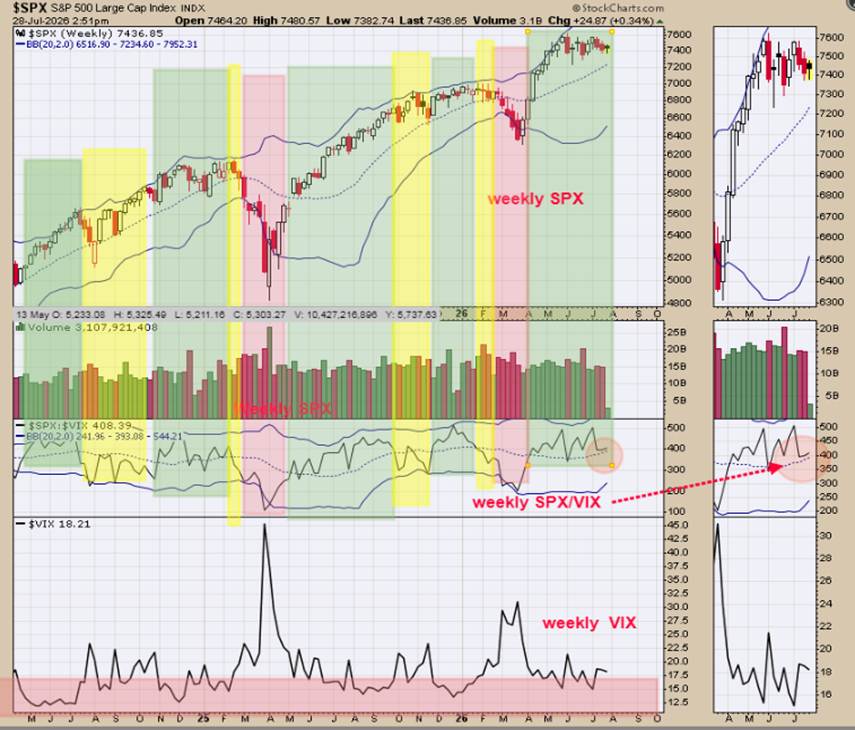
We updated this chart from yesterday. Above is a trend-following method for the weekly SPX. The top window is the weekly SPX, and the middle window is the weekly SPX/VIX ratio. The SPX/VIX ratio leads the SPX and is usually the first to turn down before the SPX turns down. We shaded in green the times when both the weekly SPX and weekly SPX/VIX ratio are above their mid Bollinger band, which suggests the uptrend in the SPX is intact. We shaded in yellow the times when the weekly SPX is above its mid Bollinger band and the weekly SPX/VIX ratio is below its mid Bollinger band; suggests a warning that the SPX could turn down. We shaded in pink when the weekly SPX and weekly SPX/VIX ratio are both below their mid Bollinger bands, suggesting a downtrend in the SPX. The weekly SPX remains above its mid Bollinger band, and today the weekly SPX/VIX ratio rallied above its mid Bollinger band while being below it yesterday. The uptrend in SPX is intact for now. Put/call ratio (page one) suggests a bounce is coming.
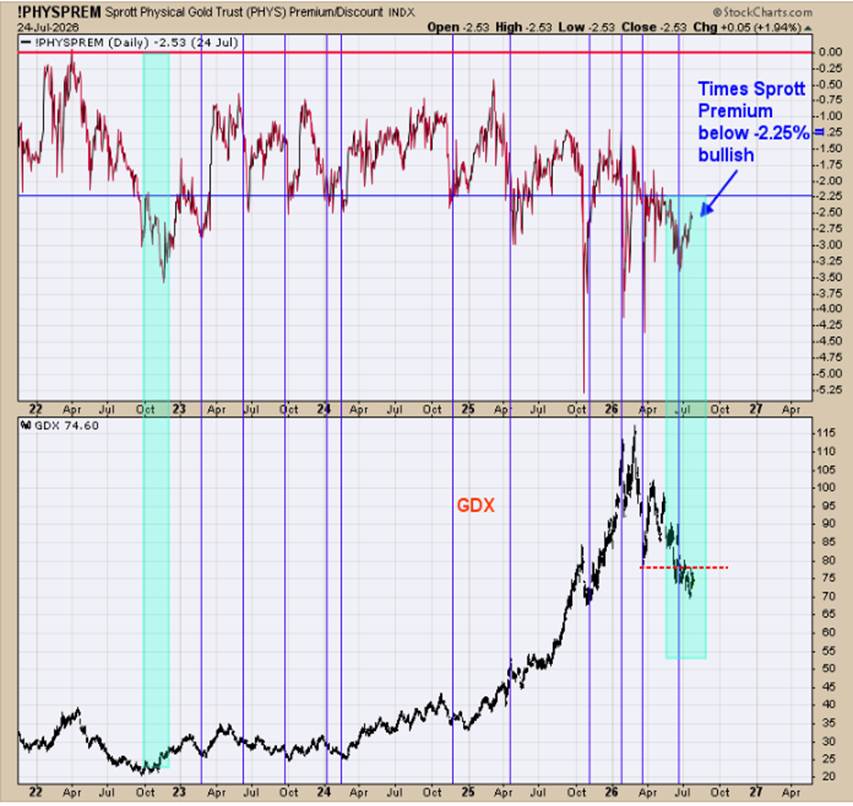
We have shown this chart in the past, which is the Sprott Physical Gold Trust (PHYS) premium/discount (top window) and GDX bottom window. When the Sprott Physical Gold Trust sells at a 2.25% or lower discount to the net asset value (NAV), then GDX is near a low. We noted this with blue lines and shaded green when the discount was 2.25% or less. Currently, the discount has remained below 2.25% for over two months (shaded in green), and the last time the discount remained below 2.25% for that length of time came in late 2022 (shaded in green), and that low marked the beginning of a GDX rally that lasted in January 2026. According to the Sprott Physical Gold Trust, a discount of 2.25% or lower suggests GDX is at a low. The discount of 2.25% has lasted over two months, just like the low back in late 2022, which could mean a multi-year rally in GDX is possible. Long GDX 9/29/25 at 75.76.



Comments
Log in or sign up to join the conversation.