


SPX Monitoring purposes; Long SPX on 4/8/26 at 6782.81.
Our gain 1/1/24 to 12/31/24 = 29.28%; SPX gain 23.67%
Our Gain 1/1/23 to 12/31/23 SPX= 28.12%; SPX gain 23.38%
Monitoring purposes GOLD: Long GDX at 75.76; 9/29/25
We have "800" phone update that cost $6.00 per call, and billed to a credit card. Call (1-970-586-4760) for sign up. We update Eastern Time at 9:45 and 4:10.
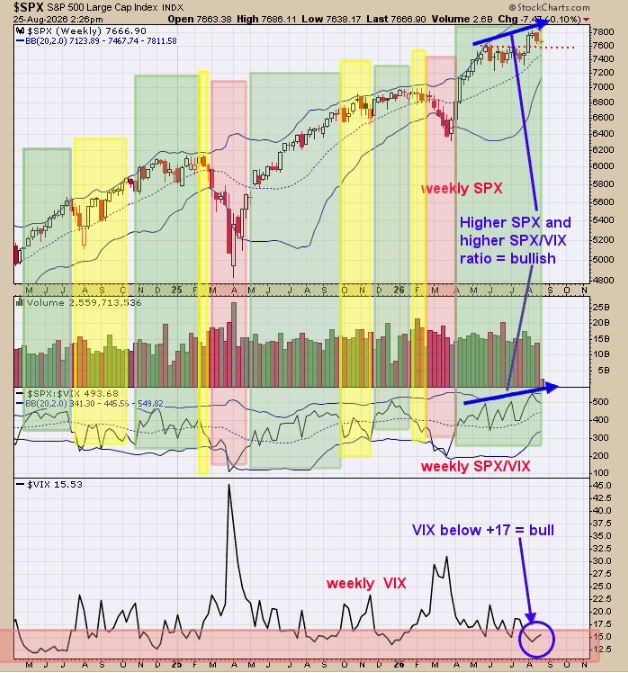
The trend following method that we develop remains bullish. The top window is the weekly SPX; next lower window is the weekly SPX/VIX ratio and bottom window is the weekly VIX. We shaded in green when both the weekly SPX and SPX/VIX ratio are above their mid Bollinger bands showing the trend is up. We shaded in yellow when the weekly SPX/VIX ratio is below its mid Bollinger band and SPX is above its mid Bollinger band (a warning sign) but trend remains up until the SPX falls below its mid Bollinger. We shaded in pink when the weekly SPX and weekly SPX/VIX ratio are below their mid Bollinger band, showing a downtrend in the SPX. We are in the shaded green phase now showing an uptrend in the SPX Staying long the SPX.
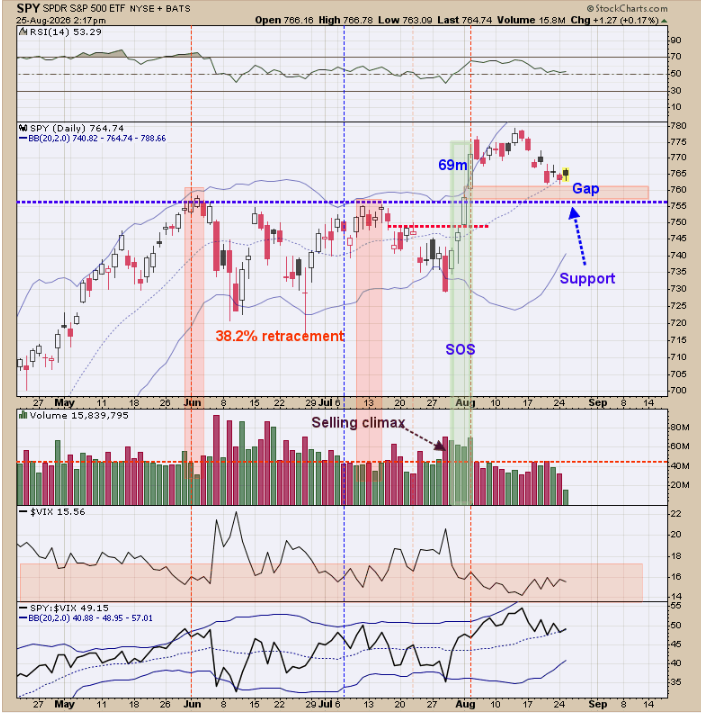
Seasonality is neutral this week, and turns back to bullish next week. Most likely this week will be a basing week. We noted an “SOS” (sign of strength) back in early August. On the break above the June and July highs near the 755 SPY, a gap formed with 69 million shares traded. Most likely that gap will be tested before the rally in SPY resumes. A test of the gap on 10% lighter volume (which would be volume near 62 million shares or less) would be a bullish sign. Current volume over the last several weeks has run near 40 million, so its likely that volume will be near 40 million shares on the test of the gap and in turn a bullish setup for the next rally to begin from.
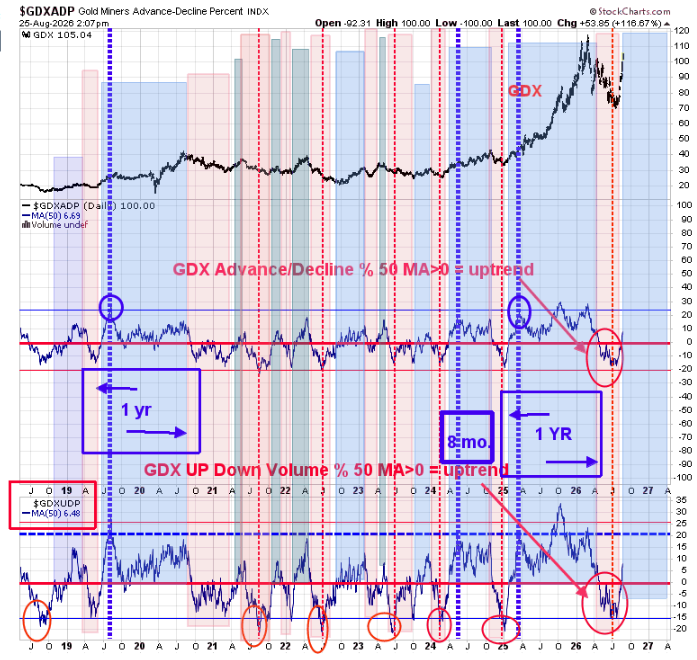
The bottom window is the 50 day average of the up down volume for GDX. Reading above “0” show that GDX is in an uptrend (shaded in blue) and readings below “0” and down trend (shaded in pink). Current reading on this indicator is +6.48 showing that GDX is in an uptrend. There is another important aspect on this chart. When this indicator is coming off a low, its ideal for it to reach +20 or higher (showing initiation of an uptrend); suggesting a strong uptrend is beginning. We noted past examples of the 50 day average of the up down volume reaching +20 coming off a low with blue dotted lines; the last three times the rally lasted form 8 months to 1 year. Like to see the current rally continue and push the 50 day average of the up down volume to reach +20 or higher. Long GDX 9/29/25 at 75.76.



Comments
Log in or sign up to join the conversation.