


SPX Monitoring purposes; Long SPX on 4/8/26 at 6782.81.
Our gain 1/1/24 to 12/31/24 = 29.28%; SPX gain 23.67%
Our Gain 1/1/23 to 12/31/23 SPX= 28.12%; SPX gain 23.38%
Monitoring purposes, GOLD: Long GDX at 75.76; 9/29/25
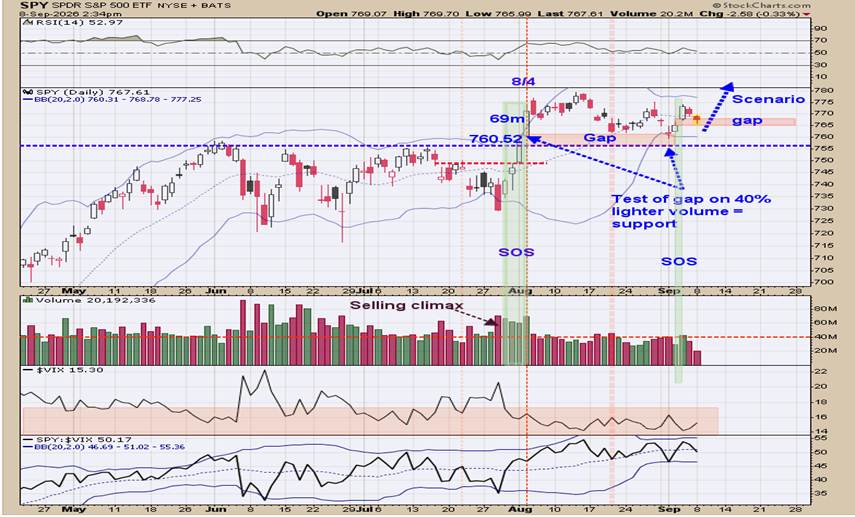
A gap formed on 9/3 at 765 on the SPY with a volume of 43 million shares. A gap test on 10% lighter volume suggests the gap has support. The gap test came today at 36 million shares, which is 17% less volume, which suggests this gap has support. Last week's rally off the June and July highs near 755 on the SPY came with a “Sign of Strength,” confirming another rally has started and that this rally may see new highs. The TRIN closed Friday at 1.34, which shows panic, and the tick closed today at -902, which also shows panic, and panic only forms near lows. Seasonality runs bullish into September 19.
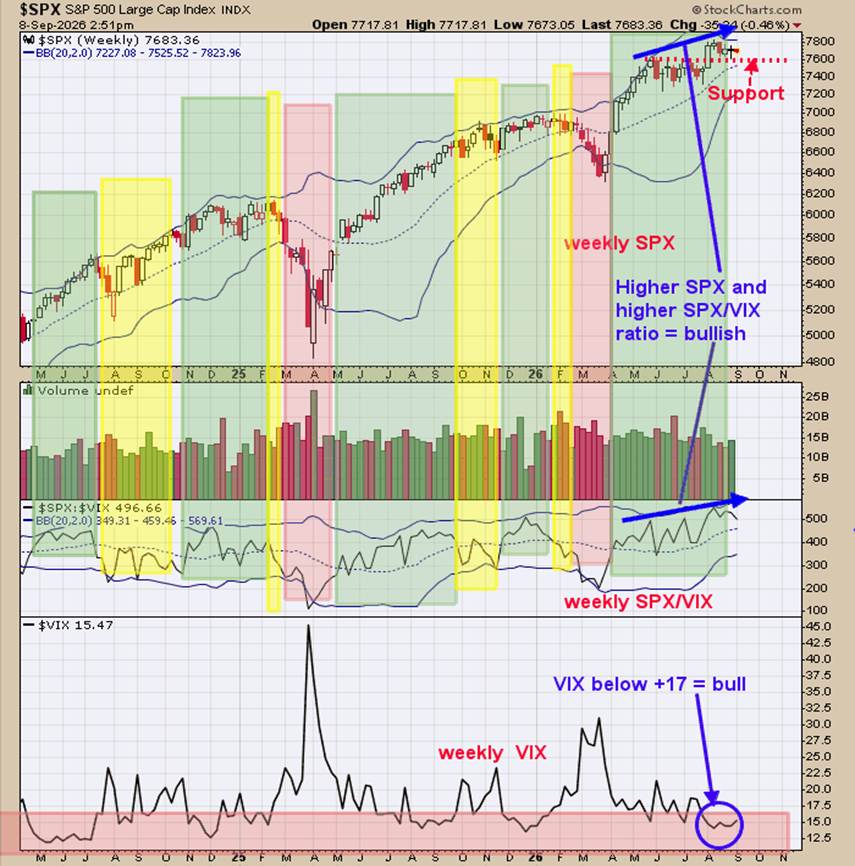
We updated our trend-following method for the SPX from last week. The bottom window is the weekly VIX; a reading below +17 suggests an uptrending market; the current reading is +15.47. The top window is the weekly SPX with its Bollinger band, and the next lower window is the weekly SPX/VIX ratio with its Bollinger band. Both the weekly SPX and weekly SPX/VIX ratio are above their mid Bollinger band, suggesting an uptrend is in progress (shaded in green). The weekly uptrend is intact.
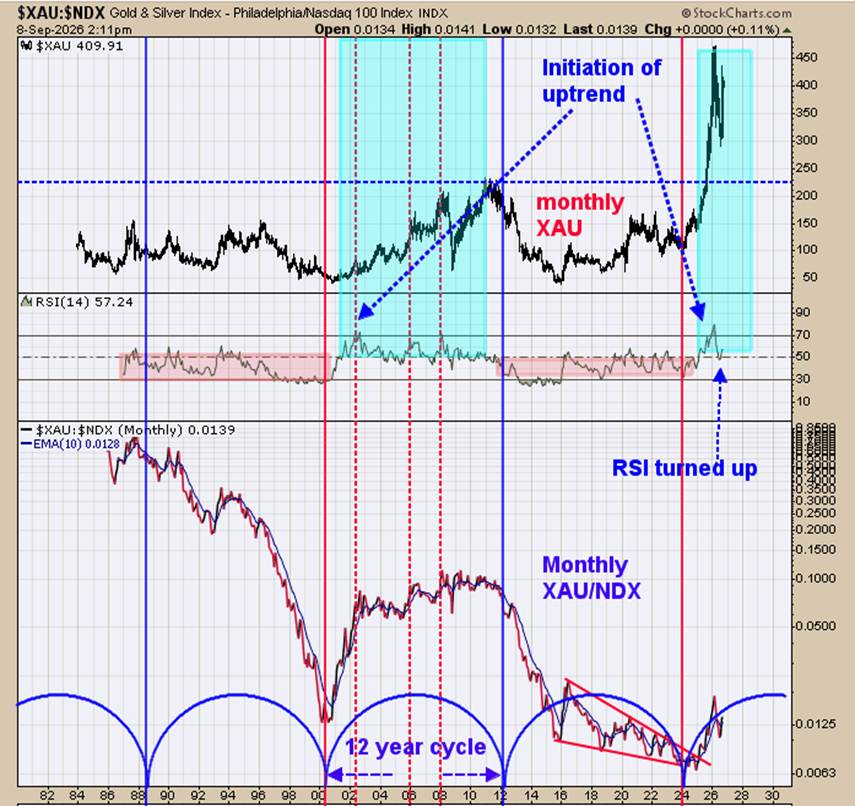
Gold stocks (XAU) may outperform Nasdaq stocks (NDX) for the next 10 years. The bottom window is the monthly XAU/NDX ratio, and the next window higher is the monthly RSI for this ratio. When this ratio is rising, then XAU is outperforming NDX, and when this ratio is declining, then NDX is outperforming XAU. This ratio turned up in early 2024 and pushed the RSI over +70 in 2026. The last time this ratio RSI reached +70 came in early 2002, and that was the start of a massive gold stock rally that lasted to 2012. A “Sign of Strength” (SOS) is needed off a bottom to start a longer-term rally, and the RSI helps to identify the SOS. A major low in XAU came in 2024, and the RSI got pushed to +70 in 2026, triggering the initiation of an uptrend for the next 10 years for gold stocks. What this chart suggests is that gold stocks will outperform Nasdaq stocks over the next 12 years (starting in 2024), just like it did back in 2000. Long GDX 9/29/25 at 75.76.



Comments
Log in or sign up to join the conversation.