


SPX Monitoring purposes; Long SPX on 4/8/26 at 6782.81.
Our gain 1/1/24 to 12/31/24 = 29.28%; SPX gain 23.67%
Our Gain 1/1/23 to 12/31/23 SPX= 28.12%; SPX gain 23.38%
Monitoring purposes GOLD: Long GDX at 75.76; 9/29/25
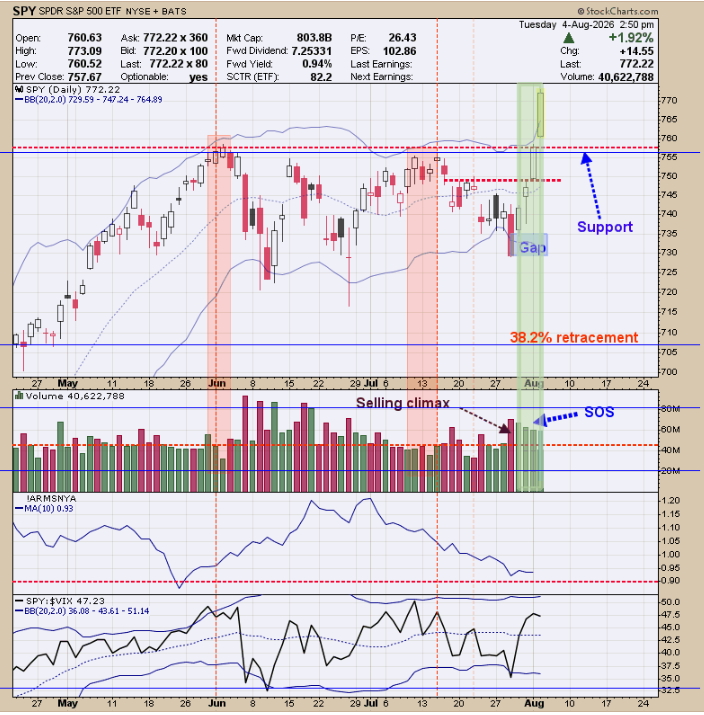
Volume has jumped near 20% the last four days compared to the previous week volume, which is a “Sigh of Strength” (shaded in green) and a bullish intermediate-term sign. Today the SPY jumped above the previous highs of June and July with higher volume, suggesting a valid break to the upside. Support now lies at the previous high near 757 on the SPY. From the March low of 630 on the SPY to high of 750 in June, less than a 38.2 % retracement occurred, suggesting the sideways pattern of June and July could be the half way point of the move up. If this condition turns out to be true, then an upside target near 850 is possible. Staying long the SPX.
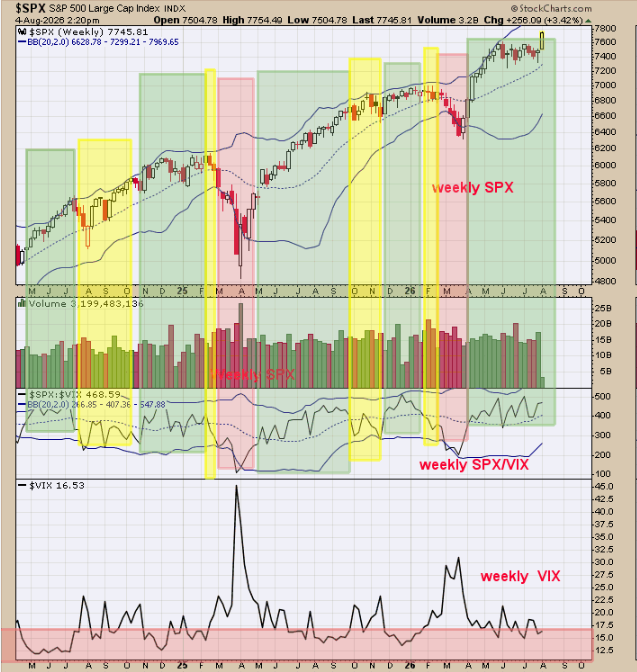
We updated the trend following method for the weekly SPX that we have been showing for the last several reports. The top window is the weekly SPX and middle window is the weekly SPX/VIX ratio. The SPX/VIX ratio leads the SPX and is usually the first to turn down before the SPX turns down. We shaded in green the times when both the weekly SPX and weekly SPX/VIX ratio are above their mid Bollinger band which suggests the uptrend in the SPX is intact. We shaded in yellow the times when the weekly SPX is above its mid Bollinger band and the weekly SPX/VIX ratio is below its mid Bollinger band; suggests a warning that the SPX could turn down. We shaded in pink when the weekly SPX and weekly SPX/VIX ratio are both below its mid Bollinger band suggesting a down trend in the SPX. The weekly SPX and SPX/VIX ratio are both above their mid Bollinger bands. The intermediate uptrend in SPX is intact for now.
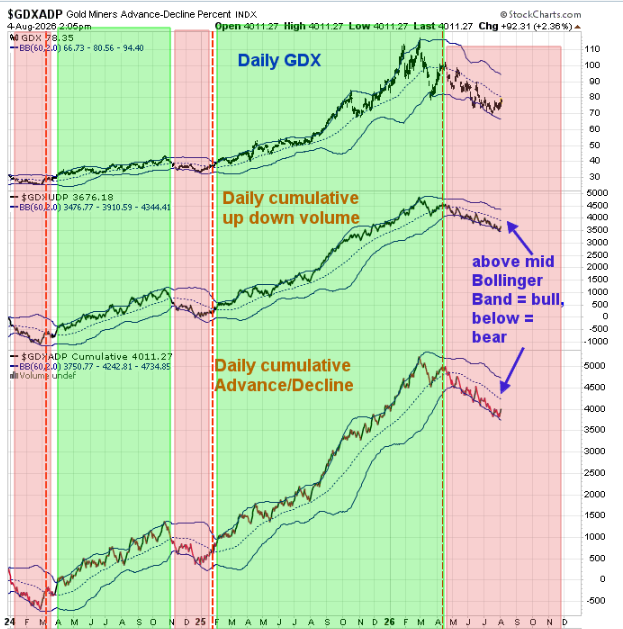
Above is a momentum chart for the advance/decline and up down volume for GDX. The bottom window is the cumulative advance/decline and next higher window is the cumulative up down volume, both for the GDX. This chart is designed to catch the trend and not pick the high and lows. When both indicators are above their mid Bollinger band and uptrend is present in GDX (shaded in green) and when below their mid Bollinger band a down trend is present (shaded in pink). The monthly charts gave a buy signal (see yesterday’s report) and for an uptrend to be confirmed in GDX both indicators will need to close above their mid Bollinger band; some times this process can take several days. Long GDX 9/29/25 at 75.76.


Comments
Log in or sign up to join the conversation.