

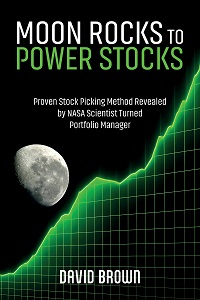
Our process-driven, growth-at-a-reasonable-price methodology is described by Sabrient founder David Brown in his new book, Moon Rocks to Power Stocks: Proven Stock Picking Method Revealed by NASA Scientist Turned Portfolio Manager. It is available in both paperback and eBook formats on Amazon for investors of all experience levels. It teaches how to methodically and strategically build wealth in the stock market—making it a great holiday gift idea (catch the low-price promotion this week only!). David describes his path from NASA engineer in the Apollo Program to creating quant models for ranking stocks and building portfolios in four distinct investing styles—Growth, Value, Dividend, and Small Cap. To learn more about David's book and the companion subscription product we offer that does most of the stock evaluation work for you, visit: https://DavidBrownInvestingBook.com.
Latest Sector Rankings
Relative sector rankings are based on Sabrient’s proprietary SectorCast model, which builds a composite profile of each of roughly 1,500 equity ETFs based on bottom-up aggregate scoring of the constituent stocks. The Outlook Score is a Growth at a Reasonable Price (GARP) model that employs a forward-looking, fundamentals-based multifactor algorithm considering forward valuation, historical and projected earnings growth, the dynamics of Wall Street analysts’ consensus earnings estimates and recent revisions (up or down), quality and sustainability of reported earnings, and various return ratios. It helps us predict relative performance over the next 3-6 months.
In addition, SectorCast computes a Bull Score and Bear Score for each ETF based on recent price behavior of the constituent stocks on particularly strong and weak market days. A high Bull score indicates that stocks held by the ETF recently have tended toward relative outperformance when the market is strong, while a high Bear score indicates that stocks within the ETF have tended to hold up relatively well (i.e., safe havens) when the market is weak. Outlook score is forward-looking while Bull and Bear are backward-looking.
As a group, these three scores can be helpful for positioning a portfolio for a given set of anticipated market conditions. Of course, each ETF holds a unique portfolio of stocks and position weights, so the sectors represented will score differently depending upon which set of ETFs is used. We use the iShares that represent the ten major U.S. business sectors: Financials (IYF), Technology (IYW), Industrials (IYJ), Healthcare (IYH), Consumer Staples (IYK), Consumer Discretionary (IYC), Energy (IYE), Basic Materials (IYM), Telecommunications (IYZ), and Utilities (IDU). Whereas the Select Sector SPDRs only contain stocks from the S&P 500 large cap index, I prefer the iShares for their larger universe and broader diversity.
The table below shows the latest fundamentals-based Outlook rankings and our full sector rotation model:
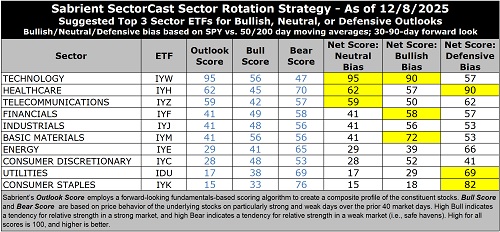
The latest rankings display a neutral bias, in my view, given that cyclicals, secular growth sectors, and defensive sectors are interspersed across the rankings, and only three sectors score above 50 on Outlook score.
Technology (dominated by the mega-cap Big Tech titans and AI-driven highflyers) remains at the top with a robust Outlook score of 95, despite having by far the highest forward P/E—a lofty 28.8x (although somewhat lower than the 31x it hit a few months ago). However, because of its ever-rising EPS growth estimate of 22.3%, the forward PEG (ratio of P/E to EPS growth) of 1.29 remains reasonable. Keep in mind, investors are quite willing to “pay up” for strong growth. Tech also displays strongly positive sell-side analyst earnings revisions, the highest profit margins and return ratios, and the best insider sentiment (open market buying). Because many Tech stocks are riding secular growth trends (i.e., little cyclicality), no other sector comes close to the consistent sales growth, margins, operating leverage, and return on capital. And Tech not only benefits from its own product development and productivity gains, but those products help other companies with their product development, product delivery, and productivity—so Tech benefits by helping all sectors grow and prosper.
Rounding out the top 6 are Healthcare, Telecom, Financials, Industrials, and Basic Materials —with the latter 3 scoring almost the same on all 3 scores. Financials and Telecom display the lowest forward P/E of 14.0x and very nearly the same low forward PEG of around 1.15-1.20. Basic Materials has the lowest forward PEG of 0.88 given its relatively low forward P/E of 17.3x and a strong projected EPS growth rate of 19.7%.
At the bottom of the rankings are defensive sectors Consumer Staples and Utilities. Consumer Staples has the highest forward PEG of 2.51 due to its low projected EPS growth rate of just 6.8%. Because of the capital spending going into building out the power grid and infrastructure, Utilities has been a solid performer this year, even though the sector is typically considered to be a defensive “bond proxy” dividend play. However, the Utilities sector as a whole suffers from relatively high valuations for only modest projected EPS growth over the next 12 months (9.1%) and a high forward PEG of 2.01, but this should change with the datacenter buildout and future ramp-up in power demand. Although US electricity consumption has been increasing only gradually over the past few years, ICF International forecasts a 25% increase by 2030 and 78% by 2050, driven largely by AI-related initiatives.
Keep in mind, the Outlook Rank does not include timing, momentum, or relative strength factors, but rather reflects the consensus fundamental expectations at a given point in time for individual stocks, aggregated by sector.
Notably, our ETF rankings continue to display much stronger Outlook scores for the cap-weight indexes, like SPY (50) and QQQ (69), over the equal-weight indexes, like RSP (33) and QQQE (54), which reflects the higher quality of the mega cap companies that dominate the cap-weight indexes. You can learn more about gaining access to Sabrient’s ETF Scorecard, which ranks roughly 1500 ETFs, by visiting: http://davidbrowninvestingbook.com
Sector Rotation Model and ETF Trading Ideas
Our rules-based Sector Rotation model, which appropriately weights Outlook, Bull, and Bear scores in accordance with the overall market’s prevailing trend (bullish, neutral, or defensive), returned to a bullish bias on 11/25 after briefly dropping to neutral when the S&P 500 fell below its 50-day moving average during November. (Note: In this model, we consider the bias to be bullish from a rules-based trend-following standpoint when SPY is above both its 50-day and 200-day simple moving averages, but neutral if it is between those SMAs while searching for direction, and defensive if below both SMAs.)
As highlighted in the table above, the Sector Rotation model suggests holding Technology (IYW), Basic Materials (IYM), and Financials (IYF). However, if you prefer a neutral stance, it suggests holding Technology, Healthcare (IYH), and Telecom (IYZ). Or, if you prefer to take a defensive stance, it suggests holding Healthcare, Consumer Staples (IYK), and Utilities (IDU).
Here is an assortment of other interesting ETFs that are scoring well in our latest rankings: WisdomTree Efficient Gold Plus Gold Miners Strategy (GDMN), iShares MSCI Global Gold Miners (RING), SPDR S&P Pharmaceuticals (XPH), Abacus FCF Innovation Leaders (ABOT), Castellan Targeted Equity (CTEF), iShares Global Tech (IXN), Sprott Active Gold & Silver Miners (GBUG), AOT Growth and Innovation (AOTG), Pacer US Large Cap Cash Cows Growth (COWG), Global X PureCap MSCI InfoTech (GXPT), American Century US Quality Growth (QGRO), Pacer US Small Cap Cash Cows Growth Leaders (CAFG), US Global GO Gold and Precious Metal Miners (GOAU), iShares US Pharmaceuticals (IHE), Guiness Atkinson Smart Transportation & Technology (MOTO), Neuberger Berman Disrupters (NBDS), Technology Trusector (TRUT), Amplify Video Game Leaders (GAMR), Janus Henderson Global Artificial Intelligence (JHAI), First Trust Small Cap Buy-Write Income (FTKI), First Trust Active Factor Small Cap (AFSM), AXS Esoterica NextG Economy (WUGI), NYLI US Large Cap R&D Leaders (LRND), Invesco Biotech & Genome (PBE), and Horizon Digital Frontier (YNOT)—my favorite ticker symbol. All score in the top decile (90-100) of Sabrient’s Outlook scores.
As always, I welcome your thoughts on this article! Please email me anytime. Any and all feedback is appreciated. Also, please let me know of your interest in any of Sabrient’s new indexes for ETF investing, such as High-Quality Growth (similar to our Baker’s Dozen model), High-Quality Growth & Income, SMID-Cap Quality Plus Momentum, High-Quality Energy, Quality Legacy & Green Energy, Defensive Equity, Space Exploration & Off-Earth Sustainability, and the Sabrient Select High Conviction Portfolio (active).
More By This Author:
Stocks Eye A Third Straight Banner Year, So Why Is Socialism Gaining Traction?
Stocks Waver Ahead Of Holidays… Will Santa Arrive As Scheduled?
Is The Market Finally Ready For A Value Rotation?



Comments
Log in or sign up to join the conversation.