


Overview
There has been outsized investor focus on inflation and the Fed’s response to it—something that new chairman Kevin Warsh is trying to diminish. He has stated, "…market participants are learning to play the ball, not the referee." Warsh has suggested a preference fulfilling the mandate of price stability through a combination of lower policy rates, continued balance sheet reduction, and structural reform of the official inflation metrics (which rely on many lagged, imputed, and low-relevance components). Some observers and several FOMC members say we must have rate hikes to control the inflationary spiral, while others say we need rate cuts to boost the struggling lower leg of our K-shaped economy (lower-income and working-class consumers, small businesses, and housing) and the alarmingly low personal savings rate (2.7% versus a long-term average of 8.3%) that has been supporting personal consumption. Count me in the latter group, as I explain in my full commentary below.
But that’s not stopping the bond vigilantes from boycotting the massive issuance of debt and thus pushing up longer-term rates at an alarming pace, which negatively impacts mortgage rates, corporate borrowing costs, and the discount rate on stock valuations. Uncertainty leads to higher term premiums. It might be not only a protest against rising federal debt but also anticipation of the Fed shrinking its balance sheet (aka QT), which pulls cash (bank reserves) out of the financial system while increasing the supply of bonds in the market (leading to higher yields)—even though the Fed has already reduced its balance sheet by $2.4 trillion (from $9 trillion in 2022) to remove about half its pandemic-era QE accumulation.
As a result, 10-year Treasury yields made another new 18-month high at 4.74% at the end of July, and the 30-year reached its highest yield since 2007 of 5.27%, entirely due to rising real rates not inflation expectations (which remain modest). Although yields pulled back last week on hopeful Iran news, plunging crude oil prices, and weak jobs reports, providing hope of a less restrictive Fed. So, although longer-term yields may well rise further—with the 10-year potentially challenging 5% for the first time in three years—I see this as a buying opportunity for fixed income, such as with iShares 20+ Year Treasury ETF (TLT) with a current yield of 4.75%, particularly if inflation has seen its peak and is pulling back, as I suspect it is.
The federal deficit is now roughly $2 trillion out of a $7 trillion total budget (that’s nearly 30% of the total budget!), which must be financed through Treasury issuance. And roughly half that deficit is interest on debt payments (now exceeding $1 trillion/yr and growing fast), which rises as debt increases, requiring new issuances and debt rollovers—both at higher interest rates than before as the Treasury Dept. has focused on the short end of the yield curve, thus lowering the weighted average maturity of federal debt.
It’s a death spiral rapidly overwhelming the budget, which (as I have discussed at length in many prior posts) must be addressed with a 3-prong approach of: 1) growing away the debt through robust GDP growth given that tax receipts historically average 17% of GDP no matter the tax rates, 2) cutting away the debt through reduced spending growth below the rate of GDP growth and rooting out waste and fraud, and 3) inflating away the debt through elevated inflation rates that reduce the dollar value of the debt.
Meanwhile, the giant hyperscalers are not only spending most or all of the massive cash flows but are also flooding the corporate bond market with as much as $1 trillion for AI infrastructure buildout. So, perhaps part of Warsh’s plan is to let the market do the dirty work of suppressing economic activity by raising longer-term rates—leading to higher mortgage rates, corporate borrowing costs, and the discount rate on stocks valuations—hopefully not to the point of causing a recession.
For now, there is no sign of recession as the Atlanta Federal Reserve’s purely model-driven GDPNow forecast shows an estimate for Q3 real GDP growth of a robust +5.8% as of 8/6 (although the more nuanced consensus of “Blue Chip” economists is only 2.0%). You might recall the forecast showing strong numbers for Q2 with a high of +4.3% in late May before falling to a low of +1.2% in early July, with the final BEA report coming in at just +1.5%. Nonetheless, there was plenty of good in the report, as non-government private spending (consumers and private fixed investment) grew +3.9%.
And although this private spending was offset by 1) falling net exports (as imports surged +11.5%, driven by AI-related components), which alone reduced the final number by 1.01 percentage points (pps), and 2) private inventory drawdowns, which reduced it by 0.67 pps, both of these metrics in fact reflect robust underlying domestic demand, consumer spending, corporate capex, and overall economic activity. Indeed, when high imports and low inventories suppress GDP, it typically suggests impending economic acceleration and revved-up domestic manufacturing, which would boost GDP metrics in subsequent quarters—which the Atlanta Fed’s GDPNow forecast seems to be reflecting.
In my full commentary below, I discuss:
1. The selloff in the AI trade and the restoration of Apple’s prominence
2. Hyperscaler capex, free cash flow, and power demand
3. Solid GDP growth but mixed messages on jobs and housing
4. Trends in inflation, supply chain pressures, and productivity
5. The bond vigilantes, rising federal debt, China’s woes, and Fed policy
6. My final comments section pushing back on the overwrought AI backlash/alarmism
7. Sabrient’s sector rankings, positioning of our sector rotation model, and some top-ranked ETF ideas
With all the turmoil in the AI trade, which was overdue after such a meteoric rise, market leadership continues to broaden and rotate. The fact that the market rotated rather than sell everything and go to cash is encouraging and suggestive of continued bullish conviction. Russell 2000 companies’ earnings growth forecasts for CY2026 have climbed to 38% from about 23% at the beginning of the year—in spite of rising interest rates that tend to have outsized impact on the floating-rate debt typically carried by smaller firms. And the equal-weight S&P 500 ETF (RSP) is approaching $100 billion in AUM, with performance led by many of the “S&P 493” rather than the MAG7.
Chamath Palihapitiya, entrepreneur and All-In Podcast team member, recently quipped, “Fundraising requires narrative, and ‘we are building God’ is a better pitch than ‘we wrote some very clever linear algebra, pirated the internet, and threw a bunch of compute at it.’” Perhaps that’s what investors reduced it to as they abandoned the AI trade—at least for the moment. And perhaps it is true that our economy has been overly reliant upon AI-led expansion with yet-to-be-proven ROI, especially datacenters.
Indeed, the dollar value of datacenter construction plus computers and communications equipment are up 23% YoY, with the hyperscalers’ capex [in order of dollar commitments: Amazon (AMZN), Microsoft (MSFT), Alphabet (GOOGL), Meta (META), Oracle (ORCL), and now SpaceX (SPCX)] projected to be in the range of $700-800 billion for CY2026 (40% higher than CY2025)—leading to reduced shareholder-friendly buybacks but surging global semiconductor sales. According to the Semiconductor Industry Association, chip sales worldwide were up +123% YoY in the month of June, totaling over $400 billion during Q2, and are expected to exceed $1.5 trillion for CY2026.
That’s a lot of investment to recover. But as Tech executive and investor Nat Friedman opined, “Pessimists sound smart. Optimists make money.” Indeed, longer term, I believe the broad potential ROI of AI—in reshaping our economy and society through massive productivity gains, solving complex scientific and technological challenges, and fundamentally transforming the workplace and daily life—is stronger and materializing faster than anticipated even at the beginning of the year.
The use cases and compute demand for AI have barely begun to manifest, with a future encompassing autonomous transportation, factory automation, humanoid robots, personal assistants for hundreds of millions of individual users, and AI assistance on everything from drones for law enforcement, to surgery and drug discovery, to optimized asset maintenance, smart grid energy, and fraud monitoring—not to mention the associated power demand for it all.
So, am I concerned about whether the massive AI capex by the hyperscalers on infrastructure (like datacenters) and power generation will see attractive ROI anytime soon? I am not. In fact, I bought into the July “tech wreck,” including some names in memory and storage as well as the MAG7 ETF (MAGS), and I bought into the “SaaSpocalypse” in February and again in April via the iShares Tech-Software ETF (IGV). In its earnings report the other day, Palantir (PLTR) described commercial demand as “otherworldly,” and the stock surged 30%. In my view, for anyone who felt they had missed the boat on the AI surge and didn’t want to chase it—this was the pullback you were waiting for.
Of course, there is no guarantee that the market won’t turn tail once again, given the unresolved conflict with Iran and its terrorist proxies and the real potential for reescalation. And besides Iran, a plethora of uncertainties persist with oil prices, shipping and supply chains, trade deals and tariffs, Ukraine, China, Japanese yen, federal debt, civil strife, midterm elections and the unnerving rise of DSA candidates, inflation, jobs, and monetary policy from a revamped Fed. Did I miss anything?
But fundamental tailwinds still outweigh headwinds, in my view, given AI optimism, robust capex, deregulation, lower taxes, re-privatization, re-industrialization (onshoring of manufacturing), diversification of supply chains (not deglobalization), rising productivity/margins/earnings, low credit spreads, and resumed disinflationary trends. Deregulation is focused heavily on encouraging domestic fossil fuel production, less burdensome financial oversight, and less onerous climate rules, mostly to the advantage of Energy, Financials, and Industrials sectors.
Forward P/E multiples have receded largely due to a rising discount rate as bond yields surge. And yet stocks keep going up on the back of incredible earnings growth and fast-rising forward estimates. According to First Trust, “Analyst estimates have increased as the year has unfolded, with Large Cap, Mid Cap, and Small Cap Index EPS estimated to reach a record $354.46, $219.63, and $107.53, respectively, in 2026 (as of 8/3/26) [according to Bloomberg]. For comparison, analyst estimates were much lower at the start of the year, with the same indices estimated to see calendar year 2026 earnings of $310.84, $202.91, and $96.06 (as of 12/31/25).”
Indeed, the S&P 500 is on pace for blended earnings growth in Q2 of 47% versus a forecast of 23% just a few weeks ago. However, if you strip out Amazon (AMZN) and Alphabet (GOOGL), whose incredible earnings reports were largely driven by non-operating gains on investments in Anthropic and SpaceX, the blended S&P 500’s blended EPS growth falls to around 29%, which is still quite impressive.
Overall, given the market broadening beyond the Big Tech titans, and assuming the Fed does not become more hawkish, I continue to see opportunities in active stock selection, as well as in cyclicals, value stocks, small caps, and bond-alternative dividend payers. Indeed, Sabrient’s Baker’s Dozen, Forward Looking Value, Small Cap Growth, and Dividend portfolios have been largely outperforming their benchmarks—some by substantial margins. And as a reminder, our Earnings Quality Rank (EQR) is licensed as a quality prescreen to the actively managed, low-beta First Trust Long-Short ETF (FTLS), which now has nearly $2.5 billion in AUM.
By the way, in my July post, I wrote a long Final Comments section on the alarming rise of socialism, which I would encourage you to read if you haven’t already. Although I acknowledge the disparate impacts of the K-shaped economy, the socialists’ harping on fairness and wealth inequality is largely a red herring as living standards, real incomes, consumption, and life expectancies have generally risen across demographics nationally. It certainly doesn’t warrant dismantling the capitalist system that has created so much innovation, value, wealth, comfort, and good for the world.
The exception to broadly rising living standards seems to lie in many of our deep-blue cities and states. So today, let me also add a comment on the “affordability” issue that has become the main talking point of the Left against the Trump Administration. The reality is that the bluest cities and states tend to have the worst affordability, as reinforced by US News & World Report’s latest 2026 rankings of states that put California dead last in its specific “Affordability” metric, followed by other deep-blue states, namely New Jersey, Hawaii, New York, Washington, Massachusetts, Maryland, and Colorado. It also put California dead last for the broader “Opportunity” category, which comprises the subcategories of Economic Opportunity, Affordability, and Equality across demographic groups.
So, don’t be gaslighted by deceptive electioneering. The answer is not to double down on the same misguided and counterproductive policies—like onerous zoning restrictions and permitting processes, punitive taxation, high energy prices, mandated worker benefits, rent control, sanctuary policies, and permissiveness on crime and homelessness—that have degraded quality of life for everyone while inviting fraud and corruption. Rather, voters should pivot back to embracing free markets, meritocracy, property rights, and the rule of law that built our great country. Such principles have proven much more adept at solving problems than dogmatic bureaucrats, virtually none of whom have any private-sector leadership experience. Affordability is a genuine problem, particularly in several high-cost blue states, and policymakers in these locales shouldn't assume that further expanding redistribution or intervention policies will solve the problems that were likely created by these policies in the first place.
Market Commentary:
The cap-weight S&P 500 (SPY), equal-weight S&P 500 (RSP), Dow Jones Industrials (DIA), S&P MidCap 400 (MDY), S&P SmallCap 600 (SPSM), and Russell 2000 (IWM) all surged to new all-time highs last week—and small caps are outperforming them all YTD. Only Nasdaq 100 (QQQ) has not returned to its high from early June, as investors rotate capital into other high-potential opportunities rather than selling and going to cash.
Remarkably, at the tail end of the market pullback, Vanda Research (which closely tracks retail trading flows) reported that individual investors were dumping stocks at the fastest pace since the start of the pandemic but also noted that individuals weren’t leaving the market entirely but rather becoming “more discerning” and “increasingly willing to reduce single-name risk” in favor of ETFs. Morgan Stanley’s Michael Wilson called the June-July dump one of the worst momentum selloffs in history—but of course the forced liquidation of all public equities held by the highly leveraged Situational Awareness long/short hedge fund played a role in it as well, as its longs in AI infrastructure and chip stocks cratered while its shorts in software rallied.
Much of this has been driven by concerns about the massive capex being spent by the Big Tech cash machines, essentially “betting on the come” that the ROI will be just fine and dandy, leading to massive productivity gains, margin expansion, and blowout earnings for the hyperscalers and companies across the economy. Phil Rosen of Opening Bell Daily published this startling chart illustrating that the parabolic free cash flow of the semiconductor firms is essentially a massive transfer payment directly from the hyperscalers. As Rosen puts it, “Effectively every dollar for a chipmaker stems from a dollar of Big Tech spending.” Of course, this is slashing the large share buyback programs to which shareholders in these names became accustomed.
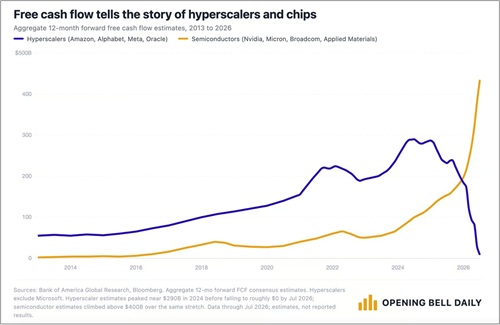
Of particular note, cash-machine Alphabet (GOOGL) reported record-setting Q2 revenue of nearly $120 billion and net income of $112 billion—but also -$5.9 billion in free cash flow (yes, negative, for the first time since its 2004 IPO), compared to the $24.5 billion levels of FCF in Q3 and Q4 2025, as its capex doubled YoY to $44.9 billion, mostly for AI infrastructure. In addition, Alphabet’s cash flow margins were also driven down significantly due to building inventory of its proprietary Tensor Processing Units (TPUs) for outside sale, while also actively developing a next-gen server accelerator called “Frozen v2” that aims to achieve up to 10x greater energy efficiency by permanently etching parts of its Gemini AI model architecture directly into the silicon. Moreover, the company’s capex plan for 2026 is set at $205 billion, likely to be split 50/50 between debt and equity. In the words of DataTrek Research, “GOOG Is essentially a startup again.”
By the way, Electronic Arts (EA) was just bought out and taken private last week (thus removing it from major indexes like S&P 500 and Nasdaq 100). It was purchased by a group led by Saudi Arabia's Public Investment Fund (PIF), along with Silver Lake (private equity) and Affinity Partners (Jared Kushner’s investment firm), at a price of $55 billion, making it the largest leveraged buyout (LBO) in history. Of note, $20 billion of the price was paid in debt—adding even more supply to the saturated credit markets (further pressuring yields higher).
With all the turmoil in the AI trade hitting the mega-cap chipmakers and hyperscalers hard, Apple (AAPL) was briefly able to regain its mantle as the largest company by market cap in the world, largely because it has not poured massive capex into AI. Instead, it patiently rolled out Apple Intelligence to its 2.5 billion active devices, further securing long-term customer loyalty, which serves as a pipeline for its high-margin services and commercial platforms, including iCloud+ and creativity apps via recurring subscriptions.
Apple is quite deliberately the ultimate AI implementer rather than an AI builder, focusing its budget on on-device integration and outsourcing hyperscale cloud computing, as described in this recent article from CNBC. The company aims to process AI directly on user hardware, blending on-device security with cloud partnerships like Google Gemini to create a seamless user experience centered on an agentic version of Siri (scheduled for launch this fall) that can execute tasks across applications, turning its various devices into highly capable personal assistants for things like planning a trip, securing dinner reservations or game tickets, paying bills, or editing a photo. For the more complicated tasks, it will use Google Cloud with infrastructure based on NVIDIA (NVDA)’s (NVDA) GPUs and Intel (INTC)’s (INTC) CPUs.
Speaking of Intel, it has undergone a resurrection from the ashes like a phoenix—led in fact by its Phoenix, AZ and Hillsboro, OR plants with a combined 30,000 wafers per month from its newly reformed 18A node, a 1.8-nanometer-class semiconductor manufacturing process. For Q2, its revenue grew 25% YoY, with datacenter and AI revenue surging 59%. Intel’s quarterly EPS saw a 7th straight beat, with non-GAAP EPS of $0.42 (twice the $0.21 consensus). Its 18A foundry yield (non-defective chips) reached over 85% (up from about 65% in the prior quarter), putting Intel close to being the top competitor to industry-leading foundry Taiwan Semiconductor (TSM)’s (TSM) 2nm N2 node (90% foundry yield) and ahead of Samsung's SF2 node (50-60% yield). And looking ahead, Intel’s 18A-P enhanced process has entered risk production mode with expectation of a 9% performance boost or lower power consumption.
Intel’s impressive foundry turnaround and yield enhancement has firmly crossed the threshold of commercial viability. This technical milestone coincided with Intel securing a manufacturing deal with a major cloud service provider. Furthermore, Wall Street reports indicate Intel has captured early design successes and commitments from Tech giants like NVIDIA, Advanced Micro Devices (AMD), and OpenAI, alongside ongoing preliminary talks regarding a domestic manufacturing partnership with Apple.
Notably, AMD is emerging as a solid competitor to NVIDIA with its rack-scale system for AI called Helios. According to CNBC, “Microsoft announced…it will use the Helios system in its data centers, joining Meta, OpenAI, Oracle and others in a race to grab as much compute as possible.” Of course, competition is good for everyone, even NVIDIA, but particularly for hyperscalers, clients, and consumers. AMD reported a solid earnings beat last week, with revenue up 50% YoY—including datacenter revenue up over 100%, which CEO Lisa Su expects will accelerate even further in H2 2026.
As I discussed in my July post, the institutional investment trend continues to rotate away from the private credit mania and towards real/hard assets, including infrastructure and energy/power that serve as the lifeblood for this secular trend in AI while offering investors long-term cash flow. Recently, there has been a notable surge of capital into advanced battery storage (including Brookfield’s just-announced purchase of Aypa Power for $7 billion), pipeline operators, shale production, and renewable power. Other targets may include LNG terminals, processing facilities, grid assets, power plants, fiber-optic cable networks, and makers of gas turbines, as well as miners of industrial metals and critical minerals.
To power all these new datacenters, natural gas is the primary fuel source today and nuclear is the likely solution for the future. Besides in my July post, I also described this in great detail in my comprehensive special report, The Future of Energy. Alternatively, if Elon Musk has his way, we ultimately will have orbital datacenters with collocated solar power generation (where unobstructed sunlight is available 24/7) that can be beamed back to Earth. Or, if Peter Thiel and Panthalassa have their way, we will have floating datacenters in the cold ocean, powered solely by continuous wave energy with natural cooling.
But for land-based power demand, GE Vernova (GEV) has emerged as the dominant supplier of industrial natural gas turbines in the US. In Q1 alone, GEV booked $2.4 billion in electrification equipment orders specifically to support datacenters, which is more than all of 2025 combined. And then its Q2 report showed another $2.7 billion in datacenter equipment. Total revenues rose 22% YoY to $11.1 billion in Q2 while operating earnings rose 32.8% to $649 million ($2.47 per share compared to $1.86 per share in Q2 last year). Total orders across all business segments in Q2 rose +88% YoY (from Q2 2025) to $24.2 billion, pushing its total backlog to $176 billion (+37% YoY), including 116 GW of gas turbine power capacity (up from 100 GW in Q1) and an expected backlog of $200 billion in 2027, with reservations all the way out to 2031 deliveries.
I mentioned earlier that the Trump Administration’s deregulation push is mostly to the advantage of Energy, Financials, and Industrials sectors. Indeed, Energy got a big headstart in Q1, largely on supply concerns (geopolitical sanctions, threats to shipping routes, harsh winter weather) but also from the Permitting Reform Act (HR1) and the realization that AI power demand would be rising faster than expected (although adjusted for inflation, oil refining capex is at its lowest since WWII).
But Industrials (on infrastructure spending) and Financials began to catch up during Q2 (while Energy went flat), with Industrials boosted by infrastructure spending commitments while Financials are riding the dual waves of technology and deregulation. Banks and insurers are enjoying enhanced interest income on reserves, deregulation has cleared many impediments to new product launches (including blockchain and tokenization), and the combination of a steeper yield curve (mostly due to higher long-term rates) and less red tape leads to higher profit margins.
In addition, Healthcare is a sector I have expected to be a prime beneficiary of enhanced AI capabilities for rapid drug, vaccine, and therapeutics development, including tailored precision medicine, genomics, and gene editing—replacing years of trial-and-error with fast, data-driven workflows that can predict protein structures, design novel molecules, and simulate biological systems to optimize clinical trials. And indeed, the sector broke out in June. Healthcare offers the rare “all-weather” combination of non-cyclical/non-discretionary demand, reliable earnings, and secular growth via transformative technologies, rapid drug discovery, and therapeutics—supported by the structural tailwinds of aging demographics and AI-driven productivity growth. For example, studies suggest the timeline for AI-assisted drug or vaccine development has fallen from five years to one year, slashing development costs. Remarkably, Healthcare added 437,500 US jobs over the past year, accounting for 86% of all net job creation over that timeframe.
Solid GDP growth but mixed messages on jobs and housing:
Real GDP in Q2 grew at a +1.5% annualized rate, compared to +2.1% in Q1 and the consensus expected +2.0%. Nominal GDP (real GDP plus inflation) rose at a +7.9% annual rate in Q2 and is up +6.5% from a year ago. Personal spending was the main driver of growth, rising +0.3% MoM (and +3.2% annualized), while personal income increased just +0.2% MoM, squeezing the personal savings rate to just +2.7%. But of course, the AI/datacenter buildout is also an important driver. Datacenter construction grew at a +15.2% annualized rate, business investment in information processing equipment grew at +8.3%, software at +11.4%, and R&D at +7.5%. Absent such investments, real GDP would have grown at less than +1.0%. But the better news is that Core Real GDP, which excludes government purchases, inventories, and international trade, grew at a +3.9% annualized rate, the fastest pace in more than three years, and is now up +2.6% from a year ago.
As corroboration, the July ISM Manufacturing Index of 55.6 showed expansion (above 50) for the 7th straight month and reached its highest level in 4 years, with factory onshoring (aka re-industrialization), defense procurement, and AI-related datacenters, semiconductors, network connectivity, and power generation as key drivers. This created increased hiring as well, pushing the employment subindex from contraction in June to expansion in July. On the other hand, although July’s ISM Services Index came in strong once again, powered by business activity and new orders, its employment subindex declined from expansion in June to contraction in July (i.e., the opposite of the Manufacturing employment subindex).
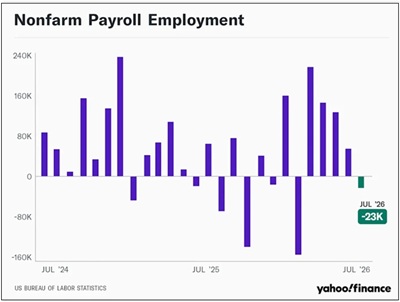
The jobs market is giving mixed messages as this broad economic transition takes shape. After a disappointing July ADP private payrolls report of +44,000 new jobs, the July BLS employment report was stunningly bad, losing -23,000 jobs, and civilian employment (which includes small-business start-ups) fell 87,000. Healthcare and construction continued to grow, but everything else fell, particularly leisure & hospitality workers hired for the World Cup tourist surge. And yet the unemployment rate inched down slightly to 4.1%, which sounds great until you realize that 260,000 people left the workforce and labor participation fell to 61.4%, the lowest since February 2021. Moreover, May’s stellar numbers were cut in half upon revision, from +129,000 new jobs to just +63,000. As shown in the chart below from Yahoo Finance, monthly jobs growth has been volatile, and the trend this year is unsettling.
Wage growth has been flat-to-down, with nominal wage growth at +3.2% YoY through 6/30, according to the BLS report, but +4.4% YoY according to ADP. The difference is due to ADP tracking the median wage growth of individual job stayers, while the BLS tracks the average labor cost across the entire workforce, including employee turnover and new hires. So, ADP reflects the momentum in individual purchasing power for stable workers, while BLS reflects the absolute cost of labor across the collective economy for tracking macroeconomic inflation impacts.
By the way, housing starts for July will be released on 8/18, but for June they rose an impressive +19.0% MoM and +3.5% YoY. However, it was mostly driven by multi-unit starts, up +17.2% YoY versus single-family home starts falling -3.2%. Unfortunately, that sounds more like Zohran Mamdani’s vision for bare-bones, high-density “housing for all” than the aspirational American Dream of a standalone house with a yard and white picket fence.
Trends in inflation, supply chain pressures, and productivity:
June CPI fell to +3.46% YoY from May’s +4.17%. The largest contributor was energy prices, with gasoline falling -9.7% MoM, reflecting the temporary easing in oil markets following the Iran ceasefire MOU. Not surprisingly, Core CPI excluding food & energy came in much lower at +2.6%. Shelter, the largest piece of CPI, rose just +0.1% MoM versus its typical +0.3% pace. Services prices overall were flat, while goods prices receded. However, the July metrics coming out this week might show an uptick due to the renewed hostilities, and August is uncertain given the off-and-on negotiations with an untrustworthy Iran.
Side note: I don’t fault the President for not wanting to completely destroy the country of Iran and create a refugee crisis. But he’s dealing with a radical jihadist regime that cares not in the slightest about life, liberty, happiness, peace, and prosperity for its citizens—which is the mindset of the West. Instead, it desires only hegemony over the Middle East, destruction of Israel and eventually the US, and ultimately the creation of a global caliphate, governed by Sharia law and free of infidels, and the return of the 12th Imam. The only reason the regime would sign a peace agreement with the US is to avoid a total loss and buy time while surreptitiously pursuing its insidious motives. It’s a no-win situation for Trump, but Iran’s nuclear ambitions, missile and drone production, and terrorist proxies had to be stopped sooner than later.
June PPI came in at +5.5% YoY following May’s +6.0% (revised), and Core PPI was +4.7%. On the goods side, nearly 2/3 of the decline came from a -12.0% drop for gasoline prices, while food prices and other energy-related items like diesel, jet fuel, and “crude petroleum” (precursor to plastics, chemicals, and lubricants) fell. On the services side, prices rose +0.2% after declining -0.1% in May—although half of the increase came from sales margins on retail fuels and lubricants, which jumped +13.0%.
The last inflation report for June was the BEA’s PCE, which rose +3.7% YoY, while Core PCE excluding food & energy was up +3.3%. Keep in mind, shelter cost accounts for roughly 15% of PCE versus 35% of CPI, while healthcare cost accounts for over 20% of PCE versus about 10% of CPI. Obviously, Fed policy has way more impact on shelter supply/demand than on healthcare. Notably, Fed chairman Warsh’s preferred metric, “Trimmed Mean PCE,” fell from +2.4% YoY in May to +2.2% in June, which is the lowest YoY level since November 2020. This version of PCE filters out the most extreme price swings that can distort the total, offering a more stable and relevant perspective.
The two charts below compare trends in these key metrics over the past five years. In both charts, the abrupt surge in headline PPI and CPI would be frightening if indicative of a structural problem in the global economy. However, we know this was event-driven due to disruptions to supply chains and the spike in oil, gas, and fertilizer prices from the Iran conflict and blockade of the Strait of Hormuz. As these supply chain pressures have begun to ease, crude oil fell from a high around $108/bbl in mid-May to below $80/bbl (WTI September futures). But it looks much better when you exclude food & energy prices with Core PCE and Core CPI, which have managed to stay somewhat under control at +3.3% and +2.6%, respectively.
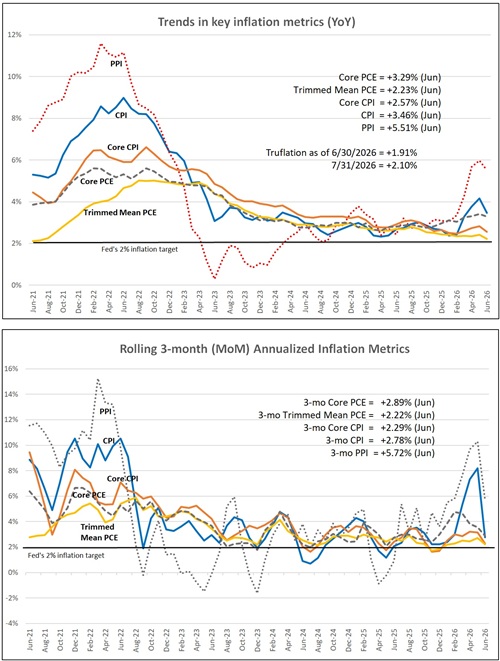
Even more encouraging is the lower chart showing 3-month rolling annualized averages (which better quantifies the current trend in inflation). Although headline PPI and CPI annualized 3-month trends were startlingly high, they have recently fallen hard to below 3.0%, and the Core numbers are quite sanguine, with Core PCE at +2.89% and Core CPI +2.29%—and Trimmed Mean PCE is a tolerable +2.22%, essentially matching the YoY number of +2.23% in the upper chart.
Other alternative metrics include the real-time (i.e., unlagged) blockchain-based Truflation, which was +1.91% at end of June (for comparison purposes with CPI and PCE), but has risen to +2.10% as of 7/31 and +2.32% as of 8/7. It tracks over 15 million live price points (vs. CPI’s 80,000), including real-world housing components (e.g., mortgage rates and home prices) rather than delayed imputed metrics like Owner's Equivalent Rent (OER) used in CPI.
Looking ahead, the Cleveland Fed’s Inflation Nowcast model for July predicts CPI will be +3.42%, Core CPI +2.52%, PCE +3.69%, and Core PCE +3.31%, as of 8/7. Also, the 5-year breakeven inflation rate is also +2.22%, as of 8/7, reflecting the implied forward expectations of investors in 5-Year Treasury Constant Maturity Securities and 5-Year Treasury Inflation-Indexed Constant Maturity Securities.
The elevated inflation not just in the US but around the world—with IMF projecting +4.7% globally—is not going to be quelled by a 25-bp Fed rate hike. We need the supply shock to be alleviated so that secular disinflationary trends can resume. Short of that, central bank tightening would only be recessionary, which is a bad way to reduce inflation.
I have been quite clear in my view of the overriding weight of the many powerful, secular, disinflationary trends versus short-term, event-driven, or one-time price spikes. Those trends include aging demographics, slowing global population growth, accelerating disruptive innovation like AI and automation, rising productivity, falling shelter and energy costs, global peace (as hostile nations are quickly pacified/disarmed), modest liquidity growth, a stable dollar, and the deflationary impulse on the world from a struggling China (as discussed in the next section below). In addition, although there might be some inflationary impacts of reshoring of manufacturing and diversification of supply chains in the short term, it is also adding redundancy and additional domestic industrial capacity, i.e., “duplicative excess capacity,” in the words of Treasury Secretary Scott Bessent (for national security purposes), which is ultimately disinflationary.
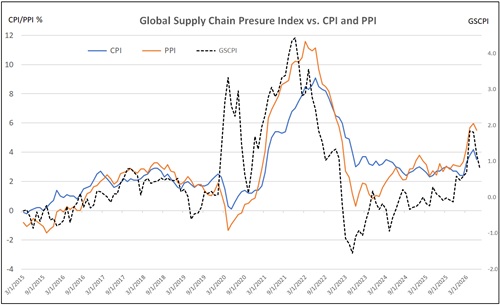
The current event-driven supply shocks are reflected in the New York Fed’s Global Supply Pressure Index (GSCPI), which computes a z-score (number of standard deviations from the long-run average). Back in April, it surged to +1.84, which suggested elevated supply chain pressures (but still well below the December 2021 high of +4.44), but it has quickly retreated to +0.79. The chart below shows how GSCPI tends to lead PPI, which in turn tends to lead CPI. Note the correlation over the past 3 years of rising GSCPI and PPI, which finally made a downtrending CPI tick upward. But the sharp downturn in GSCPI is already pulling down PPI and CPI. Once the Iran conflict ends, energy prices and supply chain disruptions should quickly recede, alleviating these event-driven inflationary drivers so that GSCPI can gradually pull back to the zero line—and pull inflation down with it.
None of this suggests that inflation has been put to bed. But Kevin Warsh has suggested a preference for fulfilling the mandate of price stability through a combination of a lower fed funds rate, continued balance sheet reduction, and, notably, structural reform of how inflation is measured (perhaps replacing some of the long-lagged items in CPI and PCE, like shelter costs)—which certainly would be welcomed by me. This approach would ensure that liquidity is cheaper to access, preventing credit markets from locking up, without flooding the entire financial system with inflationary long-term liquidity. Less Fed demand for bonds might steepen the yield curve somewhat and keep mortgage rates elevated, but lower fed funds lowers short-term construction rates and adjustable mortgage rates while lowering inflation and raising real wages.
I believe inflation likely has seen its peak from the event-driven disruptions, and elevated longer-term Treasury yields likely have been driven more by hawkish signals from the Fed and bond vigilantism than from any actual concerns about structural inflation becoming embedded into the economy. Indeed, rising productivity, moderating event-driven supply chain disruptions, and a resumption in disinflationary secular trends promise to help inflation metrics recede back under +2.5%.
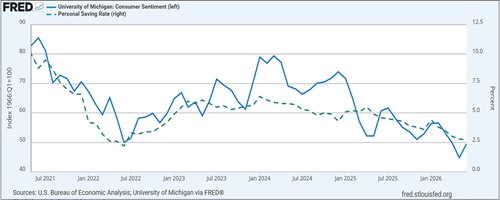
Productivity was up +2.2% YoY in Q2 (following 2.8% YoY in Q1), while hourly compensation increased +3.6%, which implies unit labor cost (ULC) inflation of +1.4% YoY. According to economist Ed Yardeni, previous inflation surges were worsened by soaring ULC inflation and a wage-price spiral that is not happening today. And with nominal wage growth at +3.2% YoY through Q2, it is debatable whether real wage growth is positive depending upon which of the several inflation metrics I discussed earlier you prefer. Personal income grew +0.2% MoM in June but personal spending increased +0.3%, and the personal savings rate, which tracks how much of after-tax income is not consumed, fell to 2.7%, which is the lowest reading since the pandemic-era bear market of 2022, and before that the 2008 Global Financial Crisis. Of course, such a low savings rate allows for more spending today but isn’t sustainable longer-term. So, perhaps it makes sense that University of Michigan Consumer Sentiment has been largely correlated with the personal savings rate, as shown in the chart below.
In speaking to Congress on 7/14, Warsh was optimistic about AI improving the outlooks for both the economy and inflation and that investment in datacenters, software, and infrastructure should raise productivity, increase the economy’s non-inflationary growth potential, and gradually ease price pressures. His main message is that the Fed must remain focused on inflation while also acknowledging AI’s capacity to support stronger, less inflationary growth.
The bond vigilantes, rising federal debt, China’s woes, and Fed policy:
But none of this is stopping the bond vigilantes from protesting rising budget deficits (fiscal policy) and perceived Fed inaction on inflation (monetary policy, i.e., no fed funds rate hike) by boycotting the massive issuance of debt—in the US and around the world—and thus pushing up longer-term rates, raising bond volatility, and steepening the yield curve at an alarming pace. The bond vigilantes also might be withdrawing capital in anticipation of the Fed further shrinking its balance sheet (aka quantitative tightening or QT), which pulls cash (bank reserves) out of the financial system while increasing the supply of bonds in the market. In fact, this might be part of a deliberate plan by Warsh to induce the market to do the tightening rather than the Fed having to make official policy decisions to manipulate the market.
I write often about the ballooning federal debt leading to new Treasury issuance and the rolling of maturing debt at higher rates. The chart below shows the impact of both rising debt and rising interest rates, from a 2021 baseline interest rate of 1.70% to today’s average of 3.44%. In summary, 2021 interest baseline expense is $482 billion; the added expense from roughly $10.8 trillion additional debt is $183 billion; and the added expense from the doubling of the effective interest rate is $684 billion; leading to a total federal gross interest expense of approximately $1.35 trillion for 2026. [Note: CBO separately projects about $1.0 trillion of net budget interest in 2026, which is the gross interest expense minus the interest the federal government receives on its own assets like student loans and federal credit programs.] So, the federal budget deficit is in a compounding cycle where rising debt coupled with higher interest rates leads to fast-rising interest payments, which further increases the deficit.
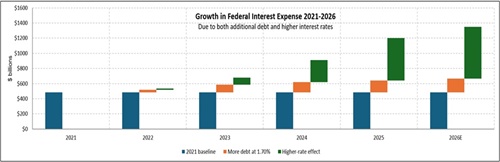
Obviously, this is unsustainable and will soon overwhelm the entire budget unless rates come down or deficit spending is reduced—preferably both. Moreover, while GDP growth has been driven largely by higher-income consumer spending and AI-related capex, broad segments of the economy—including lower-income/working-class consumers, small businesses, and housing—are still struggling. It has been described as a “K-shaped” economy in which the upper branch represents asset-owning households who enjoy the “wealth effect” from appreciating stock prices and home values while the lower branch represents wage-reliant households squeezed by consumer inflation and borrowing costs and a lack of appreciating assets.
Fed policy is already tight. QT is appropriate when excessive M2 monetary growth fuels inflation in interest-rate-sensitive sectors, as happened in 2021. As such, I continue to pound the table on: 1) shrinking government and holding federal spending growth below the rate of GDP growth (fiscal policy), along with 2) a lower fed funds rate closer to 3.0% while keeping money supply growth in line with GDP growth (monetary policy), which stabilizes purchasing power.
As DataTrek Research has observed, “Regardless of individual and corporate tax rates, federal receipts have averaged 17% of GDP since 1960. Economic growth is the only reliable way to increase government revenues.” So, tax cuts can pay for themselves if they can help supercharge real economic growth—and by extension, productivity, margins, corporate earnings, wages, and tax receipts. A productivity growth boom boosts real GDP growth, keeps a lid on inflation, drives up real wages, and widens profit margins.
In fact, in the view of Eric Peters, CEO of One River Capital, "The only practical way to forestall [a sovereign debt crisis in the US] is through a productivity boom that materially lifts non-inflationary growth and repays our policy sins. This is why the US government is all in on the AI buildout. If AI fails to deliver on its vast promises, the risk is far wider than the tech sector. It will lead to a deep recession and massive budget deficits, which will catalyze a debt sustainability crisis....."
Through the end of this decade and likely beyond, I expect to see less low-ROI government spending in favor of more high-ROI capital allocation from an unleashed private sector as the primary engine of organic economic growth through fiscal support like favorable tax policy, deregulation, and other supply-side incentives for reshoring/onshoring to increase productive capacity. We also have a new “hands-off” Federal Reserve under new chairman Kevin Warsh that aims for less market intervention and does not fear that robust economic growth fuels inflation. Instead, Warsh believes as I do that inflation in general is not driven by a strong and productive private economy and free market but by excessive monetary expansion (e.g., QE) and deficit spending (e.g., massive federal spending bills and “helicopter money”), leading aggregate demand to outstrip aggregate supply.
In comparison, China’s heavily controlled “socialist market economy with Chinese characteristics” (pragmatic reforms) is struggling. Its Q2 GDP fell to 4.3%, the lowest growth rate since 2022 during the second pandemic lockdown, supported by solid export demand but offset by weak domestic demand and its structural property slump. It appears to be in a deflationary spiral resulting from a decades-long, debt-fueled construction boom unjustified by the underlying demographic and urbanization trends, leading to “ghost cities” and underutilized “trains to nowhere,” which I have described many times over the years in my posts as a “house of cards.” At its 7/30 meeting, China's Politburo decided against a large, aggressive “bazooka” stimulus package, instead vowing to accelerate existing fiscal spending, encourage regional governments across the country to boost bond fund utilization for infrastructure projects, and roll out targeted "incremental policies" to support its 4.5-5.0% annual growth target.
As former US diplomat James Rogan observed, “America’s greatest economic advantage over China is… deep, transparent, and highly liquid capital markets… Investors from around the world commit trillions of dollars to U.S. stocks, bonds, venture capital funds, and private equity because they have confidence in the rule of law, property rights, financial disclosure, and independent courts. Those resilient institutions lower risk and reduce the cost of capital for American businesses… [In contrast,] China’s financial system remains dominated by state-owned banks that often allocate credit according to political priorities rather than economic merit… The result is a persistent misallocation of capital into unproductive projects, excess industrial capacity, and struggling state-owned enterprises….”
Here at home, in the view of DataTrek Research, the US economy has become almost recession resistant. How? By being more technology-efficient and more services-oriented—meaning less energy-intensive and less at risk of excess inventory buildup (that has to be dumped cheaply into the market, like China does)—and thus less cyclical, with greater worker mobility (e.g., remote and “gig” workers). So, a steadier, more predictable economy enables structurally higher corporate margins, earnings, cash flow, and capex consistency, which supports higher valuation multiples and lower credit spreads, keeps VIX low (below 20), and encourages a consistent buy-the-dip investor mentality. Similar, Ed Yardeni believes we won’t see a US recession this decade.
Final comments:
It goes without saying that moving from an agrarian to industrial society once brought tremendous backlash. The Luddites were textile workers who smashed the mechanized looms. Tailors rioted against the sewing machine. Agricultural laborers destroyed threshing machines. Scribes destroyed new printing presses. Musicians resisted the advent of the “soulless” phonograph. Data entry clerks tried to sabotage early (pre-Excel) programs like Lotus 1-2-3 and VisiCalc.
To me, the AI backlash/alarmism is following the same overwrought, melodramatic path. It also goes hand-in-hand with socialism gaining traction by demonizing capitalism and with the Climate Change movement demonizing fossil fuels. Yes, there are always downsides to any fundamental economic system, or a baseline source of affordable energy, or any technological innovation. But the good overwhelmingly outweighs the bad with capitalism, fossil fuels, and technology—lifting multitudes out of disease and poverty and raising standards of living globally, often providing hope where hope did not exist.
At a House Oversight Committee roundtable on 7/14, energy expert Alex Epstein spoke on the immense promise of AI that cannot be fulfilled if we capitulate to the alarmists and defeatists across the West—and by default, cede the power to China. His comments included, “In the United States, …we have access to abundant energy…[meaning] access to abundant physical work. So, we have all these machines doing work for us all the time. Basically, …75 machines worth of human energy are working on your behalf 24/7. And that’s why we’re so rich in the physical realm, because what energy does is it scales physical work. Now, what most Americans don’t realize is that while they’re wealthy in terms of access to physical work, they’re quite poor in terms of access to mental work….
“And if you look at what really wealthy people do, …one of the things they spend their money on is abundant mental work. So, they’ll get a direct tutor for their child or multiple tutors to get their child ahead. They’ll give one-on-one custom instruction, not just send them to the schoolhouse with 30 kids per teacher… They’ll have a private medical advisor or two, a concierge doctor, and they’ll have medical specialists, and they’ll have specialized veterinarians, and they’ll have psychologists, and they’ll have all of these other things. And then they’ll have assistants who help them plan trips and solve problems and stuff like this….
“This is what AI is making available to everybody... AI is giving you custom teaching, so AI will soon be able to give [personalized] instruction to anybody based on their context. That’s going to be much, much better than almost any teacher in the world very cheaply. And it’s going to give us custom advice where we can get expert advice from the equivalent of medical professionals and psychologists, and… tax advice, …the whole legal system. And in the realm of assisting, you’ll know what it’s like to have a family assistant or a personal assistant or executive assistant, which most people have no idea how convenient that is. And then if we get self-driving cars, then you get, ‘Oh, yeah, I have a driver too.’”
“So, we’re at this phase where most people are really poor in terms of access to mental labor, you could call it access to intelligence. And we have this unbelievable technology [AI] that we are leading in that still needs to evolve a lot to fulfill its potential and that we need to lead in for economic and national security purposes. And yet we’re demonizing it in the same way we did fossil fuels in the sense of not looking at the benefits and then catastrophizing the hazards.”
Furthermore, as famed investor and Technology futurist George Gilder recently enthused, “AI dramatically accelerates the flow of information, reduces the overhead of management, slims organizations, and reduces the capital required to turn an idea into a product or service. The result? We are about to see an explosion in job creation. Jobs will be lost, but many more will be created. To the extent that new job creation is limited by population, the likely outcome will be to shift our human resources to the enterprises that get the most out of their employees, which means employees will get even more out of their employers.”
Amen to both Epstein and Gilder’s statements. Like the internet, electrical grid, highways, railroads, and sanitation systems before it, AI is becoming foundational infrastructure that can make life easier, healthier, safer, and more productive. It reduces both physical and cognitive friction and expands our individual and collective capabilities. But while advancing technology solves scarcity, history shows it cannot ensure fulfillment or contentment.
Latest Sector Rankings
Relative sector rankings are based on Sabrient’s proprietary SectorCast model, which builds a composite profile for each of over 1,500 equity ETFs based on bottom-up aggregate scoring of the constituent stocks. The Outlook Score is a Growth at a Reasonable Price (GARP) model that employs a forward-looking, fundamentals-based multifactor algorithm considering forward valuation, historical and projected earnings growth, the dynamics of Wall Street analysts’ consensus earnings estimates and recent revisions (up or down), quality and sustainability of reported earnings, and various return ratios. It helps us predict relative performance over the next 3-6 months.
In addition, SectorCast computes a Bull Score and Bear Score for each ETF based on recent price behavior of the constituent stocks on particularly strong and weak market days. A high Bull score indicates that stocks held by the ETF recently have tended toward relative outperformance when the market is strong, while a high Bear score indicates that stocks within the ETF have tended to hold up relatively well (i.e., safe havens) when the market is weak. Outlook score is forward-looking while Bull and Bear are backward-looking.
As a group, these three scores can be helpful for positioning a portfolio for a given set of anticipated market conditions. Of course, each ETF holds a unique portfolio of stocks and position weights, so the sectors represented will score differently depending upon which set of ETFs is used. We use the iShares that represent the ten major U.S. business sectors: Financials (IYF), Technology (IYW), Industrials (IYJ), Healthcare (IYH), Consumer Staples (IYK), Consumer Discretionary (IYC), Energy (IYE), Basic Materials (IYM), Telecommunications (IYZ), and Utilities (IDU). Whereas the Select Sector SPDRs only contain stocks from the S&P 500 large cap index, I prefer the iShares for their larger universe and broader diversity.
The table below shows the latest fundamentals-based Outlook rankings and our full sector rotation model:
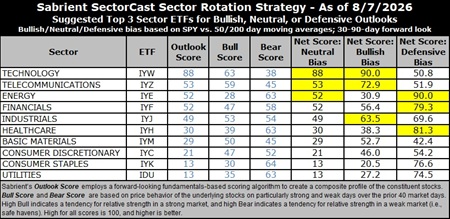
The latest rankings display a bullish bias, in my view, given that cyclicals and secular growth sectors dominate the top of rankings, and defensive sectors are at the bottom. Next 12 months (NTM) analyst earnings forecasts still look quite strong across the board, and investors seem optimistic that impacts from the Iran conflict and shipping blockade are either shrinking or effectively worked around. All but Consumer Staples and Energy have seen recent upgrades to forward estimates.
Technology (dominated by the mega-cap Big Tech titans and AI-driven highflyers) remains firmly at the top with an Outlook score of 88, although this is the first time in quite a while it has fallen below 90. Its continued strength reflects the high quality of those juggernaut cash machines despite having the highest forward P/E at 27.5x, which remains well below the 31x multiple it reached last fall as multiples contract. The consensus NTM EPS growth estimate of +26.4% has risen faster than price such that the forward PEG (ratio of P/E to EPS growth) for Tech is a modest 1.04. Tech also displays strongly positive sell-side analyst earnings revisions (second only to surging Healthcare) and the highest profit margins, return ratios, and insider buying. Although the market is broadening, many investors continue to be willing to pay up for strong, reliable growth.
Because many Tech stocks are riding secular growth trends (i.e., little cyclicality), no other sector comes close to the consistent sales growth, margins, operating leverage, and ROI. And Tech not only benefits from its own product development and productivity gains, but those products help companies in other sectors with their product development, product delivery, and productivity—so Tech benefits by helping all sectors grow and prosper. The main concern right now is whether spending of over 100% of hyperscalers’ massive cash flow on capex will generate sufficient ROI in the near term to placate investors.
Others with a low forward PEG include Telecom (0.94), Energy (0.98), Financials (1.09), and Basic Materials (1.12). As for forward P/E, Energy (12.2x) and Financials (14.5x) are by far the lowest, which is reflective of their cyclicality.
After Tech, the rest of the top 5 sectors are Telecom, Energy, Financials, and Industrials, after which the Outlook scores drop off sharply. At the bottom of the rankings are noncyclical defensive sectors Utilities and Consumer Staples, which have the lowest forward EPS growth rates (the only ones in single digits), among the lowest consensus analyst revisions to EPS estimates, and very little insider buying.
Keep in mind, the Outlook Rank does not include timing, momentum, or relative strength factors, but rather reflects the consensus fundamental expectations at a given point in time for individual stocks, aggregated by sector.
Sector Rotation Model and ETF Ideas
Our rules-based Sector Rotation model, which appropriately weights Outlook, Bull, and Bear scores in accordance with the overall market’s prevailing trend (bullish, neutral, or defensive), returned to a bullish bias when the S&P 500 leapt back above its 50-day moving average last Monday. (Note: In this model, we consider the bias to be bullish from a rules-based trend-following standpoint when SPY is above both its 50-day and 200-day simple moving averages, but neutral if it is between those SMAs while searching for direction, and defensive if below both SMAs.)
As highlighted in the table above, the Sector Rotation model suggests holding Technology (IYW), Telecom (IYZ), and Industrials (IYJ), in that order. Or, if you prefer to take a neutral stance, it suggests holding Technology, Telecom, and Energy (IYE) and/or Financials (IYF). However, if you prefer a defensive stance, it suggests holding Energy, Healthcare (IYH), and Financials.
Here is an assortment of other interesting ETFs that are scoring well in our latest rankings: Golden Eagle Dynamic Hypergrowth (HYP), VistaShares Artificial Intelligence Supercycle (AIS), iShares AI Innovation and Tech Active (BAI), Columbia Select Technology (SEMI), Aztlan Global Stock Selection DM SMID (AZTD), Xtrackers Semiconductor Select Equity (CHPS), SP Funds S&P Global Technology (SPTE), iShares Technology Opportunities Active (TEK), Technology Trusector (TRUT), VanEck Junior Gold Miners (GDXJ), AOT Growth and Innovation (AOTG), Inspire Fidelis Multi Factor (FDLS), Global X AI Semiconductor and Quantum (CHPX), Invesco AI and Next Gen Software (IGPT), Guiness Atkinson Smart Transportation & Technology (MOTO), First Trust Active Factor Small Cap (AFSM), Alger Russell Innovation (INVN), iShares Semiconductor (SOXX), Invesco S&P 500 Momentum (SPMO), Zacks Small/Mid Cap (SMIZ), CapForce IBD 50 (FFTY), and First Trust RBA Deglobalization (DGLO). All score in the top decile (90-100) of Sabrient’s Outlook scores.
As always, I welcome your thoughts on this article! Please email me anytime. Any and all feedback is appreciated. Also, please let me know of your interest in any of Sabrient’s new indexes for ETF investing, such as High-Quality Energy, High-Quality Healthcare, Defensive Equity, High-Quality SMID Growth, High-Quality Growth & Income, and High-Quality Value, as well as the actively managed Space Exploration & Off-Earth Sustainability, Future Energy, and Sabrient Select High-Conviction Portfolio (similar to our Baker’s Dozen portfolio, but larger).



Comments
Log in or sign up to join the conversation.