
Is The Market Finally Ready For A Value Rotation?

Image Source: Pixabay
The latest CPI report coupled with the stagnant jobs market essentially gave the FOMC license to continue its rate cutting cycle this week, and fed funds futures now give highest odds for three more 25-bp cuts over the next 12 months. Historically, rate cuts give an outsized boost to growth over value stocks. But this time might be a bit different given the lengthy stretch of outperformance of growth over value and large over small caps, driven by the Big Tech juggernauts, as investors have anticipated a more accommodative Fed for a long time. After several sporadic attempts, could the market finally be ready for sustained market rotation? Let’s explore.
Interest rate cuts provide a favorable backdrop for stocks in general, by stimulating business and consumer borrowing and encouraging investment in risk assets. While growth stocks are more advantaged by interest rate cuts through valuation (i.e., a falling discount rate on long-duration cash flows), value stocks are more advantaged through fundamentals (i.e., lower borrowing costs and rising consumer demand) because they are often capital intensive and/or cyclical.
To be sure, even with “higher for longer” interest rates, investors have been quite willing to pay up for all that Big Tech has to offer as they ride strong secular growth trends (i.e., little cyclicality) in disruptive innovation that create rising sales growth, margins, operating leverage, cash flow, ROIC, insider buying—at levels no other sector can match. With little to no concern about the level of interest rates, these cash-flush juggernauts have wasted no time in their race for supremacy in new technologies like AI, quantum computing, robotics, automation, cloud computing, cybersecurity, 3D printing, fintech, precision medicine, genomics, space exploration, and blockchain.
This has driven the major cap-weighted indexes to lofty heights, with 10 companies in the $1 trillion market cap club. And this week, Microsoft (MSFT) and Apple (AAPL) joined NVIDIA (NVDA) in the exclusive $4 trillion market cap club, while NVIDIA just surged past the $5 trillion mark!
From the April 7th lows, retail investors flipped from tariff panic to FOMO/YOLO/momentum, and the rest of the investor world jumped onboard. Besides Big Tech, speculative “meme” stocks also have been hot, and AQR’s Quality-minus-Junk factor (aka “quality margin”) has been shrinking. Moreover, small caps have been participating, as evidenced by the Russell 2000 Small-cap Index (IWM) and the Russell Microcap Index (IWC) both setting new all-time highs in October (for the first time since 2021), which is a historically bullish signal. Similarly, value stocks also have perked up, with the Invesco S&P 500 Pure Value ETF (RPV) and S&P 500 Value (SPYV) also reaching new highs.
However, while retail investors have continued to invest aggressively, institutional investors and hedge funds (the so-called “smart money”) have grown more defensive. So, maintaining a disciplined approach—such as focusing on fundamental analysis, long-term trends, and clear investment goals—can protect against emotional kneejerk reactions during murky or turbulent periods.
Stock valuations are dependent upon expectations for economic growth, corporate earnings, and interest rates, tempered by the volatility/uncertainty of each—which manifests in the equity risk premium (ERP, i.e., earnings yield minus the risk-free rate) and the market P/E multiple. Some commentators suggest that every 25-bp reduction in interest rates allows for another 1-point increase in the P/E multiple of the S&P 500. But regardless, the expected rate cuts over the next several months might already be baked into the current market multiple for the S&P 500 and Nasdaq 100 such that further gains for the broad indexes might be tied solely to earnings growth—driven by both revenue growth and margin expansion (from productivity and efficiency gains and cost cutting)—rather than multiple expansion.
As such, although near-term market action might remain risk-on into year end, led by growth stocks, the case for value stocks today might be framed as countercyclical, mean reversion, portfolio diversification, and market broadening/rotation into the neglected large, mid, and small caps, many of which display a solid earnings history and growth trajectory as well as low volatility and less downside risk. Value investors can avoid paying the Tech-growth premium. And given their more modest valuations, they also might have greater room for multiple expansion.
So, perhaps the time is ripe to add value stocks as a portfolio diversifier, such as the Sabrient Forward Looking Value Portfolio (FLV 13), which is offered annually as a unit investment trust by First Trust Portfolios—and remains in primary market only until November 14th.
In addition, small caps tend to benefit most from lower rates and deregulation, and high-dividend payers become more appealing as bond alternatives as interest rates fall, so Sabrient’s quarterly Small Cap Growth and Dividend portfolios also might be timely as beneficiaries of a broadening market—in addition to our all-seasons Baker’s Dozen growth-at-a-reasonable-price (GARP) portfolio, which always includes a diverse group of 13 high-potential stocks, including a number of under-the-radar names identified by our models.
Let me discuss three key drivers that might make the heretofore sporadic attempts at market rotation into value and smaller caps more sustainable:
1. Mean reversion on relative valuation:
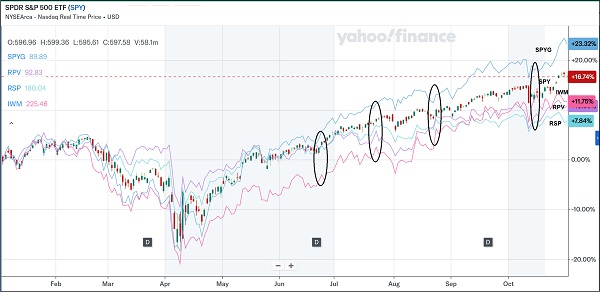
While major indexes like the S&P 500 (SPY) and Nasdaq 100 (QQQ) have soared on the backs of those mega-cap, Big-Tech, secular-growth juggernauts, the broader market is trading at far more reasonable valuations. Witness this YTD chart of the cap-weight SPY versus S&P 500 Growth (SPYG), Russell 2000 Small Cap (IWM), S&P 500 Pure Value (RPV), and equal-weight S&P 500 (RSP). Despite some short spurts of convergence attempts (as circled), most recently the divergence has reached its widest of the year.
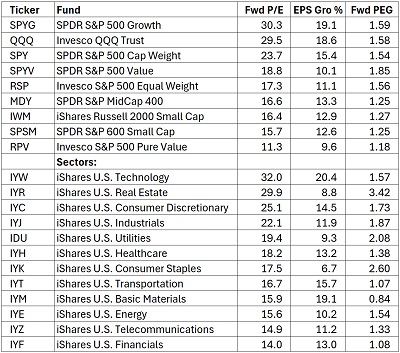
In addition to the performance divergence, relative valuations (large vs. small, growth vs. value, and the Tech sector vs. all others) have become quite stretched, and there have been intermittent signs of a nascent broadening market and rotation from the mega-cap dominators into other large, mid, and small caps, value stocks, and lagging sectors. The table below compares forward P/E, expected next-12-months (NTM) earnings growth rate, and forward PEG (P/E divided by earnings growth rate) for various market-segment proxy ETFs, listed in descending order of P/E:
According to DataTrek Research, “S&P 500 valuations have reached levels that cannot be justified solely by reasonable expected earnings growth in 2026/2027.Structural profitability must improve as well.Current Street estimates imply a 13.7% net profit margin in 2026, substantially better than Q2 2021’s peak of 13.0%.”
The “Buffett Indicator,” which measures the ratio of Total Market Capitalization to GDP, is rated “significantly overvalued” at an all-time high of 225%, having risen 60 pps since the April lows. The S&P 500 trailing 12-month P/E is around 26x, and the Shiller cyclically adjusted P/E ratio (CAPE), based on trailing 10-year earnings, is now at 40x and officially back to dot-com era levels (which peaked at 44x). However, P/E and CAPE (cyclically adjusted P/E) can be misleading due to the differences in business models, capital intensity, growth rates, and sector concentrations within the S&P 500 throughout the past decades. But price-to-sales (P/S) is less so—and the S&P 500 is selling at nearly 3.5x P/S, which is double the median of the past 25 years of 1.7x.
Of course, other factors are at play for any valuation metric in determining a “fair” value, such as the level of interest rates that inform the appropriate discount rate on future sales, earnings, and cash flow—and interest rates are falling. And then of course, today’s Tech companies are more fundamentally sound, profitable, cash-flush, and sporting higher return ratios than during the dot-com era. And the index overall reflects more secular growth and less cyclicality—especially when compared to the industrial conglomerates and oil companies that previously held the largest market caps as recently as 2013, when Exxon Mobil was still competing with Apple for the top spot. As DataTrek Research has opined, the continued appeal of US large caps “is grounded in the idea that current earnings power, interest rates, and long-term earnings growth are all highly predictable and will remain so for the foreseeable future.”
Nevertheless, the relative valuation divergences cannot be ignored. Many smaller value names have been neglected during this AI-driven growth boom, with the spread between top-decile growth and bottom-decile value stocks near an historic high, which historically has led to a mean-reversion market rotation and broadening into those lagging segments to narrow the valuation spread (with the broad market indexes continuing to climb higher), rather than a stock market crash from a capital rotation into bonds and cash.
Lastly, value has historically outperformed after previous periods of high concentration in a handful of stocks, as relative valuations normalize. For example, the Nifty Fifty in the early 1970s, the dot-com bubble in the late 1990s, and the FAANG-driven rallies of 2018–2021 all saw a subsequent multi-year outperformance of value over growth.
2. Diversification of portfolios that have become heavily tilted to growth:
Value stocks in this market provide a number of diversification benefits. Sectors like Consumer Staples, Energy, Financials, and Healthcare provide more defensive positioning for investors wary of market volatility and the lofty valuations of growth stocks. Value stocks are less exposed to earnings disappointments, particularly given the lofty expectations for earnings and margin growth already priced into most of the leading growth stocks—especially those with the AI tailwind, as the massive capital investments have a lot of future profits yet to prove out.
One goal of the Fed’s rate cuts is to stimulate borrowing, spending, and investment, leading to broader economic activity, which would tend to help cyclical and value sectors—such as Industrials, Materials, and Financials—which typically benefit when the economy picks up.
If we have a climate of moderate real GDP growth (say, 2-3%) and broader earnings improvement (beyond the mega-caps), value stocks and smaller caps should benefit from widening participation. Also, value companies typically generate strong current cash flow and pay dividends, making them more resilient if the Fed decides to hold rates steady and liquidity growth is constrained. They offer lower duration risk, less downside/drawdown if the market experiences multiple compression, and thus valuable diversification benefits.
3. Sticky inflation can benefit real assets and cyclical/value sectors:
I believe inflation will moderate further due to the many global disinflationary secular trends like aging demographics, ongoing globalization (despite some strategic onshoring and supply chain diversification), deregulation, technological disruption, automation, and rising productivity. However, maintaining somewhat elevated inflation (closer to 3% than 2%) may well be a tactic to help reduce our massive federal debt—as part of a 3-prong approach along with strong economic growth and reduced (or at least stable) federal spending.
Elevated inflation and interest rates along with strong real GDP growth would likely conspire to boost real asset prices, which would benefit cyclical and value sectors, particularly Energy, Real Estate, and Materials. Energy and commodity producers also benefit from geopolitical tension, supply constraints, and decarbonization bottlenecks. In the Financials sector, banks and insurance companies can see margin expansion when yield curves steepen. And Industrials and Utilities benefit from infrastructure upgrades, factory onshoring, capex cycles, and construction of AI datacenters and new power plants (as power generation demand rises).
So, value investing aligns with reflation of real assets (as opposed to financial assets), which might persist throughout this decade. In any case, diversification across sectors, industries, market caps, and value versus growth can help manage risk while still capturing growth opportunities.
Summary:
Today, we have a growing economy with modest inflation, robust corporate earnings and rising forward guidance, falling interest rates and substantial liquidity from an increasingly accommodative Federal Reserve, tight credit spreads, and low volatility in both stocks and bonds/interest rates—resulting in an ultra-low ERP and a historically high market P/E multiple. The case for value stocks rests on the historic valuation divergences (for growth vs. value, large vs. small caps, and Tech vs. all other sectors), as well as macro shifts, historical mean reversion, and diversification for heavily growth-tilted portfolios. While the headline valuation multiples of the broad cap-weight indexes look stretched—some might say “priced for perfection”—value is one of the segments in which forward returns still look attractive.
A disciplined value investing strategy might emphasize:
- Equal-weight or fundamental index funds rather than cap-weight benchmarks
- Sector-specific tilts toward Energy, Financials, Industrials, Consumer Staples, and selected Materials
- Quality/value screens to identify strong balance sheets, free cash flow, and dividends
- Small- and mid-cap allocations, where the valuation divergence is widest
Indeed, rather than the pricey cap-weighted indexes dominated by Big Tech, investors may be better served in today’s market by active stock selection that seeks under-the-radar and undervalued gems primed for explosive growth. This is what Sabrient aims to do in our various Growth, Value, Dividend, and Small Cap portfolios, all of which provide exposure to growth, value, quality, and size factors and to both secular and cyclical growth.
In selecting our Baker’s Dozen, Forward Looking Value, Dividend, and Small Cap Growth portfolios, Sabrient’s multifactor models and selection process prioritize fundamental quality, which is a timeless characteristic to which even the most speculative market always (eventually) reverts. In addition, our cash-flow and balance-sheet oriented Earnings Quality Rank (EQR) is a key factor used in all our internal models and is also licensed to the First Trust Long-Short ETF (FTLS) as a quality prescreen.
As always, I welcome your thoughts on this article. Please email me anytime. All feedback or questions are appreciated!
More By This Author:
Stocks Enter Q4 With Fed, Tax, Earnings, And AI Tailwinds, But Also Lofty Valuations
The Future Of Energy Is Nuclear – Part 3
The Future Of Energy, The Lifeblood Of An Economy - Part 2
Disclosure: At the time of this writing, of the securities mentioned, the author held positions in SPY and FTLS.
Disclaimer: Opinions expressed are the author’s alone and do not ...
more

