
Stocks Enter Q4 With Fed, Tax, Earnings, And AI Tailwinds, But Also Lofty Valuations

Image Source: Pixabay
Well, the FOMC followed the script and cut the fed funds rate (FFR) by 25 bps (from 4.25-4.50% range down to 4.00-4.25%) in an 18-1 vote. It was the first rate cut since December of last year—even though the rate needs to be 100 bps lower, in my view, as I have been advocating for quite some time, given the prior overreliance on government spending and hiring giving way to the growing impact of elevated rates on private sector growth and hiring, particularly within rate-sensitive industries. No more government largesse means the Fed must get busy with rate cuts. Market breadth was already improving in anticipation of the Fed’s dovish turn, with market segments like small caps, value stocks, banks, and transports perking up.
Although this was a relatively tepid move by the FOMC rather than the full-throated declaration of a new easing cycle that is needed, Fed chair Jerome Powell still believes monetary policy has officially shifted from "modestly restrictive" (his words at the July meeting) to "more neutral” today and characterized the latest rate cut as a "risk management" decision in light of slowing economic activity and jobs growth on the one hand, offset by sticky inflation on the other, which I discuss in greater depth in today’s post.
Of course, slashing FFR even 50 bps would give a panicky signal to the market, so newly appointed Fed Governor Stephen Miran was the lone dissenter, favoring 50 bps. Instead, they will proceed with gradual cuts on a steady path to eventually arrive at its long-term goal of a terminal FFR around 3.00% (2% inflation plus 1% neutral rate, aka “r-star”). The CME futures market now reflects 86% odds of two more 25-bp cuts this year (75 bps total for the year, bringing FFR down to 3.50-3.75%) and 78% odds of another two cuts next year (down to 3.00-3.25%)—as well as 50% odds of three cuts next year, despite the Fed’s own dot plot of two 25-bp cuts this year and just one in 2026. In my view, this will lead to more consumer spending, business borrowing for investment/capex, earnings growth, and stock buying (including retail, institutional, and share buybacks).
In response, the major indexes surged to new highs yet again. Any attempt at a pullback has been nothing more than an overbought technical correction/consolidation, as enthusiasm grows around the promise of AI revolutionizing our lives, workplace, and society at large, leading to rising productivity and prosperity. However, while we await the fully ripened fruits of these rapidly advancing technologies, stock gains have been driven more by multiple expansion in anticipation of great things to come, as well as a weaker dollar and surprisingly strong earnings growth—albeit driven more by cost-cutting and productivity growth than revenue growth, with net margins closing in on their 2021 peak of 13%.
Thus, lofty stock valuations and tight corporate bond spreads suggest an expectation that profitability and ROIC will remain strong for the foreseeable future despite the many storm clouds (such as geopolitical threats, ongoing hot wars, tariffs and unresolved trade negotiations, struggling global trading partners, sticky inflation metrics, weak jobs growth, social strife, and now a federal government shutdown). In fact, rather than investor fear manifesting in falling stock prices and rising market volatility, it instead seems to be reflected in the price of gold and silver, which have been surging.
Back in June, Mike Wilson of Morgan Stanley asserted, “we identified 4%-4.5% [on the 10-year yield] as the sweet spot for equity multiples, provided that growth and earnings stay on track.” Similarly, Goldman Sachs saw 4.5% acting as a ceiling for stock valuations. Wilson identified four factors that he believes would sustain market strength: 1) a trade deal with China (which China desperately needs sorted out), 2) stabilizing earnings revisions, 3) a more dovish Fed (i.e., rate cuts), and 4) the 10-year yield below 4% (without being driven by recessionary data). Indeed, all four have shown good progress.
From the 4/7 lows, retail investors flipped from tariff panic to FOMO/YOLO, and the rest of the investor world has jumped onboard. Speculative “meme” stocks have been hot, and AQR’s Quality-minus-Junk factor (aka “quality margin”) has been shrinking. Moreover, small caps have been surging, as evidenced by the Russell 2000 Small-cap Index (IWM) setting new all-time high last week (for the first time since 2021), which is a historically bullish signal, and the Russell Microcap Index (IWC) has done even better. Similarly, value stocks also have perked up, with the Invesco S&P 500 Pure Value ETF (RPV) also reaching a new high, and the transports, like the iShares Transportation ETF (IYT), seems bent on challenging its highs from last November.
The broad market was long overdue for a healthy broadening to bolster bullish conviction, and indeed it appears the ducks finally lined up to support it. This broadening bodes well for further upside as capital merely rotates rather than leave the market entirely. The Carson Group has observed that for every time since 1980 that the Fed cut rates while the market was within 2% of an all-time high (21 instances), stocks continued to rise over the ensuing 12 months. As Eric Peters of One River Asset Management opined, “There is no appetite for austerity within either party, so their preference is for inflation-resistant assets, which [suggests]…stocks, gold, bitcoin.”
Overall, there is no magic here, the setup is bullish for stocks, with improving market breadth (i.e., wider participation), as we enter Q4. But that’s not to say we won’t get a pullback in the near term. Chart technicals show a relative strength index (RSI) that has been in overbought territory for a historically long time, but I think any significant pullback would be a buyable event. So, following two solidly bullish years, I think this year also will finish strongly, with a potential third-straight 20%+ year (total return, assuming dividends reinvested) in the crosshairs. But the cautionary tale is that, while not unprecedented, a third straight 20%+ year has only happened once before in the past 100 years, during 1995-99, i.e., when it ran for five straight years during the dot-com boom (followed of course by the dot-com bust). Also, while I expect longer-duration yields (and by extension, mortgage rates) to eventually recede, be careful about jumping too aggressively into them, as elevated yields might remain sticky until federal debt and inflationary pressures have shown that they are indeed moderating, as I expect they will by early next year.
Although corporate insider buying has been weak, share buybacks have already set an annual record and are on track to hit $1.1 trillion by year end. Also, investor appetite for IPOs has returned in force, with 259 IPOs on US exchanges through Q3 2025, which is up 75% versus the same point in 2024, reflecting an abundance of both investor optimism and liquidity. And Electronic Arts (EA) is officially going private in the largest leveraged buyout (LBO) in history, at $55 billion.
Furthermore, the Atlanta Fed’s GDPNow Q3 forecast has risen to 3.8% (as of 10/1), interest rates are coming down across the curve, the US economy is holding up, corporate earnings momentum remains strong, the CBOE Volatility Index (VIX) remains low, the Global Supply Chain Pressure Index (GSCPI) remains at or below the zero line (i.e., its historical average), global liquidity and M2 growth is modest/supportive, new tax rates and deregulation from the One Big Beautiful Bill Act (OBBBA) are supportive and stimulative, exciting new technologies are accelerating, strategic reshoring and supply chain redundancies are underway (but not total deglobalization), and secular disinflationary trends and productivity growth have resumed. The only thing missing is a fed fund rate (FFR) at the neutral rate—which is around 3.0%, in my view.
However, as I discuss in my full post below, cautionary signals abound, so investors should be tactically vigilant in this environment of rising valuation multiples, overbought technicals, sluggish corporate revenue growth (with strong earnings growth based on margin expansion from productivity growth and cost-cutting), rising bankruptcies and delinquencies, and falling Leading Economic Indicators by focusing on high-quality companies and diversification (across sectors and asset classes) while holding hedges (like protective put options or inverse ETFs).
Top-ranked sectors in Sabrient’s model include Technology, Financials, Industrials, which all seem poised to benefit from stimulus and domestic-capex tailwinds. With the 10-2 and 30-2 Treasury yield spreads currently at 56 bps (4.10-3.54%) and 117 bps (4.71-3.54%) respectively—the highest since early 2022—the steepening yield curve should be favorable for regional banks, which borrow short and lend long (so a higher spread leads to higher profits). Also top-ranked in our model is Healthcare based mostly on valuation, and it indeed might be a sleeper opportunity, as (according to DataTrek Research) “US large cap Healthcare has lagged the S&P 500 by more than 4 standard deviations, a level of underperformance we’ve never seen in a major sector.” And while Energy sits at the bottom of our Outlook rankings, the sector also has earned consideration based on firmer oil prices and disciplined capital plans.
In picking our portfolios, the Sabrient team focuses on fundamental quality—starting with a robust quantitative growth-at-a-reasonable-price (GARP) model followed by a detailed fundamental analysis and selection process—in selecting our Baker’s Dozen, Forward Looking Value, Dividend, and Small Cap Growth portfolios, which are packaged and distributed as UITs by First Trust Portfolios. By the way, the new Small Cap Growth (SCG 48) portfolio launches on Friday 10/3, so 10/2 is the final day to get into SCG 47, which is off to a good start, led by SSR Mining (SSRM) and Mercury Systems (MRCY) among its 44 holdings. The Q3 2025 Baker’s Dozen has also started off well, led by Sterling Infrastructure (STRL) and Valero Energy (VLO) among its 13 concentrated positions, as has our annual Forward Looking Value (FLV 13) portfolio. In fact, most of our 20 live portfolios are doing well versus their relevant benchmarks. Again, value and small caps seem like good ideas for a broadening market.
Notably, our proprietary Earnings Quality Rank (EQR) is a key factor used in our internal models, and it is also licensed to the actively managed First Trust Long-Short ETF (FTLS) as a quality prescreen. In fact, you can find our EQR score along with 8 other proprietary factor scores for roughly 4,000 US-listed stocks in our next-generation Sabrient Scorecards, which are powerful digital tools that rank stocks and ETFs using our proprietary factors.
In today’s post, I discuss Fed policy, the modest inflationary pressures, the weak private sector jobs market, solid-but-fragile economic growth outlook, lofty stock valuations, and the case for value and small caps given emerging monetary and fiscal support. I also reveal Sabrient’s latest fundamental-based SectorCast quantitative rankings of the ten U.S. business sectors, current positioning of our sector rotation model, and several top-ranked ETF ideas.
Market Commentary
Recall that when the Fed first cut rates in the current cycle by 50 bps in September 2024, the 10-year Treasury yield didn’t fall but actually surged, rising a total of roughly 100 bps to 4.80% by January. This caused a massive jump in term premium and real rates, largely due to a combination of falling demand from foreign central banks (to support their currencies, and for some, to avoid the risk of US government sanctions) and the “bond vigilantes” boycotting Treasury purchases in protest of rising federal debt and easier monetary policy in a firming economy that they believe will lead to stickier inflation. But for most of 2025, the 10-year yield has stabilized, at least partly due to foreign private investment. Notably, despite falling by over 10% relative to a basket of currencies during H1 2025, the dollar has stabilized during Q3, helping to draw in more of that foreign private capital.
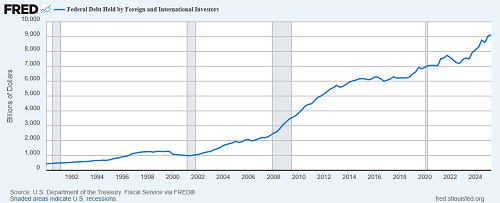
To be sure, foreign central bank demand can’t recede for long. As shown in the chart below, foreign ownership continues to rise along with GDP and stock markets as central banks rely on the stability and relatively higher interest payments of dollar reserves and US Treasuries to conduct international trade.
However, despite the slight uptick in longer-duration yields following the latest Fed policy announcement, the general decline in yields this year (with the 10-year falling from 4.80% on 1/13 to about 4.10% on 10/1) has been a market signal that rates need to be lower to relieve overburdened borrowers (including our federal government) in a highly indebted economy, incentivize business borrowing for business expansion and hiring, and resurrect the dormant housing market by lowering mortgage rates (hopefully back toward the 5.0% mark on the 30-year). As Real Investment Advice has opined, “…if interest rates drop by just 1%, this could reduce [federal] spending by $500 billion annually, helping to ease fiscal pressures, [and] the coming strategic investments, workforce development, and sustainable energy policies could improve economic outcomes while resolving deficit concerns.”
Commercial mortgage-backed securities (CMBS) delinquency rates now exceed levels not seen since the Great Financial Crisis, signaling significant stress across property markets as they face the one-two punch of a “debt maturity wall” coupled with lower property values. Weakness is greatest among office properties as you might expect, but with normally stable multifamily properties (e.g., apartment buildings) showing rapid deterioration. Strength is greatest among industrial and (perhaps surprisingly) retail.
In addition, there are rising delinquency rates on credit cards and auto loans, particularly among lower-income households. And with the 30-year fixed mortgage rate today around 6.3%, home affordability is still an issue. Although well down from its January high of over 7%, it needs to be closer to 5% to truly support the critical housing market. According to Apollo Global Management, overall affordability is near an historic low dating back to the 1980s, which suppresses the “wealth effect” for consumption.
Without the crutch of the previous profligate government spending and hiring, the stagnant private sector (other than AI-related spending) hasn’t been able to carry the ball in the face of the Fed’s quantitative tightening (i.e., balance sheet reduction and onerous interest rates) and the uncertainty of future fiscal policy, e.g., tax rules and deregulation. Fortunately, the Fed is softening (although still restrictive) and the One Big Beautiful Bill Act (OBBBA) has now codified tax policy and deregulation. Global liquidity would be enhanced through lower interest rates and a weaker dollar, which would support US and global economies, allow other central banks to inject liquidity and avoid having to raise their relatively lower interest, reduce the odds of a global recession and/or credit crisis, and relieve indebted consumers and businesses.
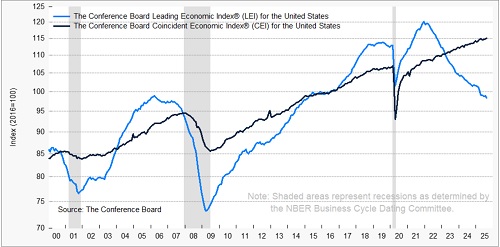
However, cautionary signals abound. Although smaller government would be expected to encourage private sector expansion, increased economic activity, and prosperity over time, in the short term, reduced fiscal stimulus may pose challenges. Also, the ISM Manufacturing Index for August was below 50 (contraction) for the 7th straight month. The Conference Board Consumer Confidence Index showed “a sharp deterioration” in September falling to 94.2 (from 97.8 in August). And, as shown in the chart below, The Conference Board Leading Economic Index (LEI) has been falling since 2022, triggering a recessionary signal in August, with continued slowing in economic activity given negative contributions from tariffs and the yield curve.
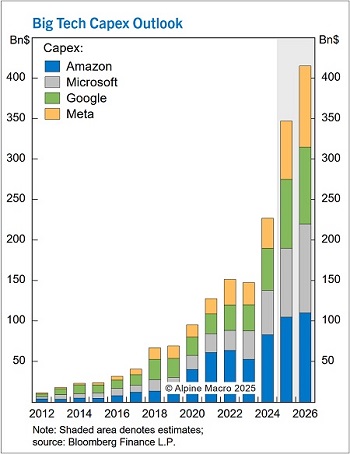
Although hiring has stalled (as I discuss later), economic growth and earnings continue to look good, driven by AI mania and associated capex spending. Indeed, spending on AI infrastructure and applications is soaring, with 2025 global AI capex outlays of $414 billion, and spending on AI in 2026 projected to be $432 billion. The hyperscalers are pouring hundreds of billions annually into AI infrastructure, with forecasts in the range of $1-3 trillion in AI-related capex by the end of the decade, and perhaps as much as $5 trillion over the next 10 years. Regardless, this is shaping up to be the fastest buildout and largest allocation of corporate capital in history for what is expected be the most transformational technology in history, massively impacting businesses, households, and society at large.
An article in Bloomberg observed, "Tech companies have raised about $157 billion so far this year in the US public bond markets alone, up some 70% from what they issued in the same period last year, with Oracle leading the way with nearly $26 billion of publicly traded debt sold. The appetite for investment-grade bonds is so strong that spreads have been pushed to near their lowest in 27 years."
OpenAI's ChatGPT has more than 700 million users each week. NVIDIA (NVDA) chips are sold out for months, and it announced a $5 billion investment in Intel (INTC). In addition, according to the WSJ, “Nvidia and OpenAI, two U.S. giants powering America’s race for AI superintelligence, outlined an expansive partnership…including plans for an enormous data center buildout and a $100 billion investment by the chip maker into the startup. The deal announced Monday will allow OpenAI to build and deploy at least 10 gigawatts of Nvidia systems for its artificial-intelligence data centers to train and run its next generation of models. That amount of electricity is roughly comparable to what is produced by more than four Hoover Dams or the power consumed by eight million homes.” Oracle (ORCL) shares surged 36% on the day it reported that remaining performance obligations (aka RPO, which measures contracted revenue not yet recognized) jumped 359% from a year earlier to $455 billion, with a projection of recurring cloud infrastructure revenue rising from $10.3 billion this year to $144 billion by 2030. The company just signed four multibillion-dollar contracts, including a massive contract with OpenAI/Stargate.
Increasingly complex and power-hungry models are driving demand for semiconductors, datacenters, and energy production—including energy-dense nuclear power, as I discussed in my 3-part blog series on the “Future of Energy, the Lifeblood of an Economy” in August. Investors in AI and quantum computing envision solutions to our most intractable problems like cancer cures, ending world hunger, reversal of climate change, commercializing clean/cold nuclear fusion, fail-safe cybersecurity, and enhanced national security.
A Piper Sandler CIO survey in July found IT spending growth estimates of 3.4% in 2025 and 4.8% in 2026, with 85% of CIOs expecting IT budgets to keep rising. This chart from Alpine Macro illustrates the amazing surge in Big Tech capex we are seeing already plus projections for 2026, much of which is related to AI and datacenters.
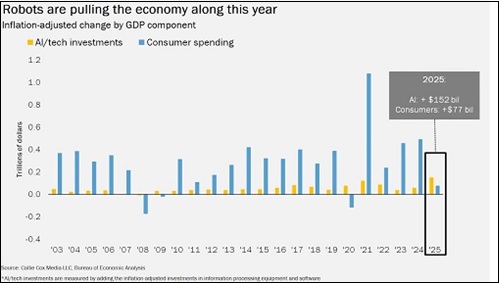
According to Josh Brown of Ritholtz Wealth Management, “The chart below shows that AI-related capital spending has been carrying the economy while consumer spending has been soft…. History shows that every major productivity leap, from railways to the internet, started with a burst of business investment before broader job and wage growth followed…. If AI accelerates efficiency and unlocks new markets, it can absolutely carry economic growth through a slow patch until the benefits ripple out and bring the human economy along with it.”
As renowned technology futurist, economist, fund manager, and supply-side capitalist George Gilder has pointed out, “The World Economic Forum’s Light House Factory network, aided by McKinsey & Company, embraces factories that use ‘Fourth-Industrial-Revolution’ technology such as AI/analytics, digital twins, advanced robotics, and the Intelligent Internet of Things, not for pilot projects, but at scale and showing a measurable impact on productivity, resilience, and customer satisfaction.” A digital twin is an exact virtual replica of a manufacturing facility to test ideas and “identify optimal processes and reduce capital expenditures…. Reports so far suggest productivity growth on the order of 40% and increasing over time… [leading to] a US manufacturing renaissance.”
The two keys for continued investment, economic growth, and global prosperity are: 1) abundant reliable/affordable energy and 2) abundant global liquidity. Regarding liquidity, Michael Howell of CrossBorder Capital (and “Capital Wars” on Substack) observed, “Global liquidity [remains] high and stable at US$184.7 trillion, with annual growth of 5.6% and a strong three-month annualized rate of 9.9%. Liquidity is supported by China’s PBoC injections and falling bond market volatility, but tempered by a recovering US dollar, Fed tightening, and slower Bank of Japan growth.” This positive liquidity climate continues to support prices of risk assets and mitigates underlying concerns about debt deflation, which Howell explains, “occurs when falling prices make debt harder to repay, leading to defaults, distress selling of assets, reduced money supply, reduced spending, and a contractionary spiral that can trigger a recession or depression.”
Importantly, Howell has long argued, “A nation that successfully attracts liquidity strengthens its currency, lowers its borrowing costs, and fuels investment in its technology and companies, creating a self-reinforcing cycle of economic and financial dominance”—which the US continues to do.
I read an interesting post on 7/16 by tech futurist George Gilder entitled, "Trump: Reagan's True Heir." He believes that both Reagan’s personal income tax rate cuts and the capital gains tax cuts enhanced after-tax returns on investment led to a surge in corporate earnings and stock prices while calming inflation, but the impact of capital gains taxes on ROI was more profound. He concludes, "Tariffs have not outweighed the beneficial impacts of tax policy for decades and they are unlikely to do so under Trump. His preservation of the tax cuts in the One Big, Beautiful Bill (OBBB) will prove far more important than anything he might do on the tariff front… The combination of meaningful tax rate reductions, deregulation, especially in the energy sector, and the growing economic power of AI points to good news for investors for years to come. Take advantage.”
Stock valuations:
With stocks making new highs yet again last week, let’s look at sentiment. Is it irrationally exuberant? The CNN Business Fear & Greed Index is an equal-weighted compilation of seven different indicators that measure some aspect of stock market behavior, including market momentum, stock price strength, stock price breadth, put/call ratio, junk bond demand, market volatility, and safe haven demand. It tracks how much these individual indicators deviate from their averages compared to how much they normally diverge. The index is presented much like Sabrient’s Earnings Quality Rank (EQR) in that it computes an integer score from 0 to 100 (with 100 representing maximum greediness and 0 signaling maximum fear) and further groups them into five quintiles. For CNN, the quintiles are Extreme Fear, Fear, Neutral, Greed, and Extreme Greed. Its current score has fallen to 53, which puts it in the Neutral range, after previously scoring 63, which was in the middle of the Greed range.
As for the weekly AAII Sentiment Survey of individual investors, after seven straight weeks of bearish bias, the latest reading (9/24) is roughly equal at 42% bullish and 39% bearish. So, there is no obvious conviction from these sentiment metrics.
S&P 500’s CAPE ratio (P/E based on trailing 10-year earnings) is now 40x, officially back dot-com era levels (which peaked at 44x). But while P/E and CAPE (cyclically adjusted P/E) can be misleading due to the differences in business models, capital intensity, growth rates, and sector concentrations within the S&P 500 over time, price-to-sales (P/S) is less so. And according to WSJ, the S&P 500 is selling at 3.23x sales, versus a median over the past 25 years of 1.7x. Of course, other factors are at play for any valuation metric in determining a “fair” value, such as current interest rates and the discount rate on future sales, earnings, and cash flow—and interest rates are expected to come down. And of course, today’s Tech companies are more fundamentally sound, profitable, cash-flush, and with higher return ratios than during the dot-com era. As DataTrek Research has opined, the continued appeal of US large caps “is grounded in the idea that current earnings power, interest rates, and long-term earnings growth are all highly predictable and will remain so for the foreseeable future.”
Nevertheless, the “Buffett Indicator,” which measures the ratio of Total Market Capitalization to GDP, is approaching an all-time high of 220%, having risen 55 pps since the April lows. Of course, the surge in mega caps is the main driver, with 10 companies in the $1 trillion market cap club, including the original MAG-7 plus newer members Broadcom (AVGO), Warren Buffett’s own Berkshire Hathaway (BRK-B), and (most recently) Taiwan Semiconductor (TSM). At $4.5 trillion, NVIDIA is now bigger than the entire equity markets of five of the seven G7 countries—Italy, Germany, France, UK, and Canada—with only the US and Japan equity markets being larger.
Notably, the S&P/Gold price ratio was 5.0x at the peak of the dot-com bubble but is just 1.7x now, which reflects the strong performance of gold. Although the S&P 500 has risen roughly +730% over the past 25 years, gold has surged much more at nearly +1200%. But it’s the Dow/Gold ratio that is the subject of the old rule of thumb, “When the ratio goes below 5, buy stocks; when it goes above 15, sell stocks.” At its dot-com peak, it was 45x, but today, the Dow/Gold ratio sits at just 12x. Eric Peters commented, “It’s a rather stark indictment of the system, when an inert metal outperforms the 500 biggest public companies in the best performing major economy in the world over a quarter century.” (See my Final Comments section for more on this situation from Peters.)
The Financial Times recently observed, prudent investment management like that of Warren Buffett tends to be punished during risk-on market rallies. However, “In other periods of market exuberance, notably the dotcom bubble in 1999, Buffett sat on the sidelines. While that generated opprobrium from critics at the time with Berkshire shares lagging the technology-heavy Nasdaq Composite, the ensuing correction underscored his investment bona fides.”
But Bespoke Investment Group provides an optimistic spin on the lofty valuations of the broad indexes: “The Technology sector now has a weighting of 34.45% in the S&P 500, which is basically near record-highs only seen at the peak of the Dot Com Bubble in early 2000…. But things look significantly different if we remove the mega-cap Mag 7 stocks (AAPL, AMZN, META, MSFT, NVDA, TSLA) and only look at the "S&P 493”…. Tech is no longer the largest sector...Financials actually takes the top spot with a 21.1% weighting in the S&P 493.Tech moves down to second with a weighting of 19.4%...followed by Health Care (12.9%) and Industrials (12.5%)….”
Warren Pies of 3Fourteen Research has observed that since 2013, S&P 500 earnings growth has beaten the inflation rate every year, with ROIC over +20%. However, although earnings per share for S&P 500 companies rose by about 13% in the second quarter compared with a year earlier, sales grew less than half that rate. In fact, inflation-adjusted retail sales have been flat for the last four years. Q2 2025 earnings reports were solid, with many upside surprises, despite flat retail sales metrics. How did that happen? Well, as the WSJ pointed out, they have been reducing employee headcount, buying back shares, and boosting efficiency and productivity through technology upgrades, including automation.
Valuations are dependent on earnings, interest rates, and the equity risk premium (ERP, i.e., earnings yield minus the risk-free rate), and today we have robust corporate earnings, rising forward guidance, falling interest rates, a dovish Fed, and a low ERP—which is related to inflation expectations being much lower than recent CPI readings would suggest. Some have suggested that every 25-bp reduction in interest rates allows for another 1-point increase in the P/E multiple of the S&P 500. And with inflation expectations in check, bond yields today are less sensitive to inflationary signals compared to the past.
Inflation:
As Eric Peters opined, “Money supply can be instantly expanded with the press of a button. Presto. So, the absolute price of an asset is meaningless. What matters are relative prices…. Most asset prices are soaring, except for bonds. And this all makes sense if we are approaching a monetary reset, where governments reduce the size of their suffocatingly large debts by debasing the currencies they are denominated in. Such a reset utterly savages bondholders, which is why governments will increasingly force those they control to own more of them—weak foreign governments, banks, insurance companies, probably state pensions too. The rest of us search for shelter in a market where bonds are now risk assets. Global central banks and Baby Boomers love gold.”
Indeed, since 2000, our Consumer Price Index (CPI) is up +92%, which means the US dollar has lost nearly half its value in 25 years. Unsurprisingly, gold is up nearly +1,200% (from about $300 to $3,850 today) compared to roughly +600% for the S&P 500’s total return. With US government debt surpassing $37.5 trillion, or about 124% of GDP, and global debt at $324 trillion, or about 235% of global GDP, the case for gold seems crystal clear—and perhaps a target in the next couple of years of $5,000/oz (from today’s price approaching $3,900). Again, rather than investor fear manifesting in falling stock prices and a rising VIX, it instead seems to be reflected in the price of gold.
Fed chair Powell finally seems to be admitting that perhaps tariffs aren’t so inflationary after all, as I have been preaching. A tariff is the same as a tax, which is disinflationary (unless offset by a commensurate rise in income), as discretionary income is reduced. Modest oil prices have certainly helped. At the margin, rising oil prices are inflationary, but when they spike dramatically, they become disinflationary, like a tax hike or tariff (without a commensurate/offsetting increase in income), thus reducing discretionary income, weakening consumer demand, and compressing business margins.
Recall that inflation was in a 40-year secular downtrend from 1980 until the pandemic lockdowns of 2020. After the lockdowns caused a surge in global liquidity (higher demand) coupled with hobbled supply chains (lower supply), inflation naturally surged—and some observers believe that the recent shift towards nationalism and deglobalization means inflation is here to stay. But I believe things are actually moving back to the previous disinflationary trend—despite some strategic reshoring to address national security vulnerabilities, redundancy/diversification of supply chains, and wealth inequality, which will only slightly diminish the broader and disinflationary benefits of globalization. And regardless, any negative impacts will be far outweighed by the promise of AI, blockchain, quantum computing, automation, robotics, autonomous vehicles, computational genomics, precision medicine, low-and-zero-waste nuclear fission, and (someday) perpetual-energy nuclear fusion.
The two charts below show August’s YoY inflation metrics and rolling 3-month (MoM) annualized. It looks to me like typical gyrations in an economy that is "back to normal." CPI came in modestly higher at 2.94% YoY (vs. 2.73% in July) and a 3-month annualized trend of 3.52% (vs. 2.28% in July). After PPI came in ultra-hot in July at 3.09% YoY and 3-month annualized trend of 4.56%, which the market didn't like very much, it came back down to earth again in August at 2.61% YoY and 3-month annualized of 2.54%. As shown, PPI tends to be more volatile than CPI, but both have averaged around 2.6% over the past 15 years, and my 2-year trend lines in the upper chart seem to suggest they are destined to convergence around that 2.6% level is in the offing. In the lower chart, PPI’s wide range between 6.0% and -1.5% implies a midpoint of 2.25%. 3-month CPI has been fluctuating within a tighter range, but my impression is that both might ultimately settle near that midpoint.
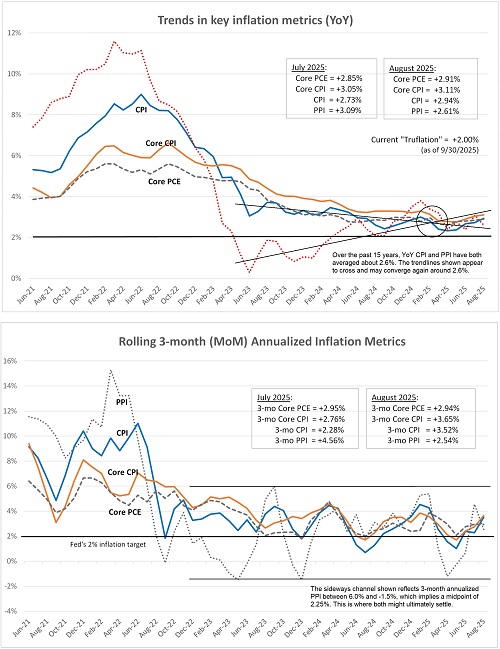
As for the Fed’s preferred Core PCE metric for August, which just came out last Friday, both the YoY and 3-month annualized metrics came in at 2.9%. A key driver has been Financial Services and Insurance, which reflects both the rising stock market (trading commissions or fees on % of assets) and the upward reset on insurance premiums. So, both charts suggest to me that inflation seems to be destined to settle somewhere in the mid-2% range.
A corroborating metric is the real-time blockchain-based Truflation metric, updated daily, which has fluctuated between 1.60–2.27% YoY over the past several months and closed Q3 right at 2.00%. Moreover, the GSCPI supply chain pressure index has settled at or below the zero line since early 2023, and secular disinflationary trends and productivity improvements have resumed. Moreover, First Trust observed that the money supply is up only 1.7% since April 2022 and that goods prices (which are more impacted by import costs and tariffs) are up only +0.5% annualized over the past 6 months while services prices are up +1.4% annualized—all of which suggests an ongoing monetary tightness that should keep inflation subdued with room for additional rate cuts.
In the view of financial writer Phil Rosen: “The Fed must transition from a restrictive regime into one shaped by AI’s deflationary force and tariffs that have proven less inflationary than expected. The cut will indeed alleviate labor-market pressure and buoy asset prices, but more importantly it marks the initial policy adjustment in a new economic age where technology is working to bend the inflation curve lower. That, in theory, should give policymakers more room to ease than past cycles. So rather than chasing easy money or ‘firefighting,’ to borrow former Fed Chair Ben Bernanke’s language, the central bank must manage the transition into a world shaped by technology, debt, and liquidity.”
Notably, China continues to provide a deflationary impulse to the world as it deals with deflation, declining consumer demand and business confidence, a weak property sector, and slowing economic growth, largely due to faulty economic policies. As of Q2 2025, China's GDP deflator had fallen for the ninth consecutive quarter, its worst streak since 1993, leading to stimulative policies and desperate measures from an increasingly authoritarian CCP that will do whatever it takes to staunch the bleeding and growing popular unrest, including restricting capital flight and supporting the yuan. Some observers have speculated about an imminent currency devaluation, but more likely China will continue with “controlled depreciation” to support its mercantilist export economy without triggering capital flight. As hedge fund manager Kyle Bass observed, “China’s economy is spiraling with no end in sight…[with] a permanent shift toward zero or negative real growth.”
In the view of ZeroHedge, “China's overarching central planning model, meant to keep the economy from keeling over, has become so tangled up it is next to impossible to keep track of fake supply and even faker demand. It is also starting to dangerously resemble late-stage USSR, when supply-side economics covered up the rot in the economy until the absolute end. According to Reuters, with its economy slowing, if not contracting, China is pressing its coal-fired power plants to stockpile more of the fuel and import less in an effort to shore up domestic prices….”
Looking elsewhere, Japan remains in structural stagnation while the UK, Canada, Mexico, and much of the Western Europe are struggling economically with elevated inflation, largely due to aging demographics, low birth rates, a shrinking labor force, high energy costs (due to onerous policies on fossil fuels), nanny state entitlements, weakened demand for their exports (especially from China), and the costs of its migrant crisis—including welfare, crime, and failure to assimilate (although if properly managed it could help offset its shrinking labor force and aging demographics).
So, the US remains the growth engine of the world, and foreign capital will continue to flow here, as it always does—especially during uncertain times. And as any foreign investor will tell you, there is no other place in the world like the US to invest capital for the innovation, shareholder-friendly policies, and return on shareholder capital, given our entrepreneurial culture, technological leadership in disruptive innovation, strong management, low interest-rate exposure, global scalability, wide protective moats, and our reliable and consistently strong earnings growth, free cash flow, margins, and return ratios. And given passage of the Genius Act and the promotion of US dollar-backed stablecoins, the world should continue to rely on the dollar for the foreseeable future.
Jobs:
On the jobs front, things aren’t looking too healthy. The August jobs report confirmed that jobs growth is stalling, particularly now that the crutch of new government jobs artificially padding the numbers under the prior administration is now gone. The Healthcare sector continues to show solid jobs gains thanks to secular dynamics like aging demographics and steady demand for essential services such that the sector now accounts for roughly 1 in 6 private-sector jobs, or about 23.5 million. But otherwise, private-sector job creation has essentially flatlined, while government jobs are shrinking. Manufacturing lost 7,000 jobs and trade, transportation and utilities combined to lose 17,000. Only leisure & hospitality dominated positive job creation numbers in August with 50,000 new jobs. The unemployment rate ticked up to 4.3%. And the latest ADP National Employment Report on 10/1 confirmed the weakness, with a net loss of -32,000 private sector jobs in September and a revised August numbers of -3,000 jobs lost from the previously reported +54,000 gain. Ugly.
In addition, the Labor Department has indicated that previous jobs numbers were greatly overestimated such that it will revise its estimate of payroll growth between April 2024 and March 2025 downward by 911,000, which means that job growth averaged about 71,000 per month instead of the previously reported 147,000 per month. After these revisions, government jobs and (predominantly government-funded) jobs in healthcare and social assistance (which are driven by aging demographic) accounted for more than 100% of net job creation in the year ending March 2025, although growth rates in these sectors are also slowing. Layoffs are increasing, business hiring has stagnated, and core payrolls (excluding government-influenced sectors) have fallen for several months. Although real wages for blue-collar workers have grown at their fastest pace since the late 1960s, which has supported consumer spending, the overall labor market remains sluggish.
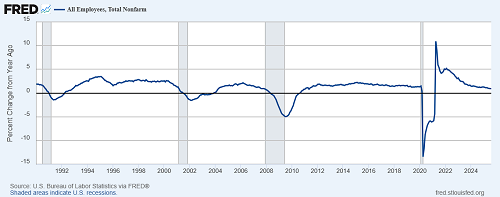
The chart below shows the St. Louis Fed (FRED) data for the YoY change in total nonfarm payrolls (i.e., jobs) on a monthly basis. It shows that employment growth pretty much flatlined around 1.3% in the years leading into the pandemic. And then the 2020 pandemic turmoil happened, with mass layoffs followed by panicky hiring to find good employees. By 2021, year-over-year employment growth was still running above 5%, reflecting the strength of the post-pandemic rebound when employers were scrambling to hire, restaurants were reopening, airlines were refilling planes, But since then, the line has moved steadily downward. By 2022, job growth had slowed to the mid-3% range, and by 2024 it was barely above 1%, representing a structural shift in the economy, with AI rapidly reshaping the scope and quantity of labor demand.
As First Trust opined, “There are many moving parts…tariffs, spending cuts, government job layoffs, and immigration reform. Over the next several months we may see more of an impact…on the labor market.”
Final Comments:
In Treasury Secretary Scott Bessent’s view, we have “a generational opportunity to unleash a new economic golden age that will create more jobs, wealth and prosperity for all Americans.” To achieve it, Bessent has publicly espoused a “3-3-3” economic plan comprising 3% annual GDP growth, a budget deficit of 3% of GDP, and a boost in domestic oil production by 3 million bbls/day. Another interpretation of his “3-3-3” plan adds some additional 3s, such as 3% productivity growth, 3% inflation (rather than the Fed’s 2% target), and 3% interest rates on federal debt—which closely aligns with my personal view of dealing with our massive federal debt by: 1) growing our way out of it, 2) inflating it away, and 3) lowering expenses through spending reductions including reduced interest payments on the debt via lower rates.
But the same structural changes driven by AI and automation that are increasing productivity and promising grand prosperity are also reducing demand for labor. According to economist Mark Skousen, “In 1990, manufacturing dominated the United States, from coast to coast…. Today, healthcare is the #1 employer. Only a few states still focus on manufacturing [in the upper Midwest and Alabama]. For the rest, it’s all about healthcare—big pharma, wellness centers, vitamin business, hospitals and urgent care centers, medical doctors, nurses and staff, insurance companies and lawyers who sue healthcare providers. Healthcare services…now represent 18% of GDP, the highest in the world. Meanwhile, countries like Singapore spend 5% of their GDP on healthcare, and on average their citizens have a longer life span than Americans. Much of the cost of healthcare and medical services are due to government intervention and a dysfunctional legal system.”
And according to Andrew Lees of MacroStrategy partners, the previous economy created a flourishing middle class. He said, “With a diversity of supply chains domestically, processing upstream resources into ever more processed downstream technologies, we created a productive society, including the creation of a middle class…. In doing so, it shaped the economy to a productive natural hierarchy, driving the innovation and growth that made the U.S. the global power it became.”
However, this changed dramatically with hyper-globalization and hyper-financialization, which sought to maximize efficiency and profitability at the expense of robust and redundant supply chains and the welfare of our once-thriving middle class. Federal Reserve economist Ricardo Marto has lamented the massive redistribution of wealth upward, from working people to big business and their shareholders (via dividends and buybacks) rather than deploying capital for expanding capacity and hiring. And besides hollowing out the middle class, it also threatens our national security and strategic supply chains. Indeed, these are the reasons the Trump Administration is so focused on reshoring manufacturing.
Fed Governor Christopher Waller thinks that while the labor market might appear “fine on the surface,” the data point to downside risks. His view is that inflation and real GDP growth are modest while labor markets are stagnant, and so, “Taken together, the data imply the [Fed’s] policy rate should be around neutral, which the median of FOMC participants estimates is 3%, and not where we are, 1.25 to 1.50 percentage points above 3%.”
This is exactly what I have been pounding the table about for many months. The Fed needs to get busy with cuts.
Finally, in his weekly market letter, Eric Peters admonished, “Risk-takers have fueled humanity’s ascent from sticks and stones to the Space Station. So, when I think about what society needs, it is more risk-taking. Not the subsidized and unproductive forms of speculation, like luxury home-buying, which our politicians boost in senseless ways. I’m talking about business building. Invention. Innovation…. That’s the sort of risk-taking that leads to rising productivity and prosperity, which inevitably spread across society…. interest rates should be set sufficiently low so that investors who take no risk of repayment receive a negative real return (an interest rate well below the inflation rate). It makes no sense to allow investors to buy risk-free government bonds that pay fat coupons funded by large budget deficits that will saddle our children with crushing debt. Capital owners should take real risks to earn a positive return. Society would be richer and fairer for it. This administration appears to be in the process of attempting such an agenda. Some will furiously call that financial repression. I say bring it on. That’s the hand we’re being dealt. There are many ways to profit from the opportunities ahead. And if financial repression forces investors to take more real risks, it may even lead to the kind of progress and productivity that will make the S&P 500 a much better investment than gold over the next 25 years.”
Latest Sector Rankings
Relative sector rankings are based on Sabrient’s proprietary SectorCast model, which builds a composite profile of each of over 1,400 equity ETFs based on bottom-up aggregate scoring of the constituent stocks. The Outlook Score is a Growth at a Reasonable Price (GARP) model that employs a forward-looking, fundamentals-based multifactor algorithm considering forward valuation, historical and projected earnings growth, the dynamics of Wall Street analysts’ consensus earnings estimates and recent revisions (up or down), quality and sustainability of reported earnings, and various return ratios. It helps us predict relative performance over the next 3-6 months.
In addition, SectorCast computes a Bull Score and Bear Score for each ETF based on recent price behavior of the constituent stocks on particularly strong and weak market days. A high Bull score indicates that stocks held by the ETF recently have tended toward relative outperformance when the market is strong, while a high Bear score indicates that stocks within the ETF have tended to hold up relatively well (i.e., safe havens) when the market is weak. Outlook score is forward-looking while Bull and Bear are backward-looking.
As a group, these three scores can be helpful for positioning a portfolio for a given set of anticipated market conditions. Of course, each ETF holds a unique portfolio of stocks and position weights, so the sectors represented will score differently depending upon which set of ETFs is used. We use the iShares that represent the ten major U.S. business sectors: Financials (IYF), Technology (IYW), Industrials (IYJ), Healthcare (IYH), Consumer Staples (IYK), Consumer Discretionary (IYC), Energy (IYE), Basic Materials (IYM), Telecommunications (IYZ), and Utilities (IDU). Whereas the Select Sector SPDRs only contain stocks from the S&P 500 large cap index, I prefer the iShares for their larger universe and broader diversity.
The table below shows the latest fundamentals-based Outlook rankings and my full sector rotation model:
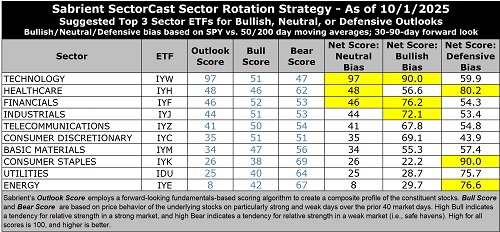
The rankings continue to display a slightly bullish bias given that cyclicals and secular growth sectors dominate the top of the rankings, and defensive sectors generally score lower, somewhat offset by the fact that the Outlook scores for all sectors other than Technology are below 50.
Technology (dominated by the mega-cap Big Tech titans and AI-driven highflyers) remains at the top with a robust Outlook score of 97, despite having by far the highest forward P/E—a lofty 30.2x (although somewhat lower than the 31x it hit a few months ago). However, because of its rising EPS growth estimate of 20.6%, the forward PEG (ratio of P/E to EPS growth) of 1.47 remains relatively modest. Keep in mind that investors are quite willing to “pay up” for strong growth. Tech also displays by far the highest return ratios, the strongest insider sentiment (open market buying), as well as by far the most positive analyst revisions to earnings estimates. Because many Tech stocks are riding secular growth trends (i.e., little cyclicality), no other sector comes close to the consistent sales growth, margins, operating leverage, and return on capital. And Tech not only benefits from its own product development and productivity gains, but those products help other companies with their product development, product delivery, and productivity—so Tech benefits by helping all sectors grow and prosper.
Rounding out the top 6 are Healthcare, Financials, Industrials, Telecom, and Consumer Discretionary. At the bottom of the rankings remain Energy and Utilities. Because of the capital spending going into building out the power grid and infrastructure, Utilities has been a solid performer this year, even though the sector is typically considered to be a defensive “bond proxy” dividend play. However, the Utilities sector as a whole suffers from relatively high valuations for only modest projected earnings growth over the next 12 months (9.3%) and a high forward PEG of 2.08, but this should change with the datacenter buildout and ramp-up in power demand. Although US electricity consumption has been increasing only gradually over the past few years, ICF International forecasts a 25% increase in by 2030 and 78% by 2050, driven largely by AI-related initiatives.
Keep in mind, the Outlook Rank does not include timing, momentum, or relative strength factors, but rather reflects the consensus fundamental expectations at a given point in time for individual stocks, aggregated by sector.
Notably, our ETF rankings continue to display much stronger Outlook scores for the cap-weight indexes, like SPY (51) and QQQ (74), over the equal-weight indexes, like RSP (36) and QQQE (49), which reflects the higher quality of the mega cap companies that dominate the cap-weight indexes. When we talk about “high-quality,” we mean that it displays a history of consistent, reliable, resilient, durable, and accelerating sales, earnings, and free cash flow growth, rising profit margins, a history of meeting/beating estimates, high capital efficiency and ROI, solid earnings quality and conservative accounting practices, a strong balance sheet, low debt burden, competitive advantage, and a reasonable valuation compared to its peers and its own history.
Sector Rotation Model and ETF Trading Ideas
Our rules-based Sector Rotation model, which appropriately weights Outlook, Bull, and Bear scores in accordance with the overall market’s prevailing trend (bullish, neutral, or defensive), returned to a bullish bias in May when the SPY closed solidly above its 200-day moving average several days after previously eclipsing its 50-day. (Note: In this model, we consider the bias to be bullish from a rules-based trend-following standpoint when SPY is above both its 50-day and 200-day simple moving averages, but neutral if it is between those SMAs while searching for direction, and defensive if below both SMAs.) The SPY suffered a dreaded “death cross” during the April selloff when the 50-day average crossed down through the 200-day, but it just recently recovered, with the 50 crossing back above the 200.
As highlighted in the table above, the Sector Rotation model suggests holding Technology (IYW), Financials (IYF), and Industrials (IYJ). However, if you prefer a neutral stance, it suggests holding Technology, Healthcare (IYH), and Financials. Or, if you prefer to take a defensive stance due to overbought technicals and lofty valuations, it suggests holding Consumer Staples (IYK), Utilities (IDU), and Telecom (IYZ).
Here is an assortment of other interesting ETFs that are scoring well in our latest rankings: Sprott Active Gold & Silver Miners (GBUG), Invesco Next Gen Media & Gaming (GGME), Global X PureCap MSCI InfoTech (GXPT), iShares MSCI Global Silver & Metals Miners (SLVP), iShares Global Tech (IXN), WisdomTree Efficient Gold Plus Gold Miners Strategy ((GDMN), Columbia Select Technology (SEMI), VanEck Junior Gold Miners (GDXJ), Invesco Biotechnology & Genome (PBE), iShares Technology Opportunities Active (TEK), Touchstone Sands Capital US Select Growth (TSEL), Pacer US Small Cap Cash Cows Growth Leaders (CAFG), AdvisorShares Hotel (BEDZ), Amplify Video Game Leaders (GAMR), Fidelity Blue Chip Growth (FBCG), SPDR S&P Pharmaceuticals (XPH), iShares AI Innovation & Tech Active (BAI), AXS Esoterica NextG Economy (WUGI), Principal US Small-Cap (PSC), First Trust Nasdaq Semiconductor (FTXL), and First Trust Long-Short Equity (FTLS, which licenses Sabrient’s Earnings Quality Rank as a prescreen). All score in the top decile (90-100) of Outlook scores.
More By This Author:
The Future Of Energy Is Nuclear – Part 3
The Future Of Energy, The Lifeblood Of An Economy - Part 2
July Inflation Metrics May Not Be As Worrisome As They Seem
Disclosure: At the time of this writing, of the securities mentioned, the author held positions in SPY, QQQ, KRE, FTLS, and gold.
Disclaimer: Opinions expressed are the author’s ...
more

