
July Inflation Metrics May Not Be As Worrisome As They Seem

Image Source: Pexels
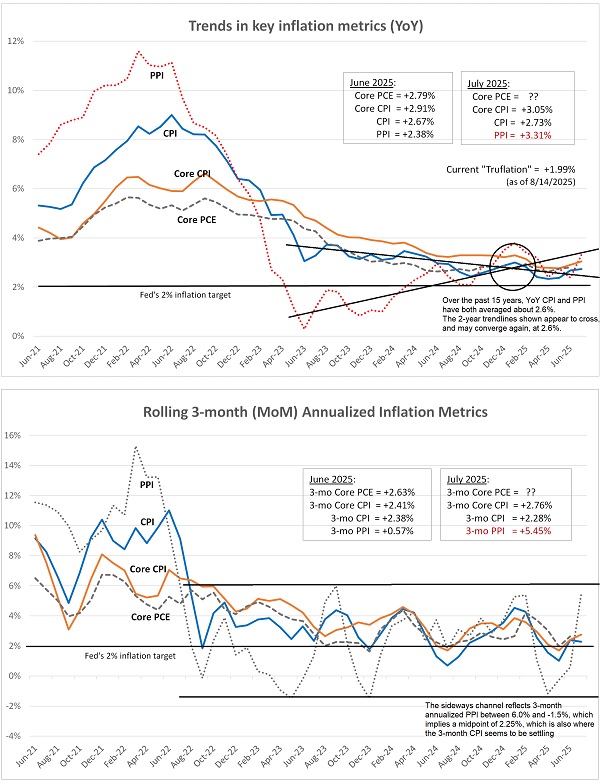
Allow me to offer my insights into this week's CPI and PPI reports for July. CPI came in modest as expected, at 2.73% YoY, 0.20% MoM, and past 3 months annualized trend of 2.28%, which set the market on fire as a green light for the Fed to cut rates. But then today, PPI came in ultra-hot at 3.31% YoY, 0.9% MoM, and past 3 months annualized trend of a scorching 5.45%, which the market didn't like very much, especially the rate-sensitive small caps.
However, perhaps all is not so scary as it may seem. In the charts below, you can see that PPI tends to have greater volatility and a wider range. But over the past 15 years, both CPI and PPI have averaged right around 2.6% YoY. In the top chart of YoY numbers, I have drawn 2-year trendlines (PPI trending up and CPI trending down). They appear to cross at about 2.6% and may be destined to converge there.
In the lower chart, I show rolling 3-month annualized numbers to give a better read on the current trend. You can see that over the past 2 years, PPI seems to be in a wide range between 6.0% and -1.5%, which implies a midpoint of 2.25%. This is also where the 3-month CPI fluctuations appear to be settling.
So, both charts suggest to me that inflation seems to be destined to settle somewhere in the 2.25–2.50% range. A corroborating metric is the real-time blockchain-based Truflation metric, updated daily, which has fluctuated between 1.60–2.27% YoY over the past 3 months and currently sits at 1.99%.
More By This Author:
The Future Of Energy, The Lifeblood Of An EconomyAs Visibility Improves, Investor Focus Can Return To America’s Dynamism
A Pivot To Strategic Deglobalization, Affordable Energy, And A Robust Private Sector
Disclaimer: Opinions expressed are the author’s alone and do not necessarily reflect the views of Sabrient. This newsletter is published solely for informational purposes only. It is ...
more

