
Stocks Eye A Third Straight Banner Year, So Why Is Socialism Gaining Traction?

Image Source: Pixabay
Bullish conviction was severely tested in November for the first time since the April “Liberation Day” selloff. All the naysayers quickly piled on with warnings of an AI bubble and financial returns on immense capex not being realized for many years, if ever. To make matters worse, they warned of sluggish global liquidity growth in the face of rising debt and an impending “debt maturity wall,” i.e., enormous government and corporate refinancing that could overwhelm capital markets, surge borrowing rates, tighten lending standards, crowd out smaller businesses, and thereby constrain economic growth. But alas, the fear didn’t last long, as the old “bad news is good news” narrative was resurrected to predict increasingly dovish Fed monetary policy would save the day. Indeed, it appears that the S&P 500 still has a shot at finishing 2025 with its third straight year of 20%+ returns (which would be only the second time in history, after the five straight years of the 1995-99 dotcom/Y2K run). And yet the K-shaped economy (i.e., investor/creditor class vs. working/debtor class) is leaving too many citizens behind, particularly young and working-class people.
Remember the famous quote from the fearsome heavyweight champion boxer Mike Tyson, “Everyone has a plan until they get hit in the face”? Well, Steve Forbes had a similar quote for the stock market, “Everyone is a disciplined, long-term investor…until the market goes down.” Indeed, the AI-driven bull run seemed uninterruptable for over six months, with the S&P 500’s 50-day moving average providing reliable support all along the way…at least until 11/17 when for the first time in 138 days (since 4/30) the index closed below its 50-day moving average and triggered a panicky selloff. And then even after another incredible earnings report on 11/19 from market leader NVIDIA (NVDA) that sent the market surging higher on 11/20, by mid-day it came crashing back down on news suggesting maybe the jobs market really wasn’t so bad, which led to worries that the Fed might not cut this month after all, and the market finished the day with a big, ugly, red bearish-engulfing candle. As they say, the more overbought, the worse the correction.
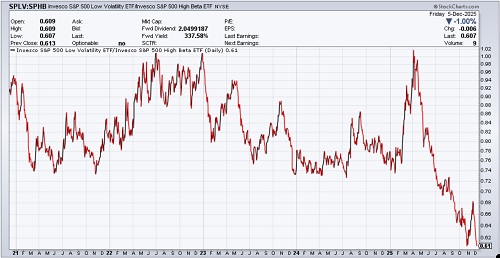
But thankfully, that big, bad, bearish-engulfing candle turned out to be a double-bottom (with the 10/10 low). The S&P 500 found support at its 100-day moving average and then embarked on a rally that has almost entirely retraced its fall from October’s all-time high. It has largely been a speculative “junk rally,” led by the “meme” stocks—like the Roundhill Meme Stock ETF (MEME) and the iShares Micro-cap ETF (IWC), followed by the lower-quality small-cap iShares Russell 2000 (IWM), in which about 40% are unprofitable, then the higher-quality small-cap SPDR S&P 600 (SPSM), in which all are required to be profitable for index entry, and with the mid and large caps trailing behind. Defensives have lagged since April, as illustrated in the chart below showing the ratio of the S&P 500 Low Volatility (SPLV) divided by the S&P 500 High Beta (SPHB), which after a brief jump during the November pullback has returned to its extreme low.
Interestingly, the stock market briefly added a new member of the $1 trillion market cap club during the broad market correction, with drugmaker Lilly & Co. (LLY) enjoying a huge November surge (along with much of the Healthcare sector overall, in a mean reversion catch-up), largely driven by sales in its weight-loss drug Zepbound. So, as LLY pulled back, the trillion-dollar club today is back to 10 members—the original MAG-7 (NVDA, AAPL, GOOGL, MSFT, AMZN, META, TSLA) plus Broadcom (AVGO), Taiwan Semi (TSM), and Berkshire Hathaway (BRK-B).
Short-term technicals on the broad market indexes are overbought once again but still well supported within a bullish uptrend. Nevertheless, for the S&P 500 to hit the 20% return mark for the year will require a bullish catalyst. Most likely it will be the highly anticipated Fed rate cut this week, and importantly, some soothingly dovish words from chairman Jay Powell on additional easing measures plus guidance on the “dot plot” of future rate cuts. However, he can’t be overly dovish as to bring out the “bond vigilantes” in protest, spiking longer-term yields, which would not be favorable for stocks. Market maven Jim Bianco said in an interview on The Money Path that he thinks the tell will be in the number of FOMC member dissents on the expected rate cut, with several dissenters mollifying the bond vigilantes and no dissent angering them. So, Powell walks a tightrope on this, and messaging matters.
Regardless, the liquidity cycle is turning back up, with the Fed already halting its balance sheet reduction (quantitative tightening or QT) as of 12/1, and with more rate cuts in the offing, plus perhaps relaxed capital requirements for banks (like the enhanced supplementary leverage ratio or eSLR) and some form of "QE-lite" to gradually re-expand its balance sheet without antagonizing the bond market. All of this should result in rising M2 money supply. In addition, China has introduced fiscal stimulus and monetary tactics like repurchase operations (“repo”) and a lowered bank reserve requirement ratio (RRR). Furthermore, supply chain pressures are muted, fiscal expansion is underway with lower tax rates and less red tape from the One Big Beautiful Bill Act (OBBBA), and money market funds (aka cash on the sidelines) exceed $8 trillion (the highest ever).
In fact, the Atlanta Fed’s GDPNow is projecting real GDP growth of 3.5% growth in Q3, and forecasters think Q1 2026 might see US growth above 4% given the imminent fiscal impulse (including massive tax refunds in Q1) that should boost the struggling consumer. So, aggregate demand would be expected to rise, likely above the rate of aggregate supply since demand can shift much faster than supply can adjust to match. This would lift asset prices initially, which could be inflationary. As such, some market commentators believe the fed funds neutral rate should match the current rate of nominal GDP growth of 5-6%.
I’m not one of those people. I think any short-term inflationary pressures will be fleeting and offset by the secular disinflationary pressures I often describe: Global Supply Chain Pressure Index (GSCPI) continues to hover at or below the zero line (i.e., its historical average), the benefits of globalization (including comparative advantage) persist despite some strategic onshoring and supply chain diversification, there is a deflationary impulse from China as its dumps cheap goods on the world market in the face of weak domestic demand, and productivity continues to increase through automation and disruptive innovation (including Gen AI).
So, my long-held view remains that a terminal/neutral rate near 3.0% seems right, and the latest fed funds futures suggest 66% odds we get there next year—and that likelihood should increase with the appointment of a new Fed chairman in May (most likely economist Kevin Hassett). Bond yields have normalized with the 10-year Treasury under 4.2%. The flatter yield curve is a market signal to the Fed that it should cut on the short end. The economy needs lower interest rates, including a 30-year mortgage closer to 5%, in tandem with business-friendly fiscal policy and a weaker dollar to: a) sustain rising global liquidity, b) relieve indebted consumers and businesses, c) support US and global economies, and d) avert a global credit crisis. And once that neutral rate is achieved, the Fed can go back into the shadows where it was always intended to be and let fiscal, trade, and tax policies from Congress and the President dominate the news cycle. No more sitting on pins-and-needles at every FOMC meeting or Fed governor speaking engagement.
The return of the “bad news is good news” outlook has fed funds futures solidified at 89% odds of a December cut on 12/10. It also has pushed stocks to within spitting distance of new all-time highs. But notably, bitcoin and other cryptocurrencies corrected much more sharply than stocks, mostly due to deleveraging, and have not yet bounced back like stocks have. Nevertheless, blockchain, tokenization, and stablecoin implementation continue to progress, so I’m not concerned about my crypto allocation—in fact, bitcoin might have just put in a bottom at its 100-week moving average.
Yes, uncertainty persists around trade deals, wars, rising debt, civil strife, stock valuations, a hesitant Fed, and potential government shutdown redux in late January. But investors are positioning for tax and interest rate cuts, deregulation, tame inflation, strong margins & earnings, improving revenue growth, re-privatization, re-industrialization, fast-tracking of power generation infrastructure, robust capex and share buybacks, rising liquidity, a potential “peace dividend,” and a continued flow of foreign capital into the US. Importantly, DataTrek pointed out that Q3 corporate revenue increased by a multi-year record of +8.4%, which is critical for future earnings power—as earnings growth via sales growth is better than cost cutting (higher quality earnings beats). Also, they point out that the percentage of after-tax operating earnings that paid for dividends and stock buybacks has fallen from 96% in 2018 to 81% today, which suggests the difference is being reinvested in business growth—and supports today’s elevated valuations.
In my full commentary below, I talk in greater depth about the K-shaped economy, electricity prices, earnings, debt, inflation, jobs, and Fed policy, as well as the difficulty in “turning the economic ship”—from overreliance on vast, stifling government spending to a robust, unleashed private sector—in the face of political obstructionism, a hostile media, and the impatience of voters in feeling the benefits of the newly passed fiscal stimulus package and the Fed’s monetary stimulus on affordability and mortgage rates, pushing many of them (especially young people and the lower-income/non-asset-holding working class) to shortsightedly embrace the “free stuff” promises of socialist candidates.
I close my commentary by revealing Sabrient’s latest fundamental-based SectorCast quantitative rankings of the ten U.S. business sectors, current positioning of our sector rotation model, and several top-ranked ETF ideas. Top-ranked sectors in Sabrient’s SectorCast model include Technology, Healthcare, and Financials. In addition, Basic Materials, Industrials, and Energy also seem poised to eventually benefit from fiscal and monetary stimulus, domestic capex tailwinds, a burgeoning commodity Supercycle, rising demand for natural gas for power generation, and more-disciplined capital spending programs.
History shows that rising GDP growth, stable inflation, and falling interest rates tend to favor small caps. And because small cap indexes are more heavily allocated to Industrials, Basic Materials, and Financials, enhanced infrastructure spending and a revved-up economy could disproportionately benefit them. Indeed, rather than a continuation of the FOMO/YOLO momentum rally on the backs of a narrow group of AI leaders (and some speculative coattail riders), I expect the euphoria will be more tempered next year such that we get a healthy broadening and wider participation across caps and sectors and with a greater focus on quality and profitability. There are plenty of neglected high-quality names worthy of investment dollars. So, rather than the passive cap-weighted indexes, investors may be better served by active stock selection that seeks to identify under-the-radar, undervalued, high-quality gems primed for explosive growth. This is what Sabrient seeks to do in our various portfolios, all of which provide exposure to Value, Quality, Growth, and Size factors and to both secular and cyclical growth trends.
Concerningly, only 22% of active fund managers are outperforming their passive benchmark this year, largely due to the narrow market leadership from the AI-leading Big Tech titans. However, Sabrient has been performing well. We are best known for our 13-stock “Baker’s Dozen” growth portfolio franchise, which is issued quarterly as a 15-month unit investment trust (UIT) by First Trust Portfolios, and each is designed to offer the potential for outsized gains. For example, the Q1 2024 Baker’s Dozen terminated on 4/21/25 with a gross return of +45.7% vs. +8.2% for S&P 500, and the Q3 2024 portfolio terminated on 10/20/25 up +41.7% vs. +24.1% for S&P 500.
In addition, last year’s 33-stock Forward Looking Value 12 terminated on 11/10/25 up +19.9% vs. +12.7% for the S&P 500 Value Index. Also, small caps tend to benefit most from lower rates and deregulation, and high dividend payers become more appealing as bond alternatives as interest rates fall, so Sabrient’s quarterly Small Cap Growth and Sabrient Dividend (growth & income strategy) also might be timely as beneficiaries of a broadening market.
Market Commentary
Ever since OpenAI’s ChatGPT officially launched on 11/30/2022 (nearly three years ago), Nasdaq 100 (QQQ) is up +117% (as of 12/5), cap-weight S&P 500 (SPY) +75%, equal-weight S&P 500 (RSP) +36%, S&P 400 MidCap (MDY) +34%, Russell 2000 SmallCap (IWM) +39%. And then of course we have juggernaut NVIDIA (NVDA) up nearly +1,000%—and briefly eclipsing an incredible $5.0 trillion in market cap, which is as large as Germany’s GDP (the world’s third-largest economy!)—due to its dominance in designing high-performance GPU semiconductors for AI infrastructure.
As 2025 comes to a close, this eventful year (the first of President Trump’s new term) saw a rollercoaster of sentiment and market volatility, with Trump’s “Liberation Day” rollout of onerous tariffs on every country in the world leading to 50+ spike in the VIX and broad rotation into international assets and currencies, but it turned out to be a tremendous buying opportunity as a low-quality “junk rally” ensued, driven by passage of the OBBBA, various peace accords, and massive AI-related capex (mostly for datacenters and associated infrastructure). And then most recently, we endured the longest federal government shutdown in history due to a political standoff over the 12 annual appropriations bills (discretionary spending for the fiscal year that runs 10/1-9/30), which is still not resolved but merely postponed by a temporary continuing resolution (CR) until the end of January. And yet stocks still have enjoyed another strong year, with the S&P 500 having a good shot at achieving another 20%+ return. This is primarily due to policymakers prioritizing economic growth through fiscal stimulus (lower taxes and deregulation) and supportive monetary policy.
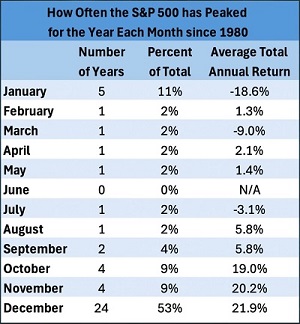
DataTrek Research created the table below showing the number of times each year since 1980 that the S&P 500 has peaked in a given month. Interestingly, history shows that the S&P 500 peaks in December 53% of the time. Moreover, history suggests that even if the 10/29 peak stands as the high for the 2025, the average annual return for an October peak is still a robust 19%.
The scourge of a K-shaped economy:
Although not a new topic, discussion has ramped up about the bifurcated K-shaped economy—i.e., market vs. real economy, Wall Street vs. Main Street, haves vs. have-nots, bourgeoisie vs. proletariat, investor/creditor class vs. working/debtor class—in which some citizens (high-wage and/or asset-rich) are doing just fine while the majority (lower-wage and/or asset-poor) are struggling and falling deeper into the hole. The Boston Federal Reserve observed that the wealthiest 10% of Americans (i.e., those who own the vast majority of assets like stocks and real estate and benefit immensely from asset inflation) not only own nearly 90% of US stocks but also account for roughly 50% of consumer spending—which are the highest percentages ever and illustrates our economy’s unhealthy reliance on the spending habits of the wealthiest 10%.
This divide started with the end of the dollar’s gold standard in 1971 followed by hyper-financialization/deindustrialization of the US economy, emphasis on services over goods production, globalization of supply chains and the rise of China’s mercantilist system (through WTO membership), decoupling of productivity vs. wage growth, the Internet boom, automation/digitization, Fed intervention/QE/ZIRP in response to the Global Financial Crisis, and the pandemic lockdowns (helicopter money, remote vs. in-person jobs). So, to summarize, our modern economy goes like this:
- The US imports goods from abroad, for which foreign exporters receive dollars.
- Those foreign exporters reinvest those dollars in US assets (foreign capital inflows, i.e., balance of payments).
- This capital influx strengthens the US dollar and boosts asset prices—but also makes our exports more expensive, leading to more factory closures.
- US asset owners have increased purchasing power, buying even more imports, and the trade deficit grows.
- The K-shaped economy, income inequality, and the “wealth gap” worsen.
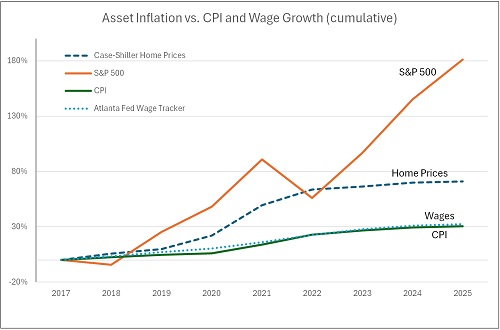
In a nutshell, America today primarily imports goods and exports financial assets, which tends to enrich asset owners (Wall Street) but undermines the working class (Main Street). Asset inflation has far surpassed consumer inflation and wage growth over the past several years, as illustrated in the chart below (annual cumulative data points). While home price appreciation has leveled off after the COVID-era jump, stocks have continued to surge.
This yawning divide is what got President Trump elected, and his administration has been working furiously to shore up working class jobs and reduce import dependency and the trade deficit by:
- Incentivizing the reshoring of manufacturing jobs, deregulating domestic businesses, boosting domestic production, and protecting critical industries through both incentives (“carrot”) and tariffs (“stick”).
- Scaling back the size and scope of low-ROI government spending and hiring and the deficit/GDP ratio, while reprivatizing the economy, cutting personal income taxes, and incentivizing the private sector.
- Controlling immigration.
Of course, the capitalist, free market approach takes more time to germinate but is much more economically sustainable. It’s like turning a supertanker. There is a lot of inertia in any large organization, but changing the federal government is much harder than a commercial enterprise due to the massive internal resistance (“the swamp”) to anything new or contrary to the prevailing political mindset. Indeed, organizational failure might be preferred by some in order to regain political power. And then there is the impatience of a struggling electorate, most of whom do not objectively study and weigh the economic theories but simply react emotionally to political messaging and their immediate needs. Progress must show up fast—and it must be felt on Main Street not just Wall Street (so please stop talking about the stock market and rising 401k accounts, Mr. President!).
As a result, some politicians and their constituents naively believe that the best or most compassionate approach is socialism and an ever-growing welfare state, including Universal Basic Income (UBI) and Medicare for All (including illegal/undocumented residents) as human rights, onerous regulation including limits on everything from divisive speech to free markets (and many of the Bill of Rights in our constitution), and open/sanctuary immigration. Britain is already far along this path.
Indeed, public impatience is on display in pricey urban areas like New York City and Seattle, both of which just elected socialist mayors. I think we can guess how that’s likely to work out. After Zohran Mamdani’s visit to the White House, it occurred to me that both he and President Trump were elected largely based on their populist views and desire to uplift the middle and working classes—although they have very different approaches to achieve it. In contrast to Trump’s methodical plan outlined above for restoring a fairer capitalist system by “turning the supertanker,” Mamdani’s socialist approach is to immediately “rob Peter to pay Paul,” tax the job creators to pay for Big Government and redistribute the spoils to provide free stuff, ranging from housing and childcare to healthcare and bus fare. As he said in his victory speech, “We will prove that there is no problem too large for government to solve….” This approach might provide faster relief for his residents, but it is wholly unsustainable (as every previous attempt at socialism has shown).
Of course, the capitalist view is that providing such largesse for free to all comers just incentivizes sloth while attracting the poor, unskilled, and uneducated of the world to come here to leech off the sweat of hard-working Americans. So, the biggest obstacle for President Trump’s America-First, can-do agenda is overcoming the entrenched political obstructionism bent on sabotage (again, primarily to regain political power).
Notably, it is the progressive policies of New York that have directly worsened its affordability crisis. Rent control (which reduces housing supply) and a high minimum wage (which both reduces employment and is passed through to product pricing) are examples. Energy prices are another: According to a scathing report from the Progressive Policy Institute (whom you might expect to be sympathetic to New York’s decarbonization goals and focus on renewable energy), “New York’s energy system is entering an environment where policy-driven pressures are converging to make the 2019 climate goals increasingly untenable. A combination of shrinking reliable energy supply, inflated demand growth, and mounting cost pressures is creating a collision course that threatens both grid stability and consumer affordability…. This collision is not accidental; it is the direct result of a policy framework that simultaneously dismantles reliable supply while mandating a surge in demand, with ratepayers bearing the inevitable and escalating cost.”
New York electricity prices are 44% higher than the national average, with residential rates rising 36% since 2019 (3x faster than the rest of the country), and the power utilities are pursuing an additional 20% rate hike to address aging infrastructure, storm repairs, and rising operating costs. The report’s author, PPI Managing Director Neel Brown, remarked in an interview, “New York set bold climate targets, but ignored the economic and technical realities required to achieve them. The result is an energy system that is less reliable, more expensive, and now politically unsustainable.” I discussed this topic at length in my August 3-part series on the Future of Energy.
Moreover, you can’t have pockets of socialism within a large, free, capitalist country since the people with money can easily move to the next jurisdiction to escape the onerous taxation. As Margaret Thatcher once said, “The problem with socialism is that you eventually run out of other peoples’ money.” And as renowned economist Mark Skousen explains, “Democratic socialism is all about sharing the poverty. Democratic capitalism is about sharing the wealth.” Indeed, as Swedish historian Johan Norberg noted regarding Sweden’s renaissance from a democratic socialist malaise to a robust capitalist economy, it taxes the rich plenty, but it also taxes the poor at a fairly high rate. “You can’t turn your back on ‘the well’ (i.e., the wealthy),” Norberg says.
But that doesn’t mean Main Street isn’t feeling the pinch, and they want real answers sooner than later (so please stop calling the “affordability” narrative a hoax, Mr. President!). The latest retail sales and consumer confidence metrics were not good. Rather than the 50-year mortgage suggestion that just further deepens indebtedness, another idea floated about for housing is to restrict the ability of big institutional investors and private equity firms from buying up homes—often to remodel and rent out, adding to our country’s trend toward creating a society of renters, with the median age of first-time home buyers hitting 40 years old (compared to 33 just five years ago). I experienced this myself in 2022 in Scottsdale during the frantic spike in home prices, when it seemed that only those with full-cash offers well above asking price were winning the bidding war—and those winners were often institutional investors. It was quite frustrating.
Our founding fathers designed our federal system to restrain concentrated power, not to operate with the efficiency of a business. Their priority was to prevent tyranny through checks and balances, dispersed authority, and slow, deliberative policymaking. They believed some degree of conflict was healthy and that “ambition would counteract ambition”—but they also believed that elected officials would ultimately be guided by civic virtue and a shared commitment to preserving the republic. What they did not foresee was today’s combination of entrenched polarization, nationalized media incentives, political rewards for obstruction rather than compromise, and full frontal assault on the US Constitution as Eurocentric, xenophobic, outdated, and in need of reinterpretation and redesign.
In a private company, the leaders can encourage and incentivize employees to work hard together for a few years toward a common goal. But garnering such unified common purpose in our federal government—plus cooperation from state and local governments—is an impossible task as there is little personal incentive to do so. Helping the other political party succeed, even for the good of the country, is political suicide. Perhaps one of our best and brightest will come up with better incentive structures for cooperation and collaboration in a federal constitutional republic, more akin to a private company. (Elon, are you listening?)
Here are a few ideas for overcoming this modern dysfunction. The system must somehow realign incentives so that cooperation is more beneficial than sabotage. For example, procedural reforms in Congress like fast-track votes for broadly supported bills or consequences for failing to pass budgets can shift behavior toward collaborative governance. Similarly, cross-agency mission teams, milestone-based funding, and performance metrics for senior civil servants can create private-sector-style accountability. And because federalism (and states’ rights) adds another layer of complexity, states can be incentivized to work constructively with the federal government through funding tied to cooperation. Ultimately, the intention should not be to alter our Constitution’s core structure but instead to alter the incentive structure so that political self-interest better aligns with bipartisan problem-solving.
Corporate earnings and government debt:
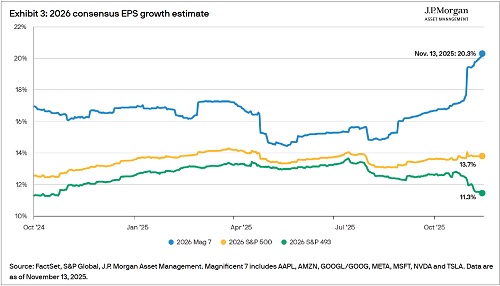
The chart below came from JP Morgan’s “Year-Ahead Investment Outlook” comparing 2026 earnings estimates for the MAG-7, the “S&P 493,” and the S&P 500 overall. Nick Colas of DataTrek Research noted, “The 8 US Big Tech names (38% of the S&P 500) are largely valued on future earnings growth (70% of current market value, 66% ex-Tesla), whereas the valuation of the ‘S&P 492’ is almost equally anchored (72%) by its current earnings power. The potential impact of disruptive innovation in the form of Gen AI and other technologies explains this extremely large gap.”
Overall, Q3 earnings growth came in at 13.1% for S&P 500 and 15.9% for Nasdaq 100—both of which have been driven by the Tech sector’s 27.3% EPS growth rate (and an incredible 49% in the semiconductor industry, led of course by NVIDIA)—and analysts continue to raise estimates for the next 12 months. Profit margin for the S&P 500 hit 13.1%, the highest since 2009 coming out of the Global Financial Crisis (GFC), enhanced by the Tech sector’s free cash flow margin of nearly 20% (which is more than double its late-1990s level). Record high profit margins and rising earnings estimates (now +13% for 2026) seem to warrant the record high valuations and tight credit spreads that we continue to see today.
Given the modern, noncyclical secular make-up of the major indexes today with expanding profit margins (across sectors) and high capital efficiency (e.g., ROIC/ROCE), it is unlikely that we will see multiple contraction as long as strong economic growth and rising corporate revenues persist. Moreover, today’s real interest rate on the 10-year Treasury note (subtracting market expectations for inflation) is well below 2.0%, which is no higher than it was prior to the GFC and the ensuing period of ZIRP, and US BBB corporate bond spreads are running near the low end of their 2-year range.
This all suggests little market fear about dollar stability or imminent doom from the feared “debt maturity wall” in which huge amounts of government and business debt are coming due for refinancing (surging demand) at rates that are generally higher than the terminating notes—i.e., surging demand in the face of tightening credit conditions, which drives up rates and crowds out less-creditworthy companies, pushing more of them into the shadow banking system (like the growing private credit market)…or into austerity and perhaps higher savings rates among consumers.
That’s not to say that government debt doesn’t matter or that the enormous debt maturity wall isn’t real. The Mercatus Center studied over 70 academic papers on the relationship between debt and growth and concluded that, “Clear and persistent empirical study: higher public debt levels (as a percentage of GDP) are associated with slower economic growth…. Debt can stimulate growth when the debt is low but hinder growth when the debt becomes excessive.” In general, the “tipping point” for advanced economies is a ratio of 75-80% for publicly held debt/GDP, above which it imposes a tangible cost by “crowding out” private investment (the CBO estimates that every dollar of deficit spending reduces private investment by 33 cents), putting upward pressure on interest rates, and reducing private capital formation, productivity, and wage growth, with heightened risk of inflation and credit crises. Our public debt/GDP ratio today has surpassed 100% (and total federal debt including intragovernmental holdings is nearly 125% of GDP).
“High and rising public debt is consistently associated with slower economic growth,” says Mercatus, and it may create stagflation (slowing growth coupled with rising inflation). Moreover, they point out that 3% average annual growth doubles GDP in 23 years whereas 2% growth doubles GDP in 35 years. That’s a big difference. In addition, Wellington’s Brij Khurana recently wrote in Barron’s that robust corporate profit growth has been “inflated by massive government deficits, ambitious business investment, and debt-funded shareholder returns. If fiscal stimulus subsides and household savings rates rise…the bubble that has sustained U.S. corporate profits since 2008 might burst.”
Still, today’s US economy is growing nicely while corporate earnings growth is accelerating—including in the small cap space, not just in Big Tech. DataTrek Research observed that S&P 500 sector correlations to the index are well below the long run average (0.68 versus 0.80), reflecting strong investor confidence, which according to DataTrek makes the current bull market “superior to either the 2019 rally or the 2020–2021 post-Pandemic Crisis rebound.” In addition, mutual fund and ETF flows into US equities increased in November for the first time since April. This all bodes well for stocks.
The AI buildout is boosting productivity, while deregulation and support for oil & gas development have contained oil prices, and all of this has helped constrain inflationary pressures, while “financial repression” has helped lower government debt servicing costs. Financial repression is a set of government policies that artificially lower the cost of borrowing and help government to reduce its debt, including interest rate ceilings, capital controls, and directed lending (to support industrial policy). Of course, the worry about all the economic stimulus is that it could lead to a blow-off top in stocks and other risk assets.
Jobs, inflation, and Fed policy:
In contrast to the strong corporate margins and earnings, metrics for jobs growth, retail sales, consumer confidence, industrial production, and ISM Manufacturing have weakened. BLS Employment Situation Report for September finally came out showing +119,000 new jobs, an unemployment rate of 4.4%, and 4.2% higher wages than one year earlier. But this is not yet current following the government shutdown. No October report will be published, and the November report will be released on 12/16. So, looking at the private ADP Employment Report for November, which uses actual payroll records from over 400,000 businesses (as opposed to the BLS surveys of 150,000 businesses), ADP reported last week that private companies shed -32,000 jobs in November compared to +47,000 jobs added in October. And looking ahead, US employers have announced over 1.0 million planned layoffs, whether via attrition, hiring freezes, or outright firings—led of course by the federal government’s 307,000 planned job cuts.
In addition, the Conference Board’s index of consumer confidence dropped from 95.5 in October to 88.7 in November, its largest month-over-month drop since April and the second lowest reading in the past five years. And while the University of Michigan Consumer Sentiment Survey ticked up in December to 53.3, it is well below year-ago December’s 74.0 reading. The ISM Manufacturing Index declined to a 4-month low of 48.2 in November and has been below 50 for nine straight months.
Of course, the FOMC is trying to balance the stagnant jobs market with sticky inflation, but they have been somewhat in the dark from the government shutdown’s delays on data collection and reporting. So, here we are in December, and we only have September data. PPI for September came in at 2.7% YoY, CPI and Core CPI both rose 3.0%, and PCE and the Fed’s preferred Core PCE were both just reported last Friday at 2.8%. Notably, although New Tenant Rents have been falling for some time, it’s finally showing up in the long-lagged Shelter cost components of CPI and PCE. The BLS just announced that its October CPI/PPI reports won’t be published due to a lack of data collection. However, the real-time, blockchain based Truflation metric, which is updated daily based on 30 million data points and tends to presage CPI by several months, reads 2.50% YoY (as of 12/8).
The AI buildout is boosting productivity, and deregulation and incentives for oil & gas development has contained oil prices, all of which has helped constrain inflationary pressures. And hopes for progress in the Russia-Ukraine conflict drove oil prices lower, reinforcing the broader disinflation narrative. And yet, electricity prices continue to rise. This is not simply due to rising demand from AI, much of which will be fulfilled by collocated/dedicated power sources. Rather it will be due to the disproportionate reliance on wind, solar, and battery storage capex, which is unreliable and non-dispatchable compared to fossil fuels and nuclear. Such projects not only allow the utility companies to take advantage of the lucrative Biden-era subsidies for wind and solar that are set to phase out in the next five years.
According to “Energy Bad Boys” on Substack, ““As long as utility regulators approve these capital expenditures, utilities can earn a full rate of return on the assets, which is why so many of them adopted voluntary carbon-free goals—the “green” movement was essentially a blank check for utilities to rate base as much as they wanted…. This will continue the flood of unreliable wind and solar energy sources coming onto the electric grid, exacerbating the ongoing distortion of energy markets by eating into revenue streams of reliable generators, and without adding much benefit to meeting expected peak demand growth…. New gas generation coming online is encouraging, but some of this new capacity is being used to replace existing coal plants rather than meeting new demand. In our book, this is a mistake. The best way to alleviate price hikes for consumers and provide more power to industries is to keep existing resources online and add new capacity to meet the demand. Otherwise, we’re one step forward, one step back, and in the same pickle we started in….”
Also worth noting is the disinflationary impulse from China and India. Bloomberg published an article in early November titled, “The True Cost of China’s Falling Prices: Bloomberg analysis shows deflation on the ground feels more pronounced than official data show, with prices of everyday goods plunging and the share of loss-making companies at a 25-year high.” It describes a deflationary spiral, with demographic issues reducing consumer demand leading to dumping of goods on the global market and a plethora of “zombie” companies that can’t pay their debts—which ultimately may lead to a currency devaluation. Notably, economist Ed Yardeni pointed out that China’s GDP deflator has been down for 10 consecutive quarters, the worst stretch since 1993, which Yardeni says, “increases the odds that China will share its deflation troubles with a global economy that’s staggering out of 2025 and worried about what 2026 will bring.” In addition, India’s inflation rate fell to 0.25% in October, the lowest rate since data collection commenced back in 2012, and the Reserve Bank of India (RBI) now expects inflation to be just 2% in the next fiscal year (compared to his longer run average of 6%).
So, for now, I think the Fed is still behind the curve on interest rates. Notably, New York Fed President John Williams (on rotation as a voting member) recently said that there is room to lower rates to avoid “undue risks” to the labor market, Also, San Francisco Fed President Mary Daly (currently a non-voting member) now supports more rate cuts due to concerns that a labor market downturn is both more likely and more difficult to manage than a resurgence in inflation. And former Fed governor Kevin Warsh, who is under consideration to replace Powell, wrote in a WSJ guest column in November, “The Fed should…abandon the dogma that inflation is caused when the economy grows too much and workers get paid too much. Inflation is caused when government spends too much and prints too much. Money on Wall Street is too easy, and credit on Main Street is too tight. The Fed’s bloated balance sheet, designed to support the biggest firms in a bygone crisis era, can be reduced significantly. That largesse can be redeployed in the form of lower interest rates to support households and small and medium-size businesses.”
Exactly! Allow me to reiterate from my prior posts that I believe the path to economic sustainability (given our accelerating federal debt and deficit spending spiral) may require a 3-pronged attack: 1) "inflate away" the debt with somewhat elevated inflation around 2.5%, 2) "cut away" the debt by reducing government waste and spending, and 3) "grow away" the debt by truly stimulating real organic, private-sector-led productivity and economic growth with lower tax rates and deregulation. Capital tends to flow to where it is most welcome and earns its highest returns.
Let me close this section with a couple of brief comments regarding inflation fears. First, regarding strategic onshoring and deglobalization in the US, on its face it threatens to create inflationary pressures, as onshoring of critical industries in the US would tend to boost costs (capex and higher operating costs, offset by transport savings). But the US is not the only country pursuing what seem to be poor economic decisions in the pursuit of national security purposes. China is pursuing massive, capital-intensive, environmentally unfriendly (high carbon footprint) coal-to-liquids (e.g., synthetic natural gas—even though the global market offers cheap, abundant supplies), as well as nuclear, renewables, and hydroelectric projects in an effort to become energy independent—for national security and freedom from the reach of potential US sanctions. But regardless, according to the National Association of Manufacturers here in the US, every $1 spent creates a total impact of $2.65 to the US economy, and every new worker leads to 4.8 workers added to the economy—that’s the kind of ROI the private sector brings (compared to low-ROI government spending (on entitlements and boondoggles).
Second, the real yield (subtracting inflation expectations averaging around 2.3% annually) on the 10-year Treasury note is only around 1.8% today (as reflected by the 10-year TIPS), which suggests that investors do not consider today’s sticky inflation numbers to be entrenched in the economy. Also, US BBB corporate bond spreads are running near the low end of their 2-year range. The cost of US High Yield corporate debt is back to its pre-pandemic average, thanks to both tight spreads and lower Treasury yields. The Global Supply Chain Pressure Index (GSCPI) continues to hover at or below the zero line (i.e., its historical average), helping to keep inflation in check.
Final Comments:
These were my Final Comments exactly one year ago—on 12/10/24, in my blog post, “A 3-pronged approach to boost the economy and roll back debt under Trump 2.0”—which continue to ring true to me today:
Let’s not ignore the defensive signals that are showing up in various corners, including narrowing market breadth among US stocks despite continuing to hit new all-time highs (on the backs of the mega-caps), and from the bond market as US Treasuries are getting bought again (with the 10-year yield closing last week at 4.15%), and Chinese yields have fallen precipitously to near historic lows (with the 10-year yield below 2%), which reflects deep concern about its struggling economy, deflation, and the potential for new US tariffs, and its consumers are focused more on savings than consumption—which of course would have serious global impact given the size of China’s economy. The ratio of PCE to GDP in the US is 68% but only 39% in China, and Chinese consumers today are further reducing discretionary spending and major purchases in a defensive posture.
Furthermore, the consumer is getting more and more stretched. Both household credit card debt and credit card interest rates are at record highs. So, it should be no surprise that 11% of credit-card balances are more than 90 days delinquent, which is the highest delinquency rate since 2012 (coming out of the Global Financial Crisis). On the other hand, according to the St. Louis Fed, household debt service payments as a percentage of disposable personal income remains below pre-pandemic levels at 11.3% (which is the highest post-pandemic reading but stable over the past 3 quarters).
Regardless, I think any significant pullback or technical consolidation to allow the moving averages to catch up would be a buying opportunity into year-end and through 2025, and perhaps well into 2026—assuming the new administration’s policies go according to plan. Adding exposure to cyclical sectors and small caps may be prudent. Yes, the broad indexes are already highly valued, with the mega-cap-dominated S&P 500 (SPY) and Nasdaq 100 (QQQ) at 22.7x and 27.2x, respectively, but the equal-weighted indexes are more attractively valued, with the equal-weight S&P 500 (RSP) and Nasdaq 100 (QQQE) at 18.0x and 24.0x, and the S&P 600 SmallCap (SPSM) at 16.5x. [Today, SPY=23.2x, QQQ=27.9x, RSP=17.5x, QQQE=22.9x, SPSM=15.4x, which shows that the market has only narrowed further over the past year, with higher valuations of the cap-weight indexes and lower (better) valuations on the equal-weight and small cap indexes.]
Overall, my suggestion to investors in this optimistic Trump 2.0 climate is to not chase the highflyers and instead focus on high-quality businesses at reasonable prices, hold inflation and dollar hedges like gold and bitcoin (both of which are at or near all-time highs), and be prepared to exploit any market correction (such as by buying out-of-the-money put options in advance of a potential pullback while VIX is low) and then buy those high-quality stocks as they begin to rebound for further gains through 2025 and beyond, fueled by massive capex in blockchain and AI applications, infrastructure, and energy leading to better productivity, increased productive capacity, and economic expansion.
Again, I think these comments still ring true today. Regarding inflation and dollar hedges, historically under “normal” economic conditions, gold and bonds are both defensive plays and show positive price correlation with each other and inverse correlation with stocks. In other words, gold goes up as bond prices go up (and yields and stock prices fall), and conversely, gold often struggles as bonds fall (and yields and stocks rise, particularly since gold doesn’t pay a dividend). However, when the “fear trade” kicks in, gold serves as a hard-asset hedge against financial disruption. Other hedges might include bitcoin, ether, and energy stocks (which did quite well during the 2022 bear market).
And regarding “high-quality businesses,” I mean fundamentally strong, displaying a history of consistent, reliable, resilient, durable, and accelerating sales and earnings growth, positive revisions to Wall Street analysts’ consensus forward estimates and a history of meeting/beating estimates, rising profit margins and free cash flow, high capital efficiency (e.g., ROI), solid earnings quality and conservative accounting practices, a strong balance sheet, low debt burden, competitive advantage, and a reasonable valuation compared to its peers and its own history. These are the factors Sabrient employs in our quantitative models and in selecting our Baker’s Dozen, Forward Looking Value, Dividend, and Small Cap Growth portfolios (which are packaged and distributed as UITs by First Trust Portfolios). We also use many of these factors in our SectorCast ETF ranking model. And notably, our Earnings Quality Rank (EQR) is a key factor in each of these models, and it is also licensed to the actively managed, low-beta First Trust Long-Short ETF (FTLS) as a quality prescreen.
More By This Author:
Stocks Waver Ahead Of Holidays… Will Santa Arrive As Scheduled?
Is The Market Finally Ready For A Value Rotation?
Stocks Enter Q4 With Fed, Tax, Earnings, And AI Tailwinds, But Also Lofty Valuations
Disclaimer: Opinions expressed are the author’s alone and do not necessarily reflect the views of Sabrient. This newsletter is published solely for informational purposes only. It is ...
more

