
Stocks Waver Ahead Of Holidays… Will Santa Arrive As Scheduled?

Image Source: Pixabay
The full pullback/correction I have been anticipating remains elusive. After all, stocks can’t go straight up forever, and this bull run has become long in the tooth. The greater the divergence, the worse the potential correction. Ever since the market recovered from its April “Liberation Day” tariff-driven selloff, every attempt at a correction or consolidation has been quickly bought before it could get started. But last week seemed different. It was Nasdaq’s worst week since April, and all the AI-driven market exuberance seemed to have suddenly shifted to fears of a valuation bubble. Alas, fear not. It seems to have been nothing more than another brief pause to refresh—i.e., take some profits off the table, reassess fundamentals versus sentiment, shake out the weak holders (including momentum traders), test technical support levels, and shore-up bullish conviction…punctuated by a nice bounce off the 50-day moving average.
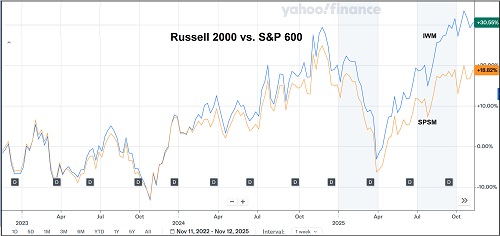
Even on October 10, when the S&P 500 fell 2.7% on President Trump’s announcement of massive tariffs on Chinese imports and China’s retaliatory export restrictions on rare earth elements, the market began its recovery the next day. Besides Big Tech, speculative “meme” stocks were also hot. And to further illustrate the speculation, the Russell Microcap Index (IWC) has been performing in line with the S&P 500, setting a new all-time high in October (for the first time since 2021). It is notable that the lower-quality Russell 2000 Small-cap Index (IWM), in which over 40% of the companies in the index are unprofitable, has been substantially outperforming (+10.6% vs. +4.3% YTD) the higher-quality S&P 600 SmallCap (SPSM), in which all stocks are required to show consistent profitability for index admission.
So, it was only a matter of time for bears to try again to push the market lower, especially given the growing set of headwinds (described in my full commentary below). During last week’s selloff, we saw the CBOE Volatility Index (VIX) surge above 20 (fear threshold) as traders deleveraged. Bitcoin dropped below $100,000 for the first time since June (a 20% correction from its all-time high in October). The CNN Fear & Greed Index dipped into Extreme Fear category. State Street’s Risk Appetite Index showed Big Money refraining from risk assets for the first time since mid-May. And Warren Buffett’s Berkshire Hathaway’s (BRK.B) cash reserves hit yet another record high of $382 billion, as valuations had become too pricey for the “Oracle of Omaha.” But at its low last Friday, the S&P 500 was only down about 4.2% from its peak.
Market breadth remains a concern. While the mega caps kept rising, we have seen only occasional glimpses of nascent rotation, including this week in which the Dow Industrials (DIA), Dow Transports (IYT), and equal-weight S&P 500 (RSP) have all significantly outperformed the S&P 500 and Nasdaq 100. But each prior attempt this year at broadening across sectors and market caps has been short-lived. Only 22% of active fund managers are beating their passive benchmark. Investech noted that from an historical perspective, the Nasdaq Composite has hit a new all-time high with 2:1 negative breadth (decliners/advancers) only twice in its 54-year history—once just prior to the 2022 bear market and once several days ago. Notably, bitcoin and other cryptocurrencies corrected much more sharply than stocks, mostly due to deleveraging, and have not yet bounced back like stocks have. Nevertheless, blockchain, tokenization, and stablecoin implementation continue to progress, so I’m not concerned about my crypto allocation.
The S&P 500, Nasdaq 100, and Dow Jones Industrials each successfully tested support at their 50-day moving averages and then quickly recaptured and retested support at their 20-day moving averages this week as the government shutdown moved toward resolution. But leadership this week has noticeably swung to the Dow Industrials (notably, not cap-weighted), which is the first to get back above its all-time high, and the Dow Transports are getting close, which according to Dow Theory would confirm the bull market. Also, the small-cap Russell 2000 is on the verge of recovering its 20-day average. Notably, gold, silver, and copper have also recovered above their 20-day moving averages and seem bent on reaching new highs.
In essence, I would characterize the latest pullback as a passing “macro scare” within a structural bull market, with some promising new signs of healthy market rotation, and I still think the S&P 500 will achieve another 20%+ return for 2025—for the third year in a row, which would be only the second time in history other than the 5-year (1995-99) dotcom/Y2K bull run.
So, looking ahead, should we expect all rainbows, unicorns, blue skies, and new highs through 2026? Well, while there surely will be more macro scares, more consolidation, and more retests of bullish conviction ahead of the seasonal Claus rally, I believe the fundamental tailwinds greatly outweigh the headwinds, as I discuss in my full commentary below. The government shutdown is over, at least until the end of January. Investors remain optimistic about AI capex and productivity gains, a trade deal with China, a more dovish Fed, business-friendly fiscal policies, deregulation, fast-tracking of power generation infrastructure and strategic onshoring, a stable US dollar, and foreign capital flight into the US (capital tends to flow to where it is treated best). And lower interest rates will lead to more consumer spending, business borrowing for investment/capex, earnings growth, and stock buying (including retail, institutional, and corporate share buybacks). Indeed, the 10-2 Treasury yield spread stands at about 50 bps today, which is consistent with past periods of continued US economic expansion.
However, while retail investors have continued to invest aggressively, institutional investors and hedge funds (the so-called “smart money”) have grown more defensive and deleveraged. So, maintaining a disciplined approach—such as focusing on fundamental analysis, long-term trends, and clear investment goals—can protect against emotional kneejerk overreactions during murky or turbulent periods.
On that note, remember that stock valuations are dependent upon expectations for economic growth, corporate earnings, and interest rates, tempered by the volatility/uncertainty of each—which manifests in the equity risk premium (ERP, i.e., earnings yield minus the risk-free rate) and the market P/E multiple. Some commentators suggest that every 25-bp reduction in interest rates allows for another 1-point increase in the P/E multiple of the S&P 500; however, those expected rate cuts over the next several months might already be baked into the current market multiple for the S&P 500 and Nasdaq 100 such that further gains for the broad indexes might be tied solely to earnings growth—driven by both revenue growth and margin expansion (from productivity and efficiency gains and cost cutting)—rather than multiple expansion.
Broad, cap-weighted market indexes like the S&P 500 and Nasdaq 100 essentially have become momentum indexes, given their huge concentration in AI-driven, Big Tech mega-caps. So, although growth stocks and crypto may well lead the initial recovery through year end, longer term, rather than a resumption of the FOMO/YOLO momentum rally on the backs of a narrow group of AI leaders (and some speculative companies that ride their coattails), I expect the euphoria will be more tempered in 2026 such that we get a healthy broadening and wider participation across caps and sectors and with a greater focus on quality and profitability. There are plenty of neglected high-quality names out there worthy of investment dollars.
As I discuss in my full commentary, top-ranked sectors in Sabrient’s SectorCast model include Technology, Healthcare, and Financials. In addition, Basic Materials, Industrials, and Energy also seem poised to eventually benefit from fiscal and monetary stimulus, domestic capex tailwinds, a burgeoning commodity Supercycle, rising demand for natural gas for power generation, and more-disciplined capital spending programs.
As such, although near-term market action might remain risk-on into year end, led by growth stocks, the case for value stocks today might be framed as countercyclical, mean reversion, portfolio diversification, and market broadening/rotation into neglected large, mid, and small caps, many of which display a solid earnings history and growth trajectory as well as low volatility, better valuations, and less downside risk, with greater room for multiple expansion. On 10/30, I published an in-depth post detailing the case today for value investing titled, “Is the market finally ready for a value rotation?” in which I discussed three key drivers: 1) mean reversion on extreme relative valuations, 2) diversification of portfolios that have become heavily titled to growth, and 3) sticky inflation benefiting real assets and cyclical/value sectors. So, perhaps the time is ripe to add value stocks as a portfolio diversifier, such as the Sabrient Forward Looking Value Portfolio (FLV 13), which is only offered annually as a unit investment trust by First Trust Portfolios and remains in primary market only until Friday, 11/14.
In addition, small caps tend to benefit most from lower rates and deregulation, and high-dividend payers become more appealing as bond alternatives as interest rates fall, so Sabrient’s quarterly Small Cap Growth and Dividend portfolios also might be timely as beneficiaries of a broadening market—in addition to our all-seasons Baker’s Dozen growth-at-a-reasonable-price (GARP) portfolio, which always includes a diverse group of 13 high-potential stocks, including a number of under-the-radar names identified by our models.
So, rather a continued capital flow into the major cap-weighted market indexes, which are dominated by mega-caps, growth, and technology, a healthy market rotation would suggest equal-weight, value, dividend, strategic beta, factor-weight, small/mid-caps, other sectors, and actively managed funds. Indeed, I believe we are being presented with an opportunity to build diversified portfolios having much better valuations and less downside than the S&P 500. In actively selecting diversified stocks for our portfolios (which are packaged and distributed as UITs by First Trust Portfolios), Sabrient seeks high-quality, undervalued, often under-the-radar gems for our various portfolios—starting with a robust quantitative model followed by a detailed fundamental analysis and selection process—while providing exposure to value, quality, growth, and size factors and to both secular and cyclical growth trends.
The Q4 2025 Baker’s Dozen launched on 10/17 is off to a good start, led by mid-cap industrial Flowserve (FLS) among its 13 diverse holdings, as is our annual Forward Looking Value 13 portfolio, led by mid-cap rideshare provider Lyft (LYFT) among its 28 diverse holdings. In fact, most of our 20 live portfolios are doing well versus their relevant benchmarks. And for investors concerned about lofty valuations and a potential spike in market volatility, low-beta and long/short strategies might be appropriate, such as the actively managed First Trust Long-Short ETF (FTLS), which licenses Sabrient’s proprietary Earnings Quality Rank (EQR) as a quality prescreen.
In today’s full post, I discuss in greater depth this year’s speculative rally and mega-cap leadership, whether the AI trade has gotten ahead of itself, market headwinds versus tailwinds, inflation indicators (in the absence of government data), and reasons to be optimistic about stocks. I also reveal Sabrient’s latest fundamental-based SectorCast quantitative rankings of the ten U.S. business sectors, current positioning of our sector rotation model, and several top-ranked ETF ideas.
Market Commentary
This sustained bull run certainly has been impressive, led of course by Big Tech and its massive AI-focused capex. Notably, ever since OpenAI’s ChatGPT officially launched on 11/30/2022 (nearly three years ago), Nasdaq 100 (QQQ) is up +116% (as of 11/11), cap-weight S&P 500 (SPY) +75%, equal-weight S&P 500 (RSP) +34%, S&P 400 MidCap (MDY) +32%, Russell 2000 SmallCap (IWM) +35%. And then of course we have juggernaut NVIDIA (NVDA) up more than +1,000%—and briefly eclipsing an incredible $5.0 trillion in market cap, which is as large as Germany’s GDP (the world’s third-largest economy!)—due to its dominance in designing high-performance GPU semiconductors for AI infrastructure. And then there are niche players like AppLovin (APP), star performer of the Q1 2024 Sabrient Baker’s Dozen, that has returned an incredible +4,000% over the past 3 years, rising from a small-cap hopeful to a $200 billion market cap, driven by its ability to leverage AI applications, specifically its Axon 2.0 ad-targeting platform. I believe more small companies like this that can successfully develop and leverage AI applications will be the top performers in the future.
But behind the veneer of a powerful stock market regularly setting new highs this year, it has been on the backs of a handful of giant stocks while most others struggle (albeit with exceptions like AppLovin). Speculative sentiment has flourished this year, particularly in the wake of the April selloff. Upstart new-tech companies (e.g., AI, quantum computing, nuclear, space) that are unprofitable but have strong projected growth are getting bid up, including “meme stocks” and small caps. But it’s not just any and all small caps; the unprofitable ones have been the leaders—often with no revenue or otherwise plowing all their profits into growth initiatives. In other words, investors have been betting on estimates of future earnings growth rather than on the stability of actual earnings. To illustrate, the Russell 2000 (IWM) and S&P 600 (SPSM) have performed roughly in line with each other over the past 5 years. But look at how the lower quality IWM began to greatly outperform following the Q1 selloff, as shown in the chart below:
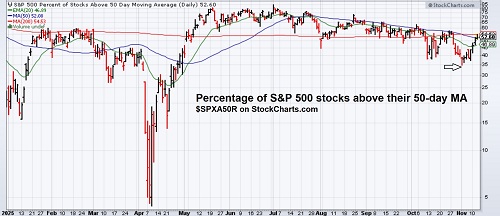
Headwinds abound. For starters, stock valuations are historically high. We have geopolitical threats, ongoing hot wars and trade wars, struggling global trading partners, sticky inflation metrics, weak jobs growth, social strife, and a federal government shutdown, which although finally resolved this week still did its damage—and will most likely rear its ugly head again in January. Technicals on the broad indexes remain overbought. The broad, mega-cap-dominated S&P 500 index had spent 132 straight days above its 50-day moving average before briefly violating support last Friday, with valuation multiples at nosebleed levels—some would say “priced for perfection.” But at the start of the month, as little as 35% of stocks in the index were trading above their 50-day moving average, as shown in the chart below, reflecting both heavy reliance on Big Tech and high concentration risk.
Although projected to accelerate in 2026 and beyond, corporate revenue growth has been sluggish, such that while Q3 earnings reports were impressive, with 84% of companies beating already-solid earnings estimates, it was driven more by a record high in net margin from productivity growth and cost-cutting than by sales growth. Moreover, there is notable stress in the rapidly growing private credit space. Consumer and business bankruptcies and delinquencies have been rising, sentiment is near a record low, and leading economic indicators have been falling. Rather than investor fear manifesting falling stock prices and rising market volatility, it instead seems to be reflected in the price of gold and silver, which have been surging.
But perhaps most distressingly, many workers are being left behind in this time of massive change. In particular, low-income households are frustrated by continuously rising costs, housing affordability, and expiration of the temporary pandemic-era Obamacare subsidies. Of course, it’s hard to make any entitlement temporary as people tend to become dependent on them fast, especially if their incomes are not rising commensurate with expenses in their localities (despite what the broad wage growth metrics might suggest). Youth unemployment is rising, and new college grads burdened with massive student debt (to pay for skyrocketing tuition) are not finding attractive career opportunities.
As Peter Thiel predicted back in 2020, “negative capital” and low-income in this cohort makes it “very hard to start accumulating capital in the form of real estate [and other investments]; and if one has no stake in the capitalist system, then one may well turn against it.” This is how you end up with “tax-the-rich” class warfare and a Mamdani mayorship in NYC. To alleviate their own immediate pain, these voters choose the shackles of big-government socialism (and the “cycle of dependency”) over the unlimited opportunity and freedom (to succeed or fail) of small-government capitalism.
As renowned economist Mark Skousen explains, “It violates the cardinal principle of economics known as the ‘accountability’ or ‘user pay’ principle. If you benefit, you should pay. If someone else pays—whether your parents, your company, insurance, or the government—there is little to no discipline [or incentive] to keep costs down or to encourage innovation…. Democratic socialism is all about sharing the poverty. Democratic capitalism is about sharing the wealth. Millions of private companies offer various profit-sharing plans, a much better alternative to raising the minimum wage or imposing confiscatory taxes on the rich….” This is why socialism has failed every time it has been tried. It promises lots of free stuff (entitlements) to the “oppressed,” paid for by taxing “the rich” (aka the “oppressors”), i.e., “From each according to his ability, to each according to his needs,” as extolled by Karl Marx. But as Margaret Thatcher once said, “The problem with socialism is that you eventually run out of other peoples’ money.”
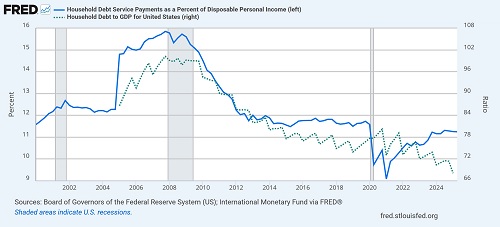
However, at least some of the negative talking points should be taken with a grain of salt. As just one example, there has been much ado about the explosion in household debt reaching $18.6 trillion in Q3 (dominated by $13.1 trillion in mortgages), coupled with rising bankruptcies and delinquencies. And indeed, many people on the margins have gotten into debt trouble. But overall, as shown in the chart below, the ratio of household debt to GDP has been in a downtrend since the Global Financial Crisis, and the ratio of household debt to disposable personal income has flatlined below pre-pandemic levels.
Indeed, economic tailwinds are gaining steam. Following a worrisome reading of -0.6 GDP growth in Q1, the BEA’s third estimate of Q2 GDP showed a +3.8% annualized rate, which is the strongest in almost 2 years, and the Atlanta Fed’s GDPNow forecast for Q3 has risen to 4.0% (as of 11/6). Interest rates have receded across the curve. Consumer spending remains solid, with the National Retail Federation forecasting holiday spending on gifts, food, and décor to eclipse $1 trillion for the first time ever, in spite of the government shutdown and its impact on personal income. Also, the percentage of nonfinancial corporate debt to total market value of corporate equities continues its downtrend to yet another record low of 17% (as of Q2), suggesting that financial leverage remains quite low (compared to 34% in Q1 2020, 60% in Q1 2009, and 99% back in Q3 1974).
In addition, the real yield (subtracting inflation) on the 10-year Treasury note is only around 1.8% today (as reflected by the 10-year TIPS), and US BBB corporate bond spreads are running near the low end of their 2-year range. The cost of US High Yield corporate debt is back to its pre-pandemic average, thanks to both tight spreads and lower Treasury yields, which bodes well for small caps. The Global Supply Chain Pressure Index (GSCPI) continues to hover around the zero line (i.e., its historical average), helping to keep inflation in check. The Federal Reserve is cutting rates and ending its quantitative tightening (QT) and balance sheet reduction, and growth in M2 money supply and global liquidity remains supportive. New tax rates and deregulation from the One Big Beautiful Bill Act (OBBBA) are stimulative.
Also, the benefits of globalization (including comparative advantage) persist despite some strategic onshoring and diversification of supply chains, and secular disinflationary trends continue, including the deflationary impulse from China. As I often preach, China’s economic woes are deflationary (cheaper goods, i.e., “dumping” in the face of weak domestic demand), disruptive innovation is deflationary (increased productivity), and tariffs are deflationary (just like a tax, in the absence of a commensurate and offsetting rise in income).
And while strong corporate earnings have been driven more by margin expansion than sales growth, it bodes well that net margins tied the record high of 13.1% (from Q2 2021) and were well diversified, with 7 of the S&P 500’s 11 sectors posting better net margins than their 5-year averages. Indeed, the Big Tech juggernauts have demonstrated how to use operating leverage to scale revenues while expanding margins to earn their higher P/E multiples.
Dave Mazza and Thomas DiFazio of Roundhill Investments recently observed, “…highly profitable companies are commanding premium prices from investors. Within the S&P 500, the companies with the highest next-twelve-month price/earnings ratios also have the highest expected profit margins, with an average of 21.1%. The lowest multiple S&P 500 stocks have an average NTM profit margin of 14.6%, a difference of 6.5%. With such a disparity between the most and least profitable S&P 500 stocks, investors appear to be incentivized to pay up for high margin stocks…. For investors, the focus should shift from hoping for higher multiples to identifying firms with real earnings power and efficiency.”
And Nick Colas of DataTrek Research noted, “In the first half of 2025, US Big Tech companies (36% of the S&P 500) had an average net margin of 29.0%, more than twice the S&P 500 as a whole… If these 8 names were one company, it would have net margins of 27.4% on 2025 revenues of $2.5 trillion. While they all carry very high valuations, most of these names have the fundamentals to merit them.”
Yes, exciting new productivity-enhancing technologies continue to accelerate, and robust corporate capex, primarily in technology and AI infrastructure, has provided massive, private-sector-led, high-ROI stimulus—rather than low-ROI stimulus, pet subsidies, and other malinvestments of government politburo-style picking and choosing by politicians with little to no business management experience. Big Tech has reiterated plans for hundreds of billions of dollars in spending on datacenters amid massive and growing AI computing demand. The main cloud-computing “hyperscalers” are Amazon Web Services (AWS), Microsoft Azure, and Google Cloud Platform (GCP), plus other players like IBM Cloud, Oracle Cloud Infrastructure (OCI), Alibaba Cloud, and Meta Platforms. As these firms build datacenters and deploy AI semiconductors from the major chipmakers like NVIDIA (NVDA), Broadcom (AVGO), and Advanced Micro Devices (AMD), many companies from the Industrials sector are also riding the wave—and increasingly outperforming.
For example, Comfort Systems USA (NYSE: FIX), a top performer in our Q1 Baker’s Dozen, is a leader in heating, ventilation, and air conditioning (HVAC), which are critical for datacenters that produce a lot of heat, and the firm is particularly adept at modular design (premade in a factory rather than on-site), which speeds up the construction process. Its 132% return for the year bests all the aforementioned chipmakers. Similarly, Sterling Infrastructure (STRL) is a top performer in our Q2 and Q3 Baker’s Dozen portfolios, and Flowserve (FLS) is the leader in our newest Q4 Baker’s Dozen. All are infrastructure players from the Industrials sector.
This suggests that the bigger cyclical opportunity, at least for the near-to-mid-term, might be with infrastructure builders from the Industrials sector. Longer term, given the uncertain timelines and backlogs for the builders, the even better opportunity might be those companies that can successfully monetize AI through new product development and higher productivity, as investment capital rotates from capex payers and payees to AI application and SaaS providers. As ServiceNow (NOW) CFO emphasized, "AI matters only if it drives real outcomes," and his company is on track for $1 billion in AI revenue in 2026.
Of course, many commentators are comparing the current AI-driven market to the dot-com bubble of the late 1990s. Indeed, the charts seem to support the thesis. Today’s AI-driven capex boom, funded by the massive, cash-rich Big Tech juggernauts, rivals or exceeds the scale of the dot-com era’s buildout of undersea fiber optic cable, optical networks, server farms, water cooling systems, and telecom. But it is being funded and structured quite differently. In the 1990s, the buildout was led by a group of new telecom entrants (like Global Crossing, Level 3, Qwest, WorldCom, FLAG) plus some incumbents (like the Baby Bells and cable companies)—financed heavily with debt and equity raised at bubble valuations and backed by long-term bandwidth resale models that relied upon demand to arrive quickly (but didn’t, at least not fast enough to stave off bankruptcies).
But today, a handful of immensely profitable companies are pouring well over $200 billion a year (roughly 1% of US GDP) into GPUs, hyperscale datacenters, private fiber, and the critical energy infrastructure to power it all. Asset turnover is faster (as better designs rapidly emerge), financing is sounder, and the risk lies less in collapse of the companies than in whether AI applications will ultimately generate the ROIC that justifies what has become the largest private-sector buildout in modern history. Brad Gerstner, entrepreneur and CEO of Altimeter Capital, believes the market opportunity will be even greater than today’s lofty predictions, but the path will not be a straight line and will be plagued by risk-off periods of investor worry—much like what we saw with the emerging internet, mobile phones, and cloud computing, all of which ultimately wildly exceeded expectations on transforming our lives and workplaces.
Remember Amara’s Law (by scientist and futurist Roy Amara), “We tend to overestimate the effect of technology in the short run and underestimate the effect in the long run.”
BofA analyst Vivek Arya wrote, “The pervasive skepticism re AI capex is understandable but likely a contrarian positive, helping minimize overcrowding,” and he restated his conviction. And analyst Dan Ives of Wedbush Securities wrote, “While the bears will continue to yell ‘AI Bubble’ from their hibernation caves, we continue to point to this tech cap-ex supercycle that is driving this 4th Industrial Revolution into the next few years.”
Notably, Eric Peters of One River Asset Management observed that while the S&P 500 nearly tripled during the 5-year period of mid-1995 through mid-2000, gold fell 25%. But today, gold has been on a tear, doubling over the past 2 years. Typically, booms end in a deflationary bust, but today’s boom in his view may be destined for either an inflationary next-stage boom or a bust that forces the Fed into a massive—and inflationary—QE response. Peters offers for consideration that today’s positive correlation between AI stocks and gold might be suggestive of an “inflationary innovation paradigm” such that the Fed should be hiking rates rather than cutting (although I’m sure debt-dependent small businesses, capital-intensive value stocks, and the “little guy” who doesn’t own stocks and is struggling to buy a house would object).
Inflation, M2, and the Fed:
Due to the government shutdown, September CPI was reported late last month, and PPI and PCE not at all. October readings likely will be delayed as well. Nevertheless, as I discussed in my October post, September CPI showed moderating core services and a general cooling across many key categories. Although energy prices were notably higher, this obviously fluctuates. More importantly, stubbornly high shelter costs—which make up roughly 35% of CPI—are softening, with rents showing the smallest YoY increase since 2021. Moreover, New Tenant Rent historically presages overall shelter costs, and it has fallen dramatically. This allayed fears of resurgent inflationary pressures and gave the FOMC confidence to continue its rate-cutting path at its October meeting, with the current target at 3.75-4.00%. Fed funds futures now reflect 65% probability of another 25-bp cut at the December meeting and 73% odds of at least two more cuts during 2026, which would put the policy rate at 3.00-3.25% (or lower)—which is what I think is the neutral rate.
However, keep in mind that even when the CPI/PPI/PCE inflation reports get back on schedule, there has been no data collection while the government is shut down, which means the quality of the next few reports might be questionable. But we have alternative indicators that provide clues on current inflation trends, such as GSCPI, Truflation, TIPS breakevens (implied inflation expectation). The shortest measure of inflation expectations, the 2-year breakeven, has held steady at around 2.50%. And the real-time, blockchain-based Truflation (which is updated daily based on 30 million data points), which tends to presage CPI by several months, is also around 2.50% YoY.
In addition, the GSCPI supply chain pressure index has settled at or below the zero line since early 2023, and secular disinflationary trends and productivity improvements have resumed. Moreover, First Trust observed that the money supply is up only 1.7% since April 2022 and that goods prices (which are more impacted by import costs and tariffs) are up only +0.5% annualized over the past 6 months while services prices are up +1.4% annualized—all of which suggests an ongoing monetary tightness that should keep inflation subdued with room for additional rate cuts.
In the view of financial writer Phil Rosen: “The Fed must transition from a restrictive regime into one shaped by AI’s deflationary force and tariffs that have proven less inflationary than expected. The cut will indeed alleviate labor-market pressure and buoy asset prices, but more importantly it marks the initial policy adjustment in a new economic age where technology is working to bend the inflation curve lower. That, in theory, should give policymakers more room to ease than past cycles. So rather than chasing easy money or ‘firefighting,’ to borrow former Fed Chair Ben Bernanke’s language, the central bank must manage the transition into a world shaped by technology, debt, and liquidity.”
I have written often over the past few years about the relationships between M2 growth, velocity of money, GDP growth, and inflation. Nominal GDP growth equals money supply growth plus the change in velocity of money, so velocity will regulate any slight over/under supply of the required liquidity. Milton Friedman’s Monetarist Rule says money supply should increase at a stable rate close to the long-term economic growth rate (of 3-4% a year). But when the Fed is so fearful of a resurgence in inflation that it errs on the side of tightening, it raises the risk of a recession.
Final Comments:
I have written at length in the past about the scourge of government regulation and massive federal government largesse over recent years that crowded out and stagnated the private sector while surging federal debt, budget deficit, and inflation, including pandemic-era “helicopter money” to boost public spending and low- or zero-ROI spending on enhanced entitlements, boondoggles, and questionable subsidies for pet projects like decarbonization. In fact, estimates for total federal monies spent directly or as tax credits for climate initiatives since 1990 approach $2 trillion, and that doesn’t include perhaps another half-trillion dollars in private-sector spending to comply with carbon mitigation regulations. Fortunately, the Fed seems to be grudgingly softening its stance, and the One Big Beautiful Bill Act (OBBBA) has now codified tax policy and deregulation.
But now, at least one wealthy, vocal, climate change alarmist is finally recognizing the realities and backtracking from his doomsday narrative. I’m talking about Microsoft founder and philanthropist Bill Gates, who is now saying essentially the same thing that Energy Secretary Chris Wright has been saying all along—that climate change is real but manageable, and the benefits of fossil fuels greatly outweigh their drawbacks. It reminds me of the original SNL cast and Gilda Radner’s character Emily Litella, an elderly lady who was hard of hearing. She would go on a rant about a subject she had misunderstood, and then, after being corrected, she would say, “Oh, that’s very different…Never mind.”
Needless to say, all human advancements, technologies, habitats, and activities have both benefits and detriments; we just have to maximize the benefits while mitigating the detriments. Sending us back to the Stone Age, or even marginally cutting our standard of living, in the name of fighting climate change is not an option. The developing world is certainly not going to stop striving for more, and affordable energy is the lifeblood of an economy, as I discussed in my 3-part blog series on the “Future of Energy, the Lifeblood of an Economy” back in August..
Today, increasingly complex and power-hungry models are driving demand for semiconductors, datacenters, and energy production, including energy-dense nuclear power. Investors in AI and quantum computing envision solutions to our most intractable problems like cancer cures, ending world hunger, reversal of climate change, commercializing clean/cold nuclear fusion, fail-safe cybersecurity, and enhanced national security.
And according to the good folks at Real Investment Advice (RIA), “From the deficit narrative perspective, this all suggests that the future is potentially much brighter than most imagine. The infrastructure buildout for AI data factories can drive economic growth by creating jobs, stimulating industries, and enabling AI-driven productivity gains… Increasing growth only marginally would stabilize the current debt-to-GDP ratio. However, boosting GDP growth to 2.3–3.0% annually would vastly improve outcomes. Furthermore, if interest rates drop by just 1%, this could reduce spending by $500 billion annually, helping to ease fiscal pressures.”
Lastly, remember that the US remains the growth engine of the world, and foreign capital will continue to flow here, as it always does, especially during uncertain times. And as any foreign investor will tell you, there is no other place in the world like the US to invest capital for the innovation, shareholder-friendly policies, and return on shareholder capital, given our entrepreneurial culture, technological leadership in disruptive innovation, strong management, low interest-rate exposure, global scalability, wide protective moats, and our reliable and consistently strong earnings growth, free cash flow, margins, and return ratios. And given passage of the Genius Act and the promotion of US dollar-backed stablecoins, the world should continue to rely on the dollar for the foreseeable future.
As economist and liquidity guru Michael Howell of CrossBorder Capital has long argued, “A nation that successfully attracts liquidity strengthens its currency, lowers its borrowing costs, and fuels investment in its technology and companies, creating a self-reinforcing cycle of economic and financial dominance.”
Latest Sector Rankings
Relative sector rankings are based on Sabrient’s proprietary SectorCast model, which builds a composite profile of each of over 1,400 equity ETFs based on bottom-up aggregate scoring of the constituent stocks. The Outlook Score is a Growth at a Reasonable Price (GARP) model that employs a forward-looking, fundamentals-based multifactor algorithm considering forward valuation, historical and projected earnings growth, the dynamics of Wall Street analysts’ consensus earnings estimates and recent revisions (up or down), quality and sustainability of reported earnings, and various return ratios. It helps us predict relative performance over the next 3-6 months.
In addition, SectorCast computes a Bull Score and Bear Score for each ETF based on recent price behavior of the constituent stocks on particularly strong and weak market days. A high Bull score indicates that stocks held by the ETF recently have tended toward relative outperformance when the market is strong, while a high Bear score indicates that stocks within the ETF have tended to hold up relatively well (i.e., safe havens) when the market is weak. Outlook score is forward-looking while Bull and Bear are backward-looking.
As a group, these three scores can be helpful for positioning a portfolio for a given set of anticipated market conditions. Of course, each ETF holds a unique portfolio of stocks and position weights, so the sectors represented will score differently depending upon which set of ETFs is used. We use the iShares that represent the ten major U.S. business sectors: Financials (IYF), Technology (IYW), Industrials (IYJ), Healthcare (IYH), Consumer Staples (IYK), Consumer Discretionary (IYC), Energy (IYE), Basic Materials (IYM), Telecommunications (IYZ), and Utilities (IDU). Whereas the Select Sector SPDRs only contain stocks from the S&P 500 large cap index, I prefer the iShares for their larger universe and broader diversity.
The table below shows the latest fundamentals-based Outlook rankings and my full sector rotation model:
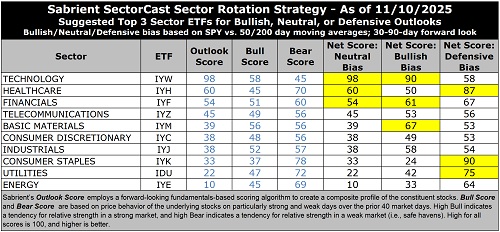
The latest rankings display a neutral bias, in my view, given that cyclicals, secular growth sectors, and defensive sectors are interspersed across the rankings. Only 3 sectors score above 50 on Outlook score.
Technology (dominated by the mega-cap Big Tech titans and AI-driven highflyers) remains at the top with a robust Outlook score of 98, despite having by far the highest forward P/E—a lofty 29.5x (although somewhat lower than the 31x it hit a few months ago). However, because of its rising EPS growth estimate of 21.0%, the forward PEG (ratio of P/E to EPS growth) of 1.41 remains relatively modest. Keep in mind, investors are quite willing to “pay up” for strong growth. Tech also displays strongly positive sell-side analyst earnings revisions, the highest profit margins and return ratios, and solid insider sentiment (open market buying). Because many Tech stocks are riding secular growth trends (i.e., little cyclicality), no other sector comes close to the consistent sales growth, margins, operating leverage, and return on capital. And Tech not only benefits from its own product development and productivity gains, but those products help other companies with their product development, product delivery, and productivity—so Tech benefits by helping all sectors grow and prosper.
Rounding out the top 7 are Healthcare, Financials, Telecom, Basic Materials, Consumer Discretionary, and Industrials—with the latter 4 are pretty much bunched together. Financials displays the lower forward P/E of 14.1x and the second lowest forward PEG of 1.09. Basic Materials has the lowest forward PEG of 0.85 due mainly to a strong projected EPS growth rate of 19.0%.
At the bottom of the rankings remain Energy and Utilities. Because of the capital spending going into building out the power grid and infrastructure, Utilities has been a solid performer this year, even though the sector is typically considered to be a defensive “bond proxy” dividend play. However, the Utilities sector as a whole suffers from relatively high valuations for only modest projected earnings growth over the next 12 months (8.9%) and a high forward PEG of 2.19, but this should change with the datacenter buildout and future ramp-up in power demand. Although US electricity consumption has been increasing only gradually over the past few years, ICF International forecasts a 25% increase in by 2030 and 78% by 2050, driven largely by AI-related initiatives.
Keep in mind, the Outlook Rank does not include timing, momentum, or relative strength factors, but rather reflects the consensus fundamental expectations at a given point in time for individual stocks, aggregated by sector.
Notably, our ETF rankings continue to display much stronger Outlook scores for the cap-weight indexes, like SPY (56) and QQQ (84), over the equal-weight indexes, like RSP (33) and QQQE (44), which reflects the higher quality of the mega cap companies that dominate the cap-weight indexes. When we talk about “high-quality,” we mean that it displays a history of consistent, reliable, resilient, durable, and accelerating sales, earnings, and free cash flow growth, rising profit margins, a history of meeting/beating estimates, high capital efficiency and ROI, solid earnings quality and conservative accounting practices, a strong balance sheet, low debt burden, competitive advantage, and a reasonable valuation compared to its peers and its own history.
Sector Rotation Model and ETF Trading Ideas
Our rules-based Sector Rotation model, which appropriately weights Outlook, Bull, and Bear scores in accordance with the overall market’s prevailing trend (bullish, neutral, or defensive), continues to suggest a bullish bias, which it returned to way back in May when the SPY closed solidly above both its 200-day and 50-day moving averages. (Note: In this model, we consider the bias to be bullish from a rules-based trend-following standpoint when SPY is above both its 50-day and 200-day simple moving averages, but neutral if it is between those SMAs while searching for direction, and defensive if below both SMAs.)
As highlighted in the table above, the Sector Rotation model suggests holding Technology (IYW), Basic Materials (IYM), and Financials (IYF). However, if you prefer a neutral stance, it suggests holding Technology, Healthcare (IYH), and Financials. Or, if you prefer to take a defensive stance, it suggests holding Consumer Staples (IYK), Healthcare, and Utilities (IDU).
Here is an assortment of other interesting ETFs that are scoring well in our latest rankings: Sprott Active Gold & Silver Miners (GBUG), VanEck Technology TruSector (TRUT), VanEck Gold Miners (GDX), Global X PureCap MSCI Information Technology (GXPT), iShares Global Tech (IXN), VanEck Junior Gold Miners (GDXJ), Themes Silver Miners (AGMI), CastleArk Large Growth (CARK), Fidelity Blue Chip Growth (FBCG), Columbia Select Technology (SEMI), Invesco S&P SmallCap Quality (XSHQ), Invesco Next Gen Media & Gaming (GGME), NYLI US Large Cap R&D Leaders (LRND), SP Fund S&P Global Technology (SPTE), iShares Technology Opportunities Active (TEK), Invesco Nasdaq Biotech (IBBQ), iShares ESG Aware MSCI USA Growth (EGUS), Janus Henderson Global Artificial Intelligence (JHAI), SPDR S&P Pharmaceuticals (XPH), AOT Growth and Innovation (AOTG), Touchstone Sands Capital US Select Growth (TSEL), First Trust Active Factor Small Cap (AFSM), Pacer US Small Cap Cash Cows Growth Leaders (CAFG), and Fidelity Stocks for Inflation (FCPI). All score in the top decile (90-100) of Sabrient’s Outlook scores.
More By This Author:
Is The Market Finally Ready For A Value Rotation?Stocks Enter Q4 With Fed, Tax, Earnings, And AI Tailwinds, But Also Lofty Valuations
The Future Of Energy Is Nuclear – Part 3
Disclaimer: Opinions expressed are the author’s alone and do not necessarily reflect the views of Sabrient. This newsletter is published solely for informational purposes only. It is ...
more

