


Key Market Outlook(s) and Pick(s)
On Monday, I joined Cheryl Casone on Fox Business’ Mornings with Maria to discuss markets, the economy, the Fed, rates, and more. Thanks to Maria Bartiromo, Cassie Loeloff, Alexa Spilotras, and Cheryl for having me on.
On Tuesday, I joined the great Stuart Varney on Fox Business’ Varney & Co. to discuss markets, the economy, outlook, rates, healthcare, defensives, oil, Baxter (BAX), Stanley Black & Decker (SWK), Tesla (TSLA), and a lot more. Thanks to Stuart, Maggie Edwards, and Nick Palazzo for having me on.
Disney Update
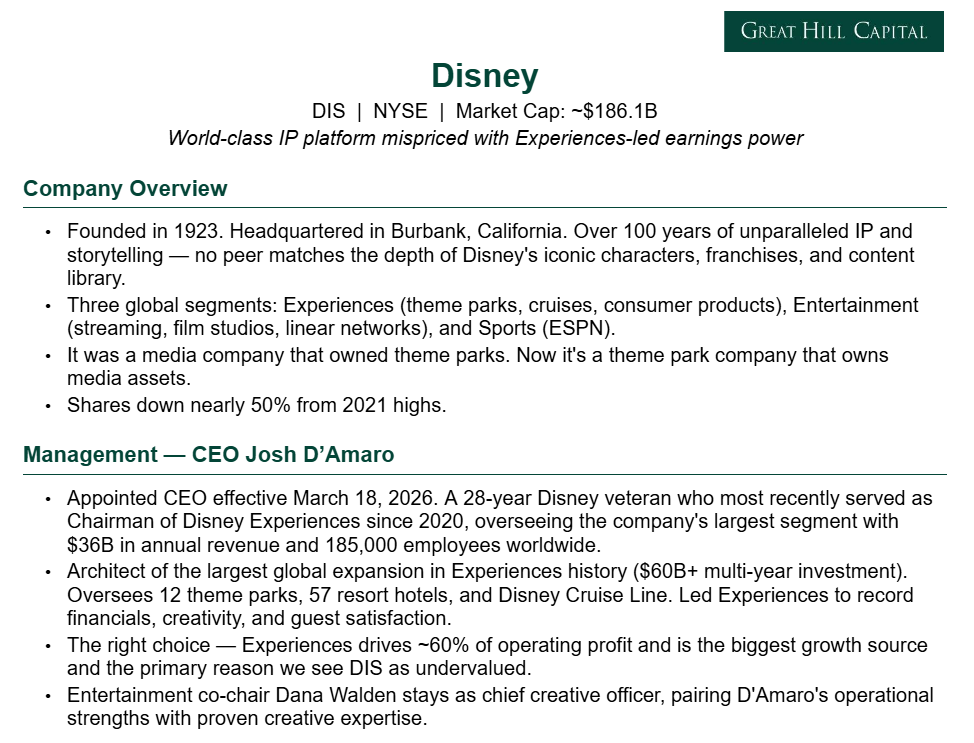
For newer readers, here’s a quick overview of the key drivers behind our thesis on Disney(DIS), once a media company with theme parks, now a theme park company with media along for the ride:
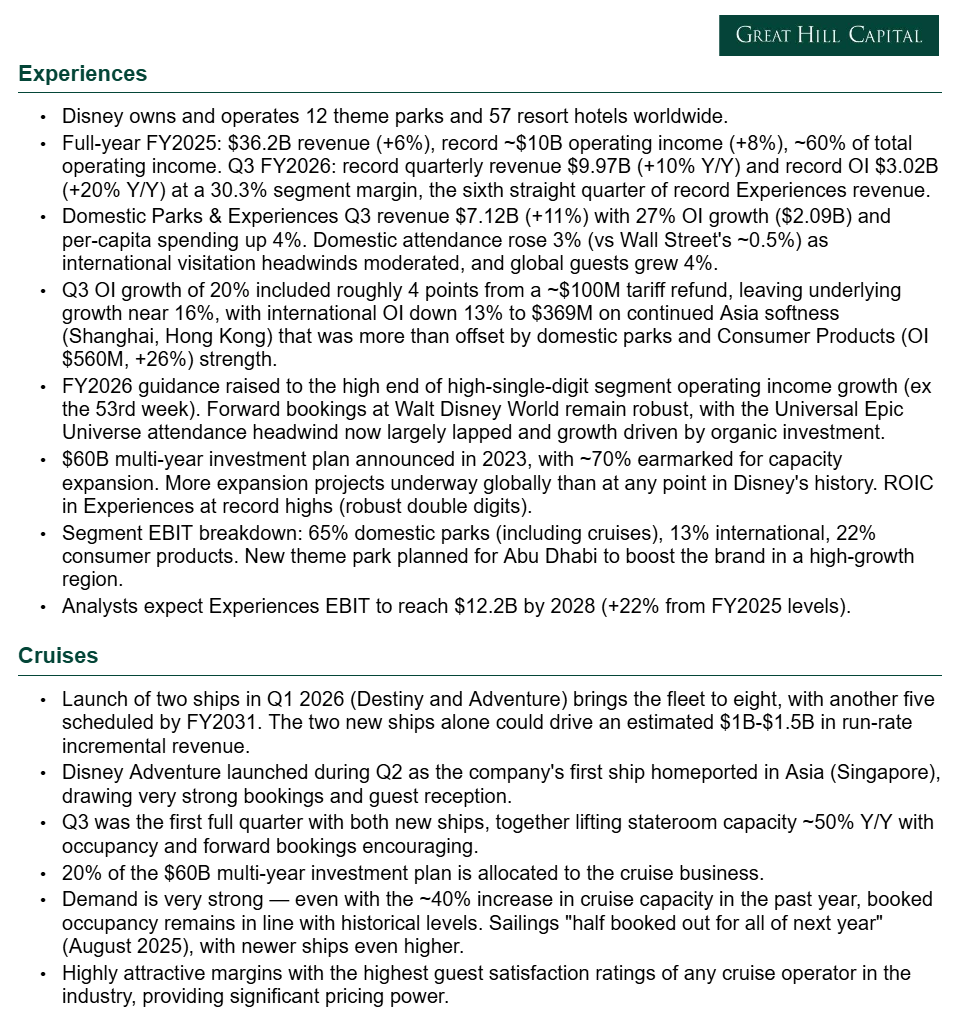
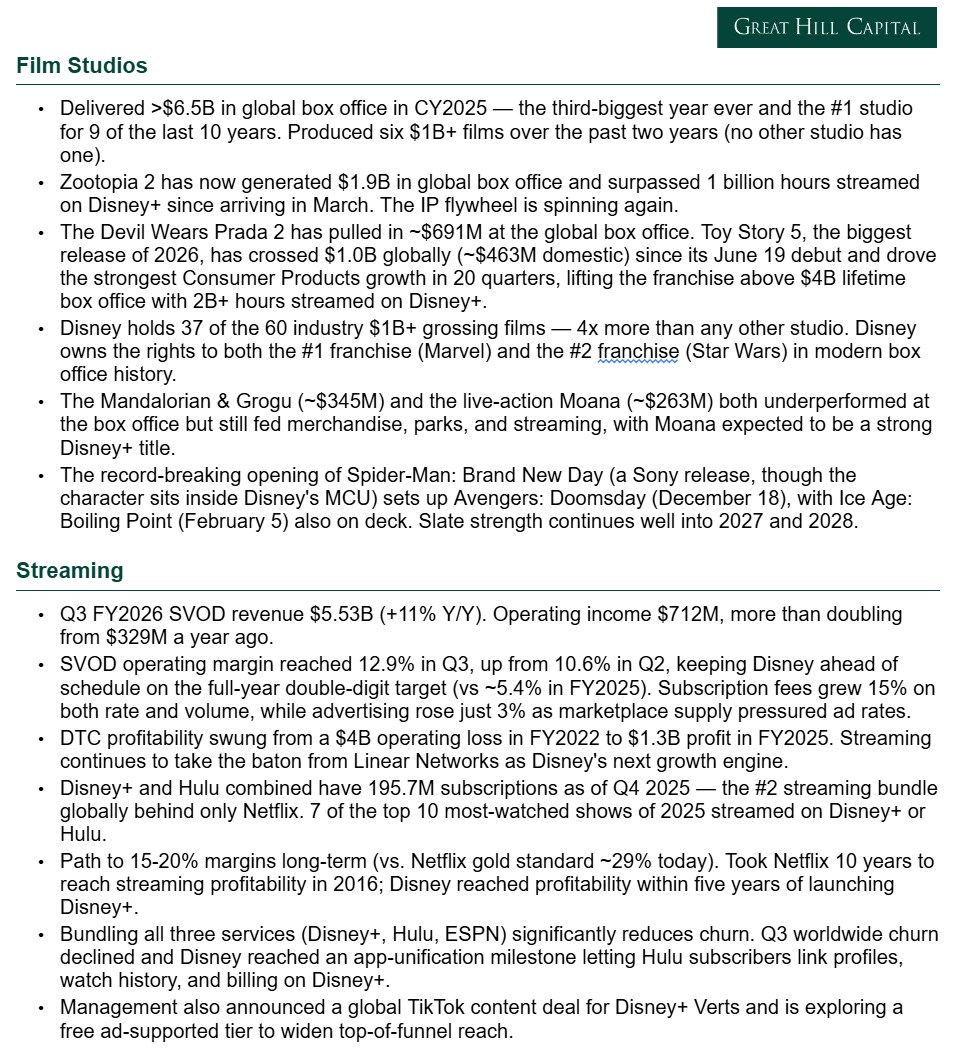
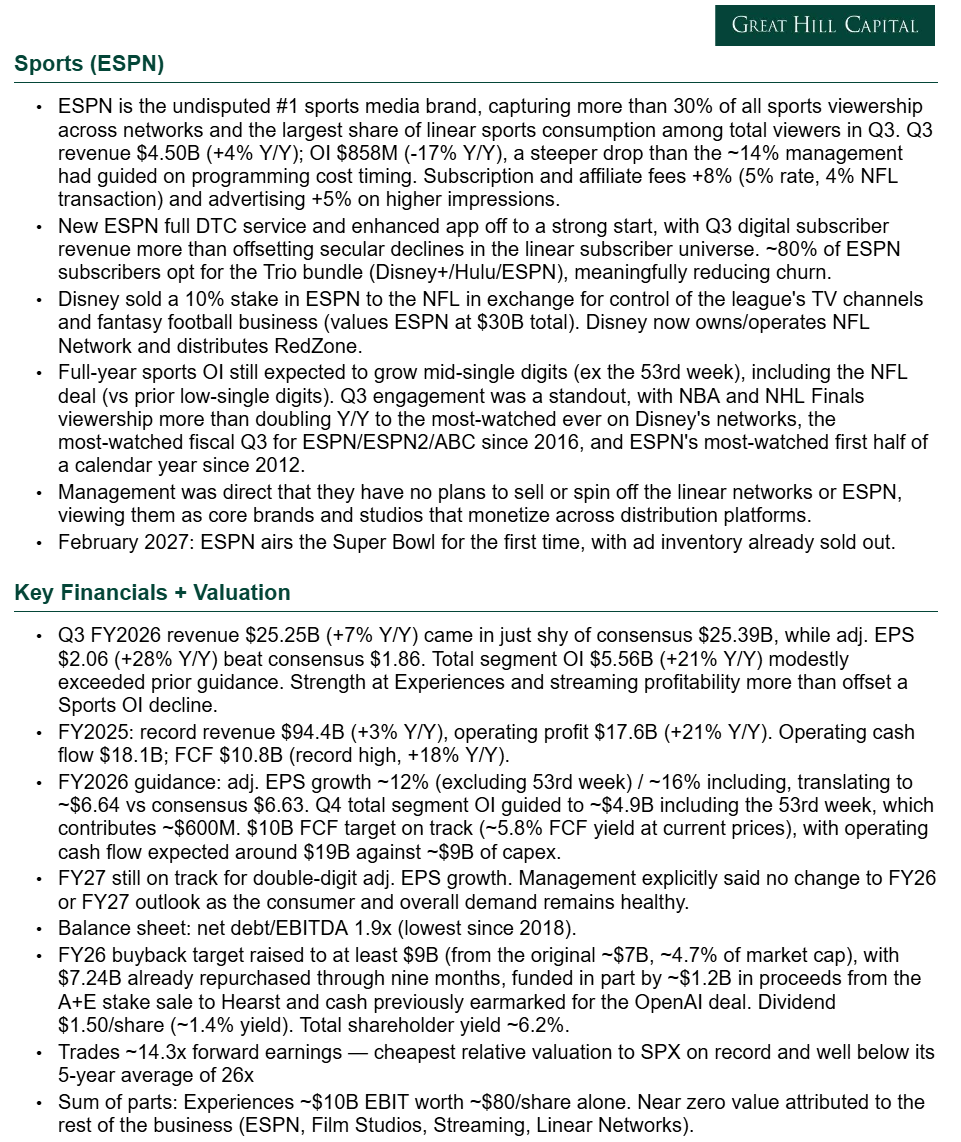
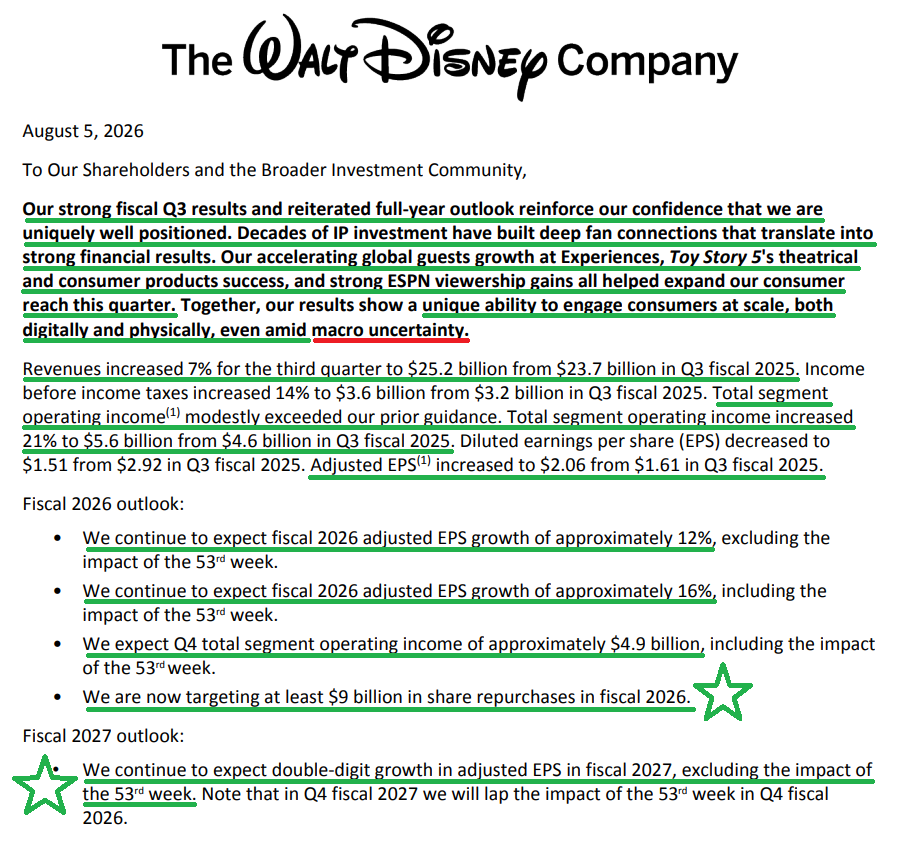
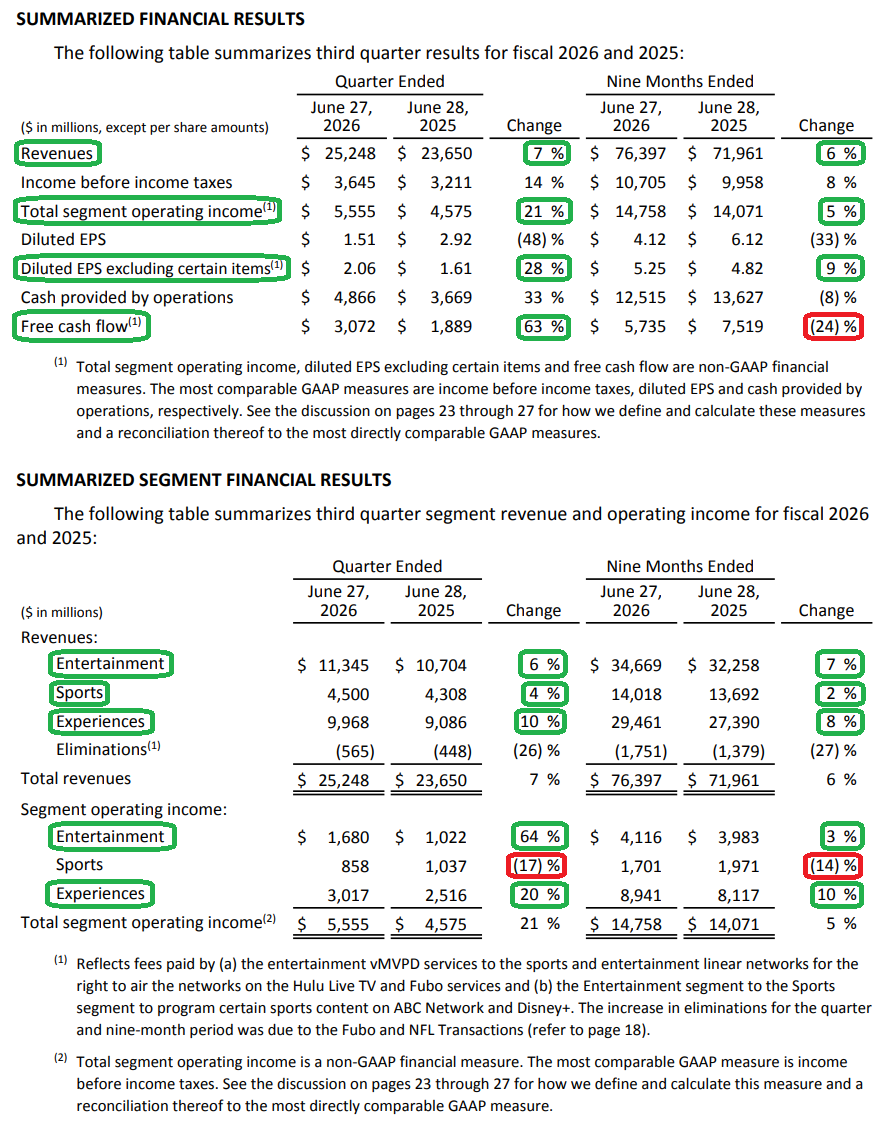
Quarter after quarter, more pieces of the Disney puzzle are falling into place. Revenue rose 7% to $25.25B on broad-based growth across all three segments. Total segment operating income grew 21% to $5.56B, ahead of management’s prior guidance of ~$5.3B, while adjusted EPS jumped 28% to $2.06, well ahead of the $1.86 consensus.
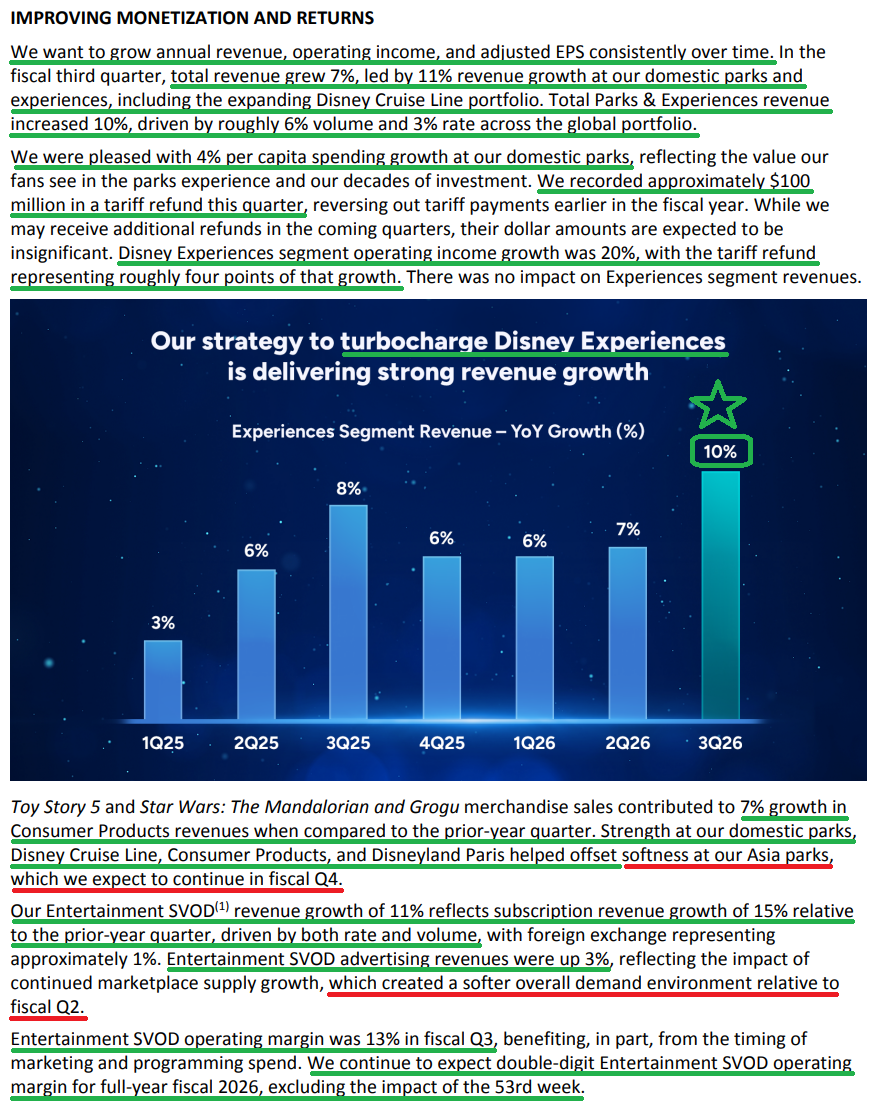
Behind those strong headline results were Disney’s two biggest needle movers firing on all cylinders. Experiences, which generates over 60% of total operating profit on just 39% of revenue, posted its sixth consecutive record revenue quarter at $9.97B. The 10% growth marked its fastest pace since Q2 FY2024 and came alongside record operating income of $3.02B (+20%).
Those results were all the more impressive given the backdrop heading into the quarter. Comcast (CMCSA) had just posted weak parks results in the weeks prior and blamed the softness on consumer sentiment and higher travel costs, weighing on Disney shares and leaving the Street braced for domestic attendance growth of just ~half a point. Instead, attendance jumped 3% and per-capita spending increased 4%, proof that consumers continue to vote with their wallets and choose Disney, with forward bookings at both Walt Disney World and Disney Cruise Line pointing to further strength ahead.
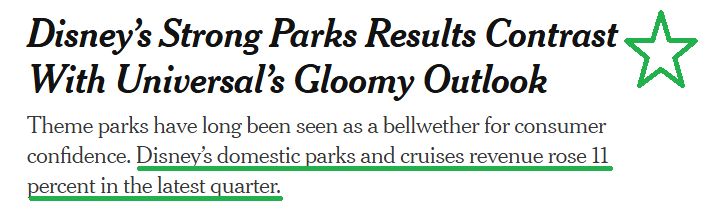
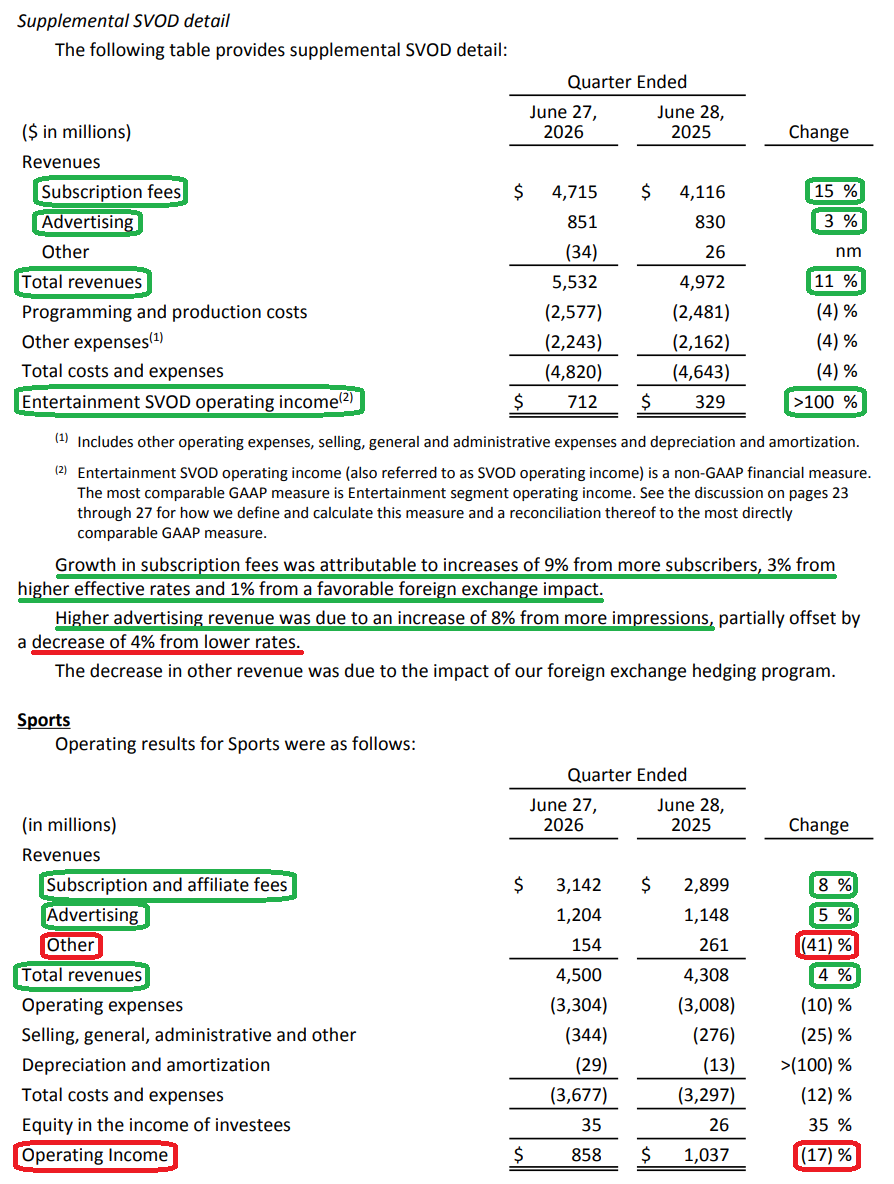
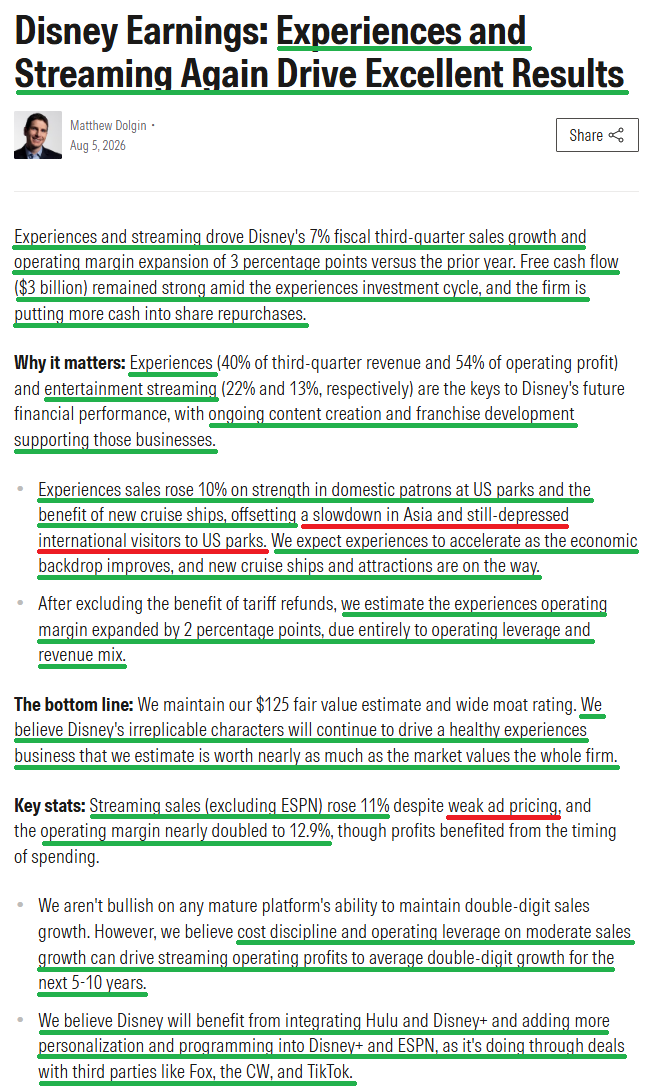
The other needle mover, Streaming, was equally impressive. Revenue grew 11% to $5.53B, while operating income more than doubled to $712M, driving a record 12.9% margin, up ~630 bps year over year and accounting for 13% of total segment operating profit. That brings year-to-date margins to 10.7%, putting Disney on track to reach its full-year double-digit margin target, up from ~5.4% in fiscal 2025.
With its two biggest growth drivers delivering, management reiterated its outlook for ~12% adjusted EPS growth this year excluding the 53rd week, or ~16% including it, alongside double-digit growth again in fiscal 2027.
Q3 marked two quarters under Josh D’Amaro’s belt, and both have reinforced why we called the Board’s decision the obvious one back in March. Experiences drives the majority of Disney’s operating profit and is the single biggest reason we see the stock as undervalued, so handing the keys to the executive who spent the previous six years building that business into a $36B powerhouse was the easy call. The only real question mark surrounding his appointment was his lack of experience on the creative side, a gap the Board closed by elevating Dana Walden to Chief Creative Officer, creating the best-of-both-worlds scenario few thought was on the table.
Even so, the market wanted proof before it was willing to celebrate. The D’Amaro era was always going to be a show-me story, and understandably so after the failed Chapek handoff. A CEO transition brings a degree of uncertainty at any company, let alone one as sprawling as Disney, where a new leader has every opportunity to put his own stamp on the strategy.
D’Amaro, for his part, has wasted no time making his direction known, backing it up with some big moves early on.
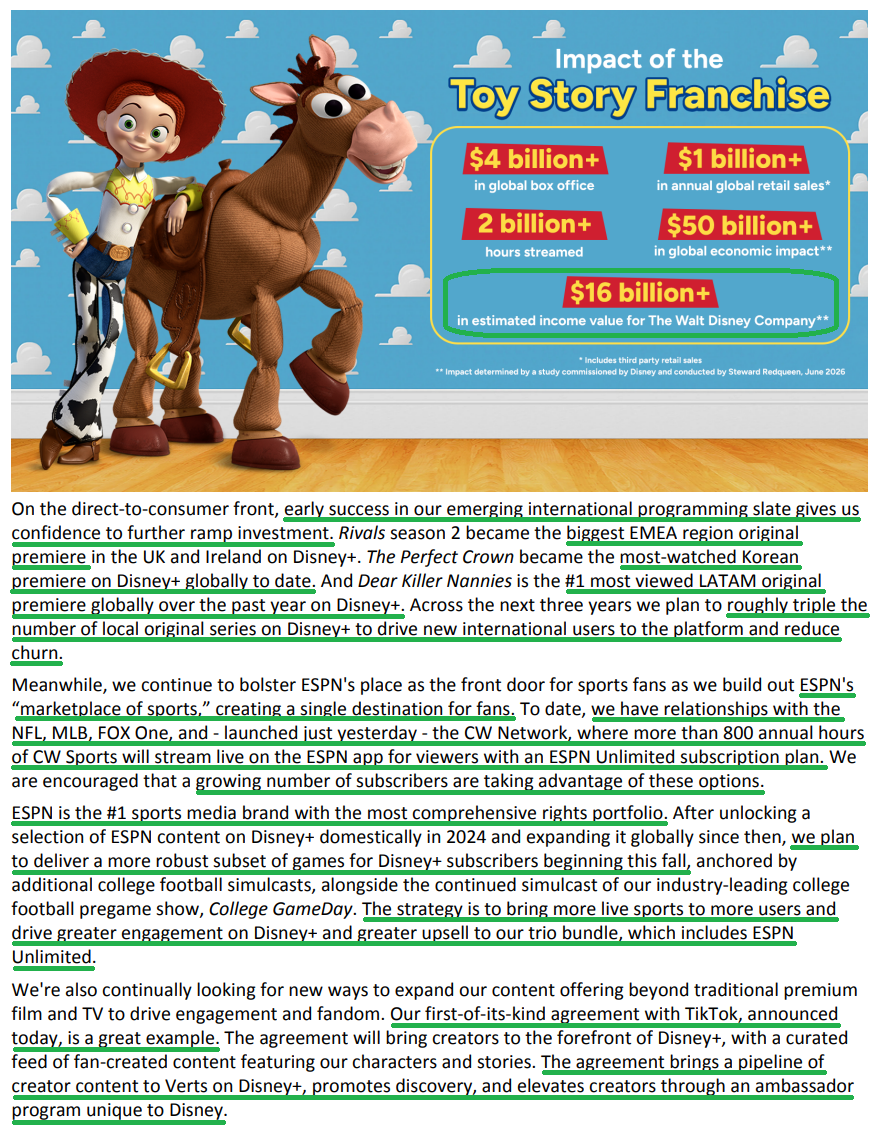
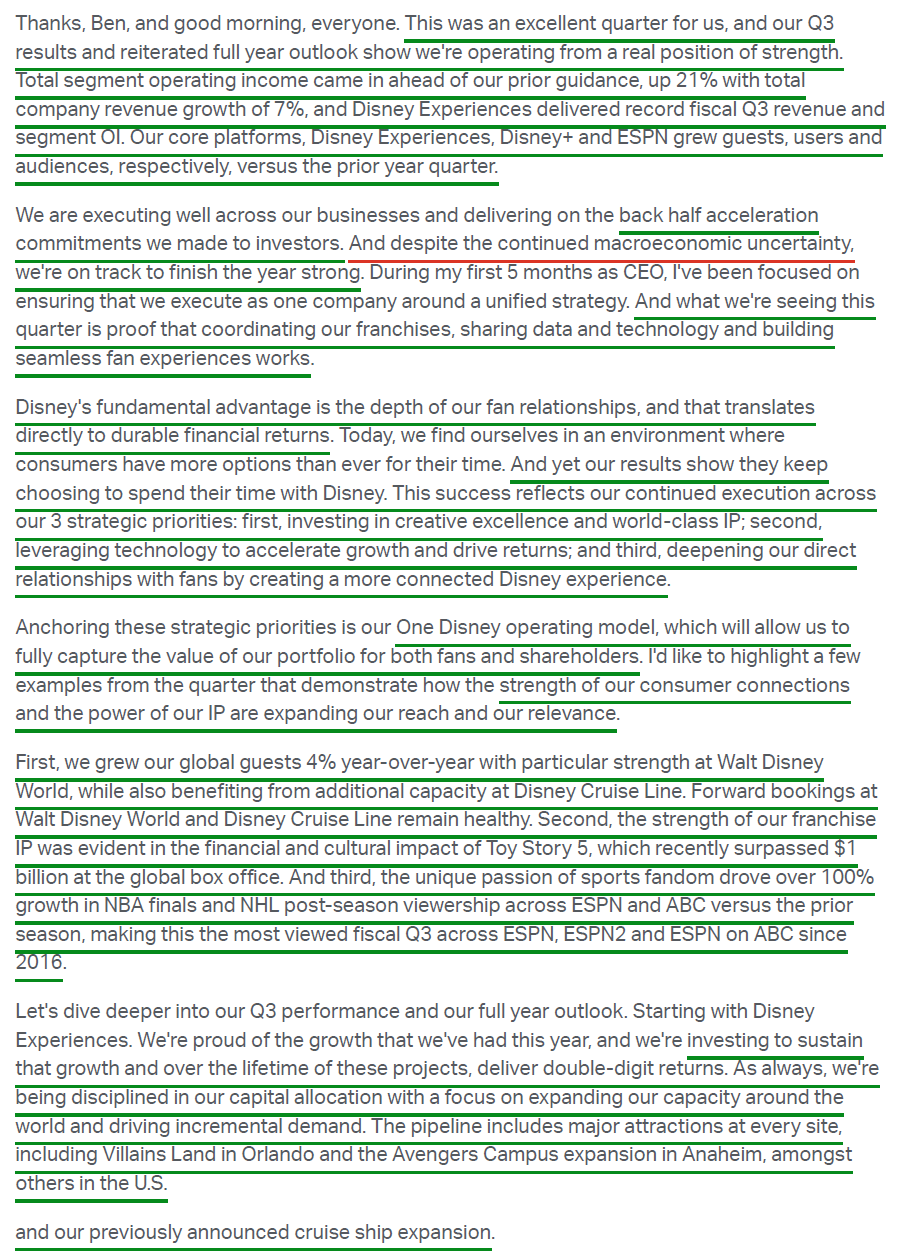
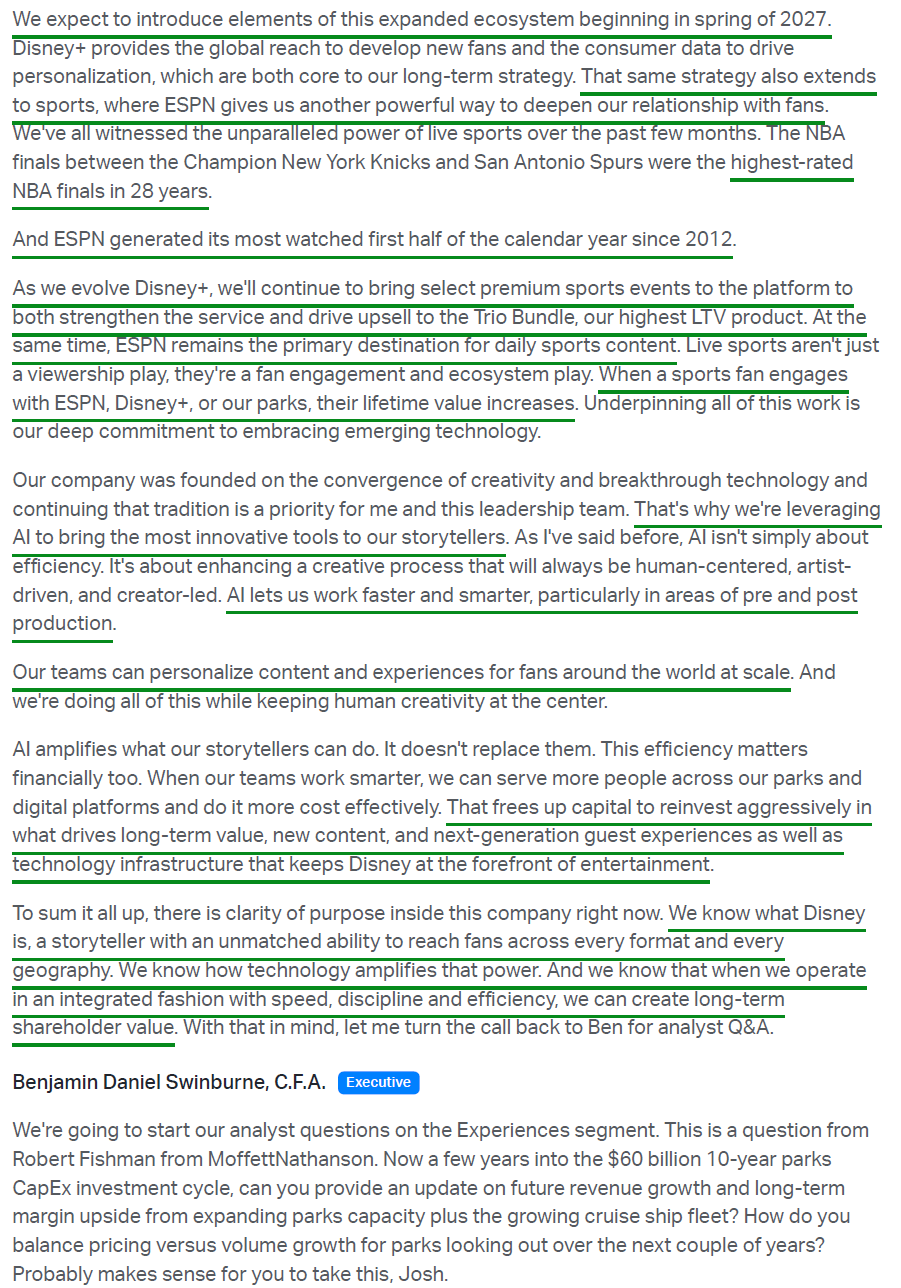
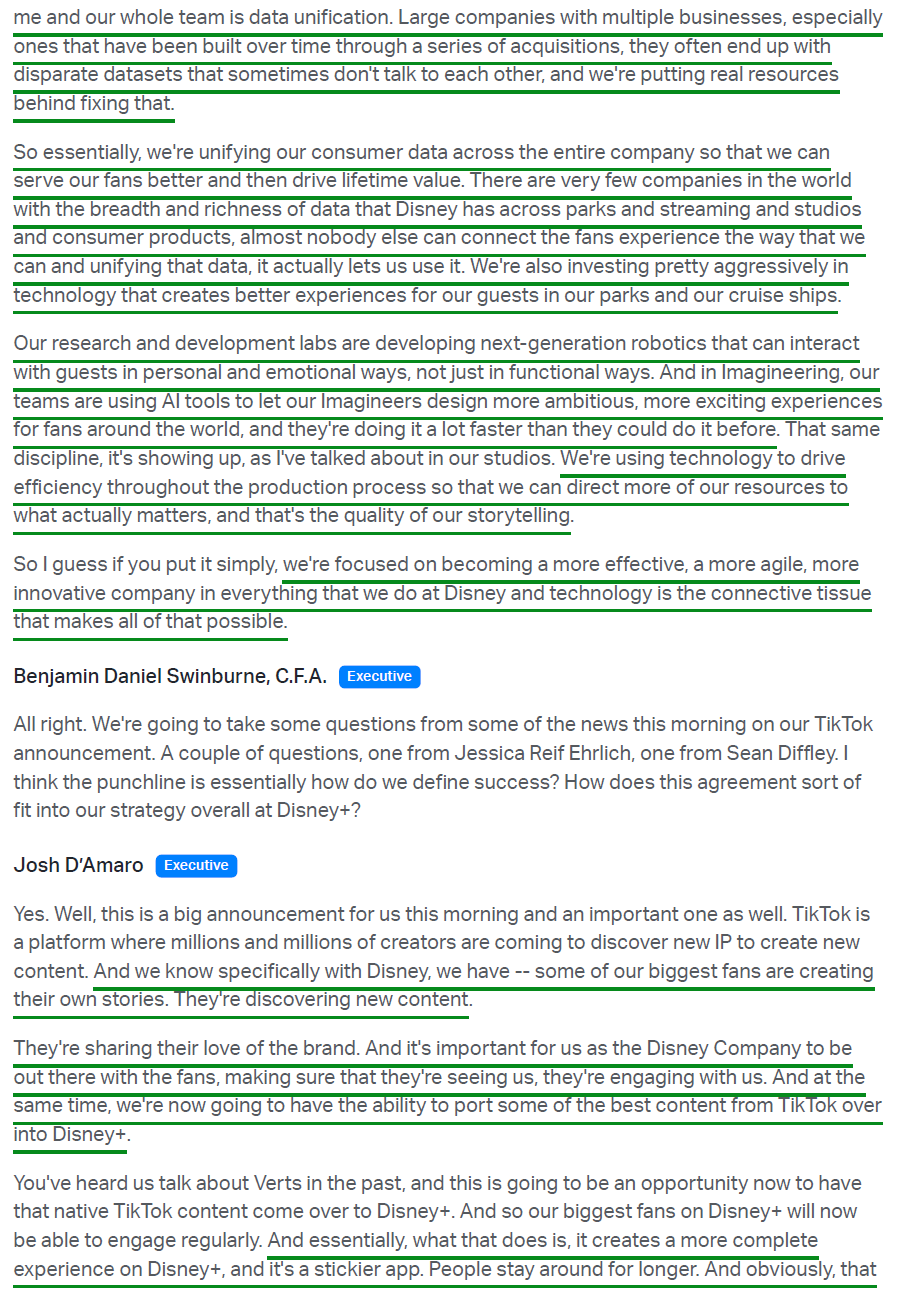
He has been explicit that Disney+ will become the digital centerpiece of the company, putting substance behind the “super app” speculation with a membership ecosystem set to roll out beginning in spring 2027, folding games, merchandise, and other benefits into the platform. The first-of-its-kind global TikTok agreement is aimed at the same end, driving engagement and pulling fans further into the Disney ecosystem.

He has been equally clear about technology as an accelerant, deploying AI across Imagineering and the studios to design and produce faster, simplifying the booking and planning journey for park guests, and unifying consumer data across parks, streaming, and consumer products.
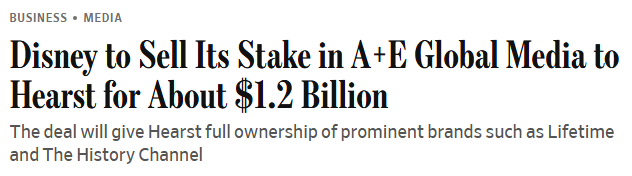
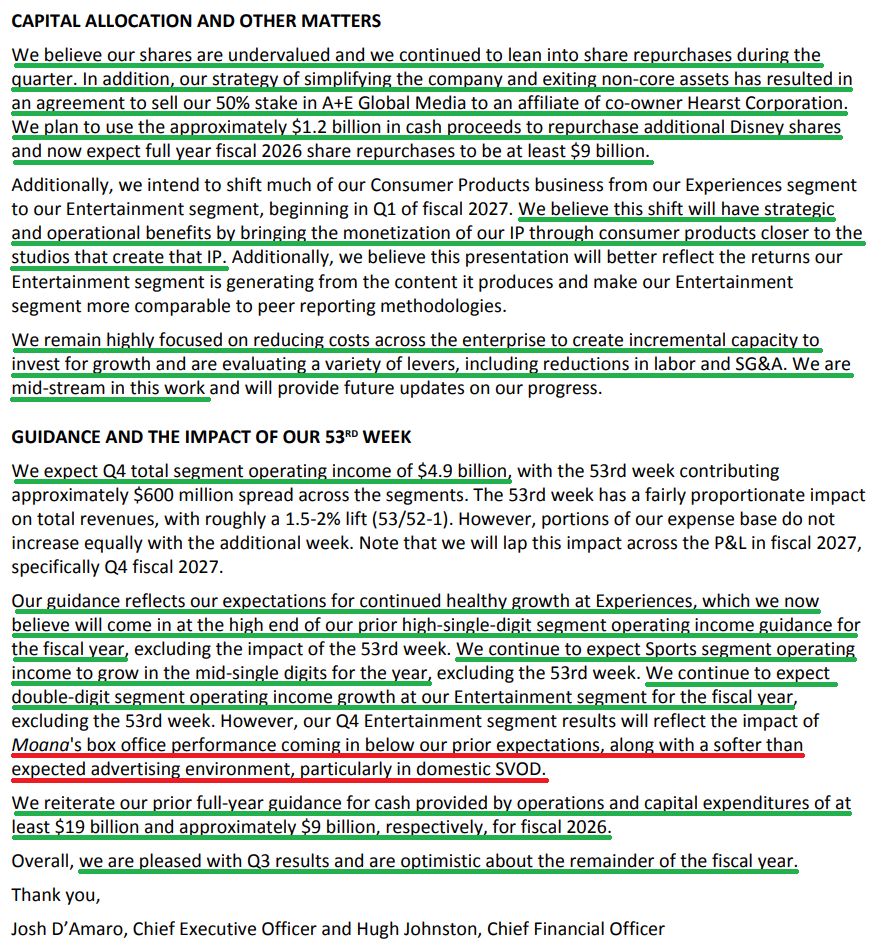
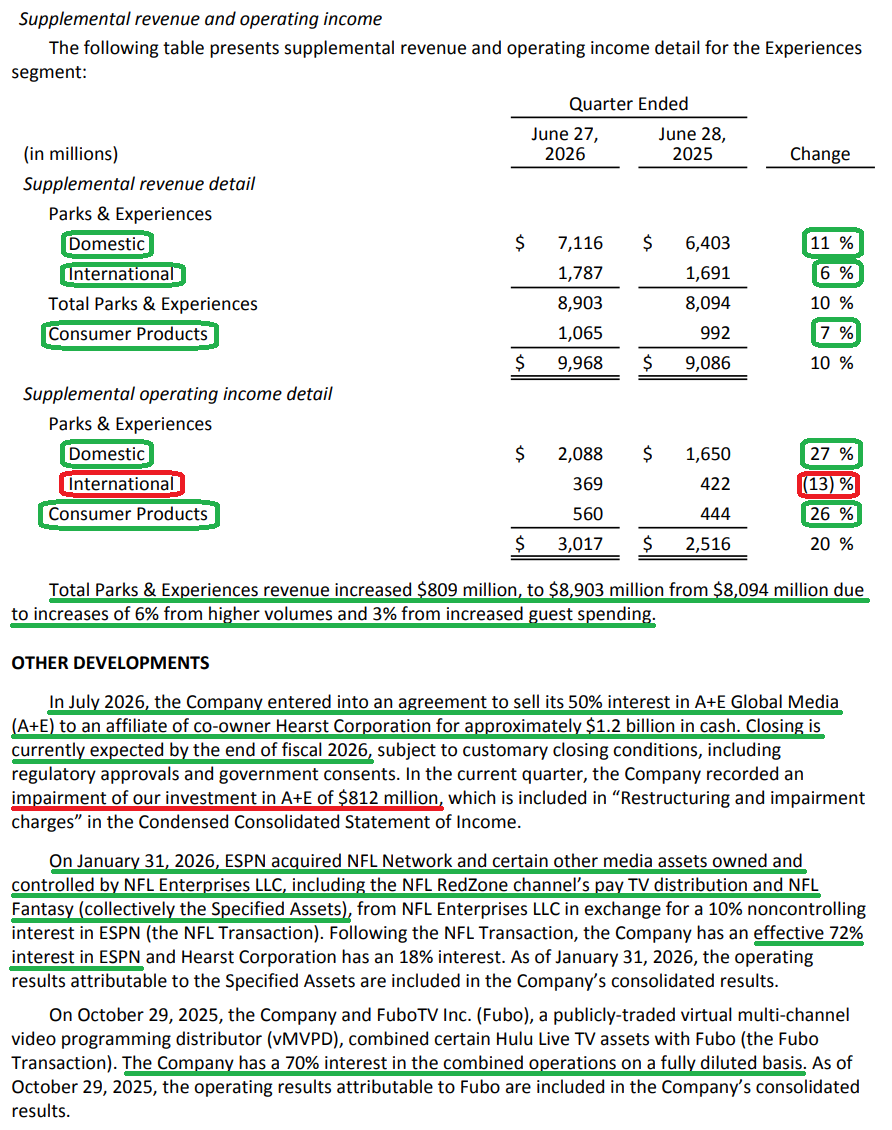
Just as important as where D’Amaro wants to take Disney is what he is willing to leave behind. The company agreed to sell its 50% stake in A+E Global Media to Hearst for ~$1.2B, shedding a non-core linear asset and directing the proceeds toward repurchases.
That clarity matters because of what it resolves. Succession aside, Disney’s discount over the past several years has largely reflected three major overhangs: streaming profitability, the future of its linear assets, and whether the film studio could regain its footing. One by one, those overhangs are being addressed.
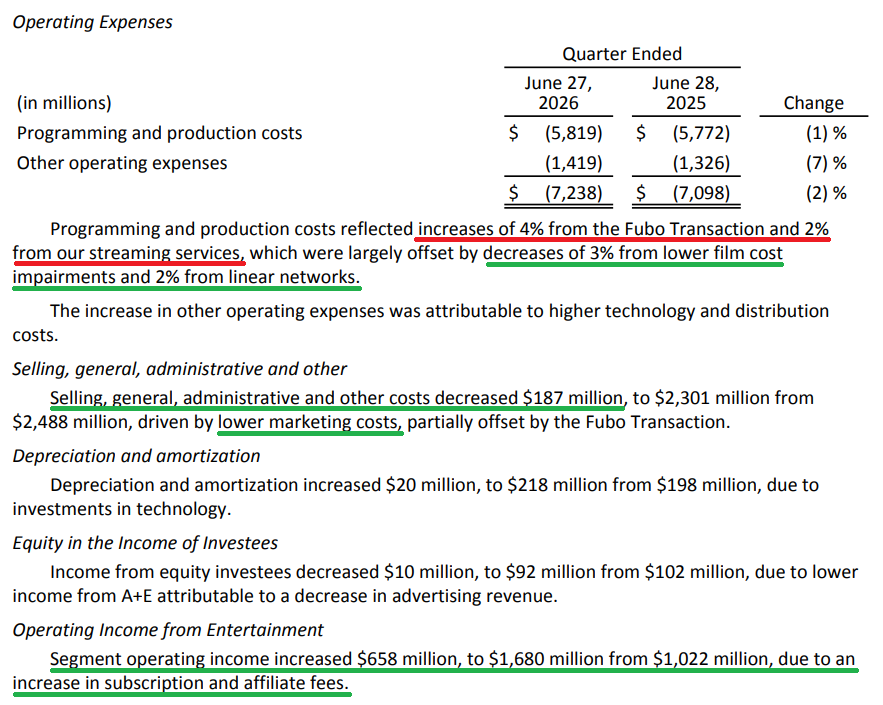
Streaming: Three years removed from incinerating ~$4B annually, Disney’s Entertainment streaming business has generated ~$1.74B of operating income year to date at a ~10.7% margin. More importantly, it is increasingly clear that Streaming can fill the profit gap left by Linear Entertainment Networks, with the business expected to overtake Linear Entertainment in operating profit for the first time this year.
There is still plenty of room for margins to move higher, especially compared with the industry gold standard, Netflix (NFLX), which sits just below 30%. Disney is pulling plenty of levers to close that gap, leaning into bundling, the completed Hulu integration, more live sports on the platform, and a deeper international slate, all aimed at increasing engagement and reducing churn.
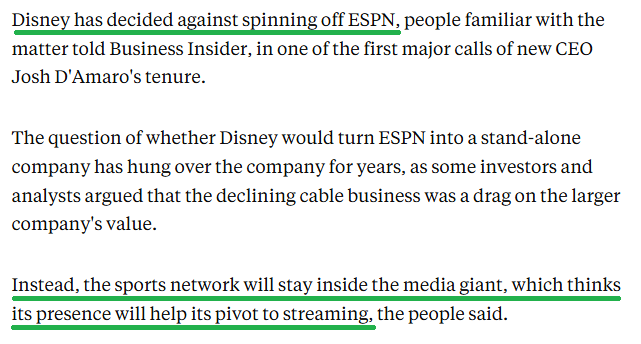
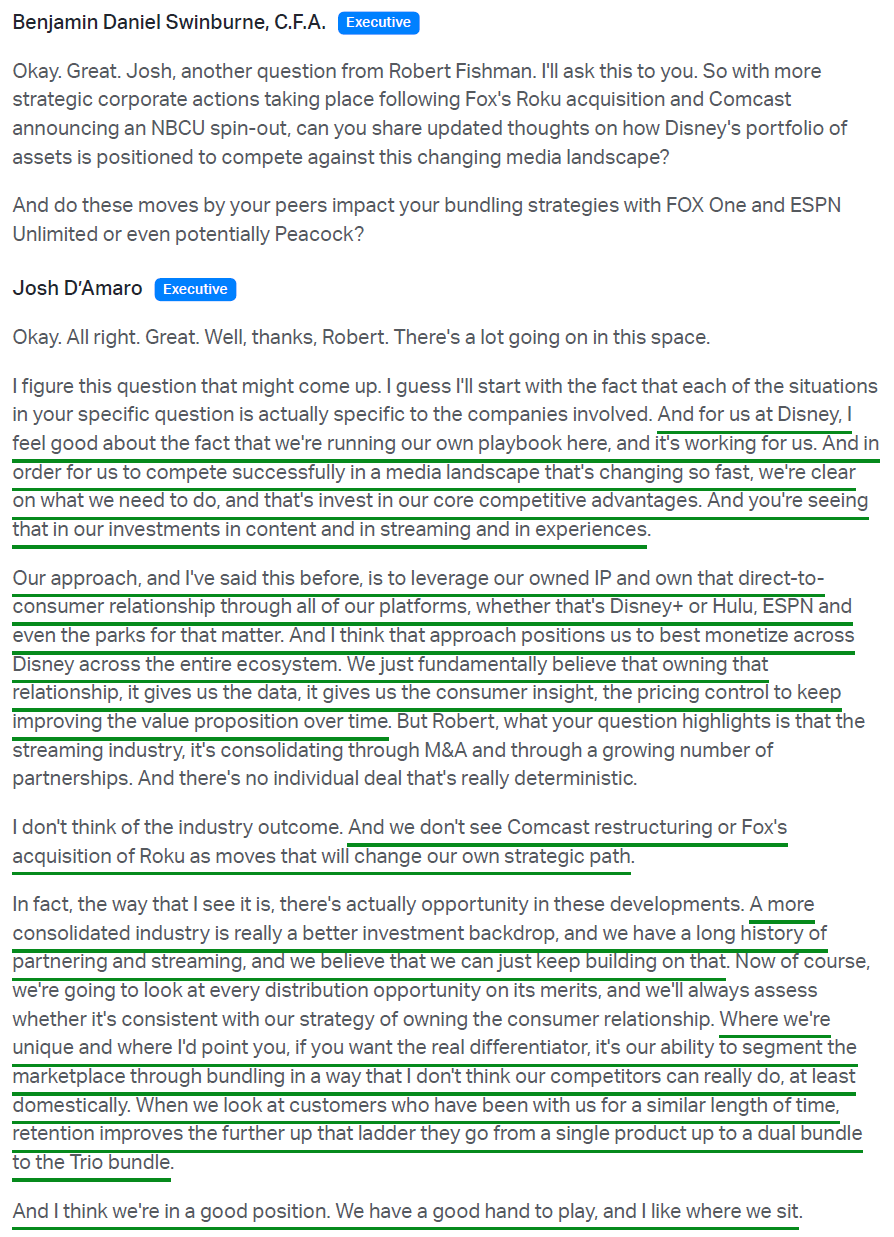
Linear assets: The persistent assumption was that Disney’s linear businesses would eventually be spun off, sold, or simply left to decay, which naturally raised lingering questions about ESPN’s future within the company. D’Amaro has been clear on that point, stating he has no interest in spinning off ESPN while moving to shed non-core assets like A+E. The strategy makes sense: keep the crown jewel and move on from the pieces that no longer fit.
Source: Business Insider
ESPN can get pushed to the back burner amid the broader Streaming and Experiences story, but let’s not forget what Disney still owns. ESPN remains the number one sports media brand in the world, generating $17.7B of revenue and $2.9B of operating profit in fiscal 2025, with profits still expected to grow at a mid-single-digit rate this year. Engagement remains strong, with ESPN posting its most-watched fiscal Q3 since 2016, while ad inventory for the network’s first-ever Super Bowl broadcast has already sold out.
Film studio. Where the film studio goes, Disney goes. It is the engine of the flywheel, with everything else, from streaming and consumer products to parks and cruise ships, ultimately monetizing the IP created there.
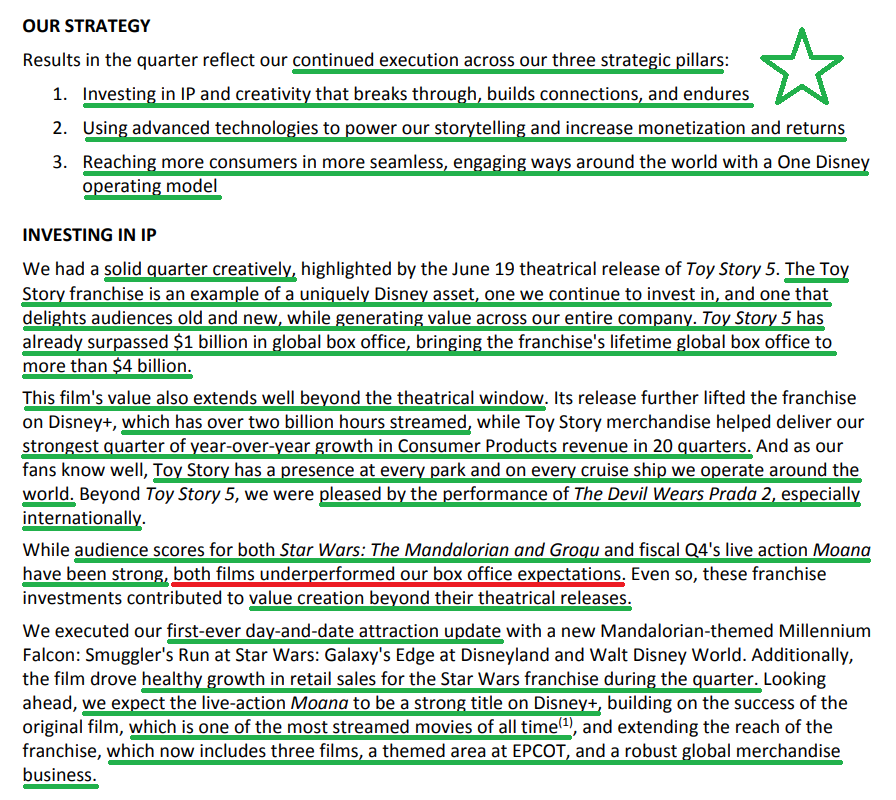
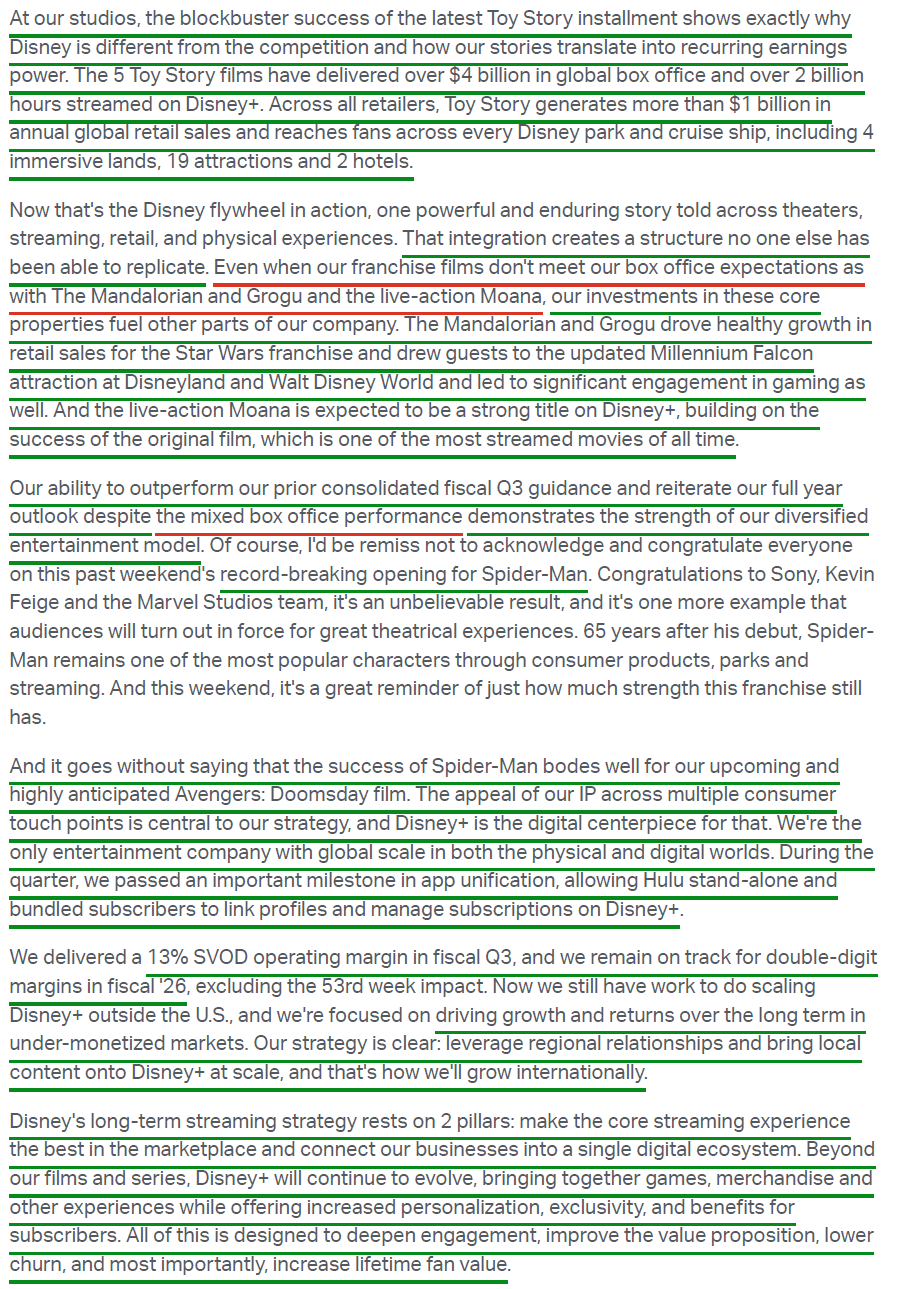
The volume-driven push of the streaming wars, which flooded the market with content, has given way to a renewed focus on quality, and after a tough stretch, Disney is getting its mojo back. The studio has now delivered seven $1B+ films since 2024, including Toy Story 5 crossing the mark this quarter and helping drive Disney’s strongest Consumer Products revenue growth in twenty quarters.
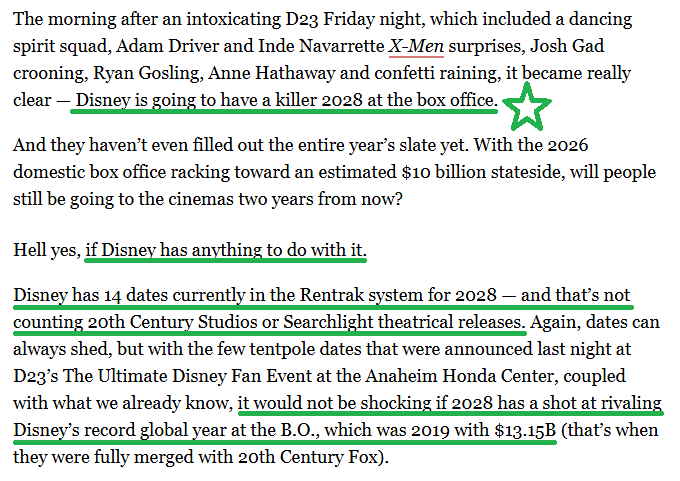
More importantly, the pipeline ahead is loaded. Avengers: Doomsday arrives in December, followed by new Ice Age, Star Wars, and Frozen films, along with a Bluey movie and another Avengers installment across 2027. The D23 slate extends that visibility even further, with Incredibles 3, Lilo & Stitch 2, X-Men, and Tangled among a 2028 lineup that the industry believes has a real shot at rivaling Disney’s record $13.15B global box office haul in 2019, roughly double the $6.58B generated in 2025.

Source: Deadline
Three overhangs. Three answers. And a new era under D’Amaro with the business humming.
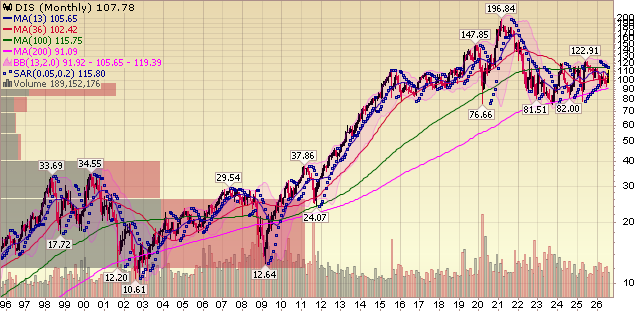
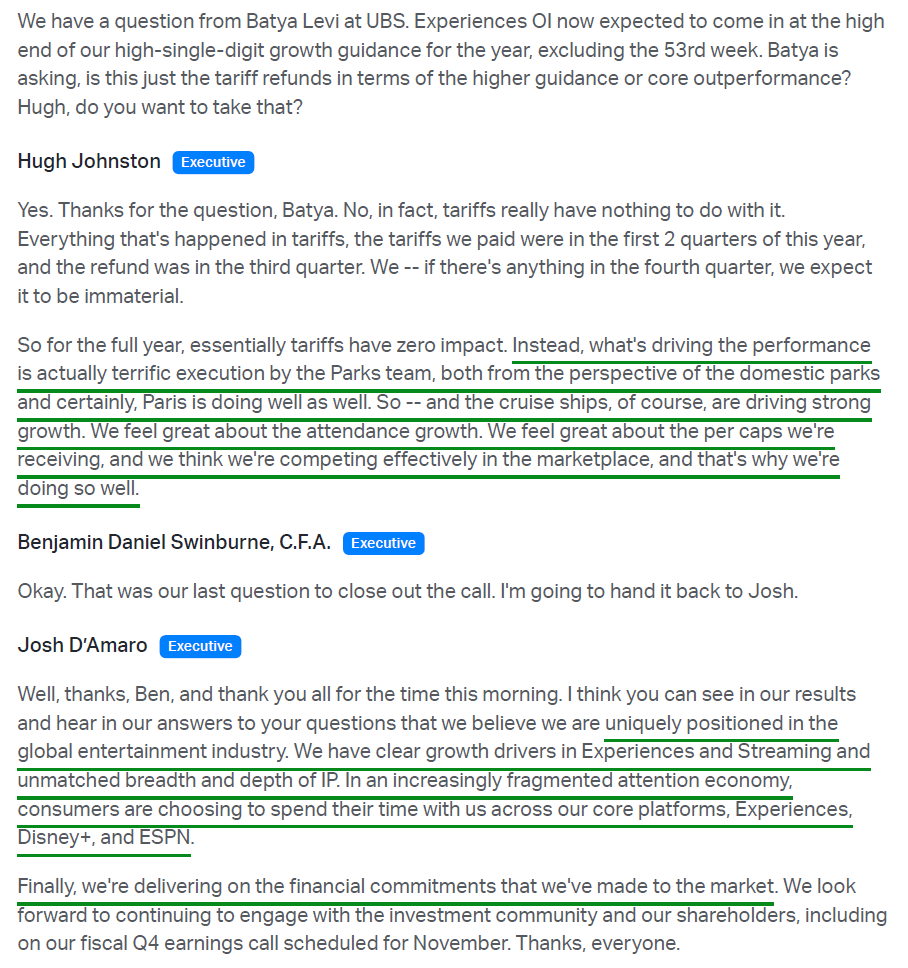
Despite this continued PROGRESS and strengthening FUNDAMENTALS, the PRICE still sits roughly where it traded in the summer of 2015. D’Amaro has made clear that he is not happy with the stock’s performance over the past decade, repeatedly calling shares dramatically undervalued. Management is acting accordingly, raising its full-year buyback target to at least $9B from the original $7B guide, with $7.24B already repurchased year to date.
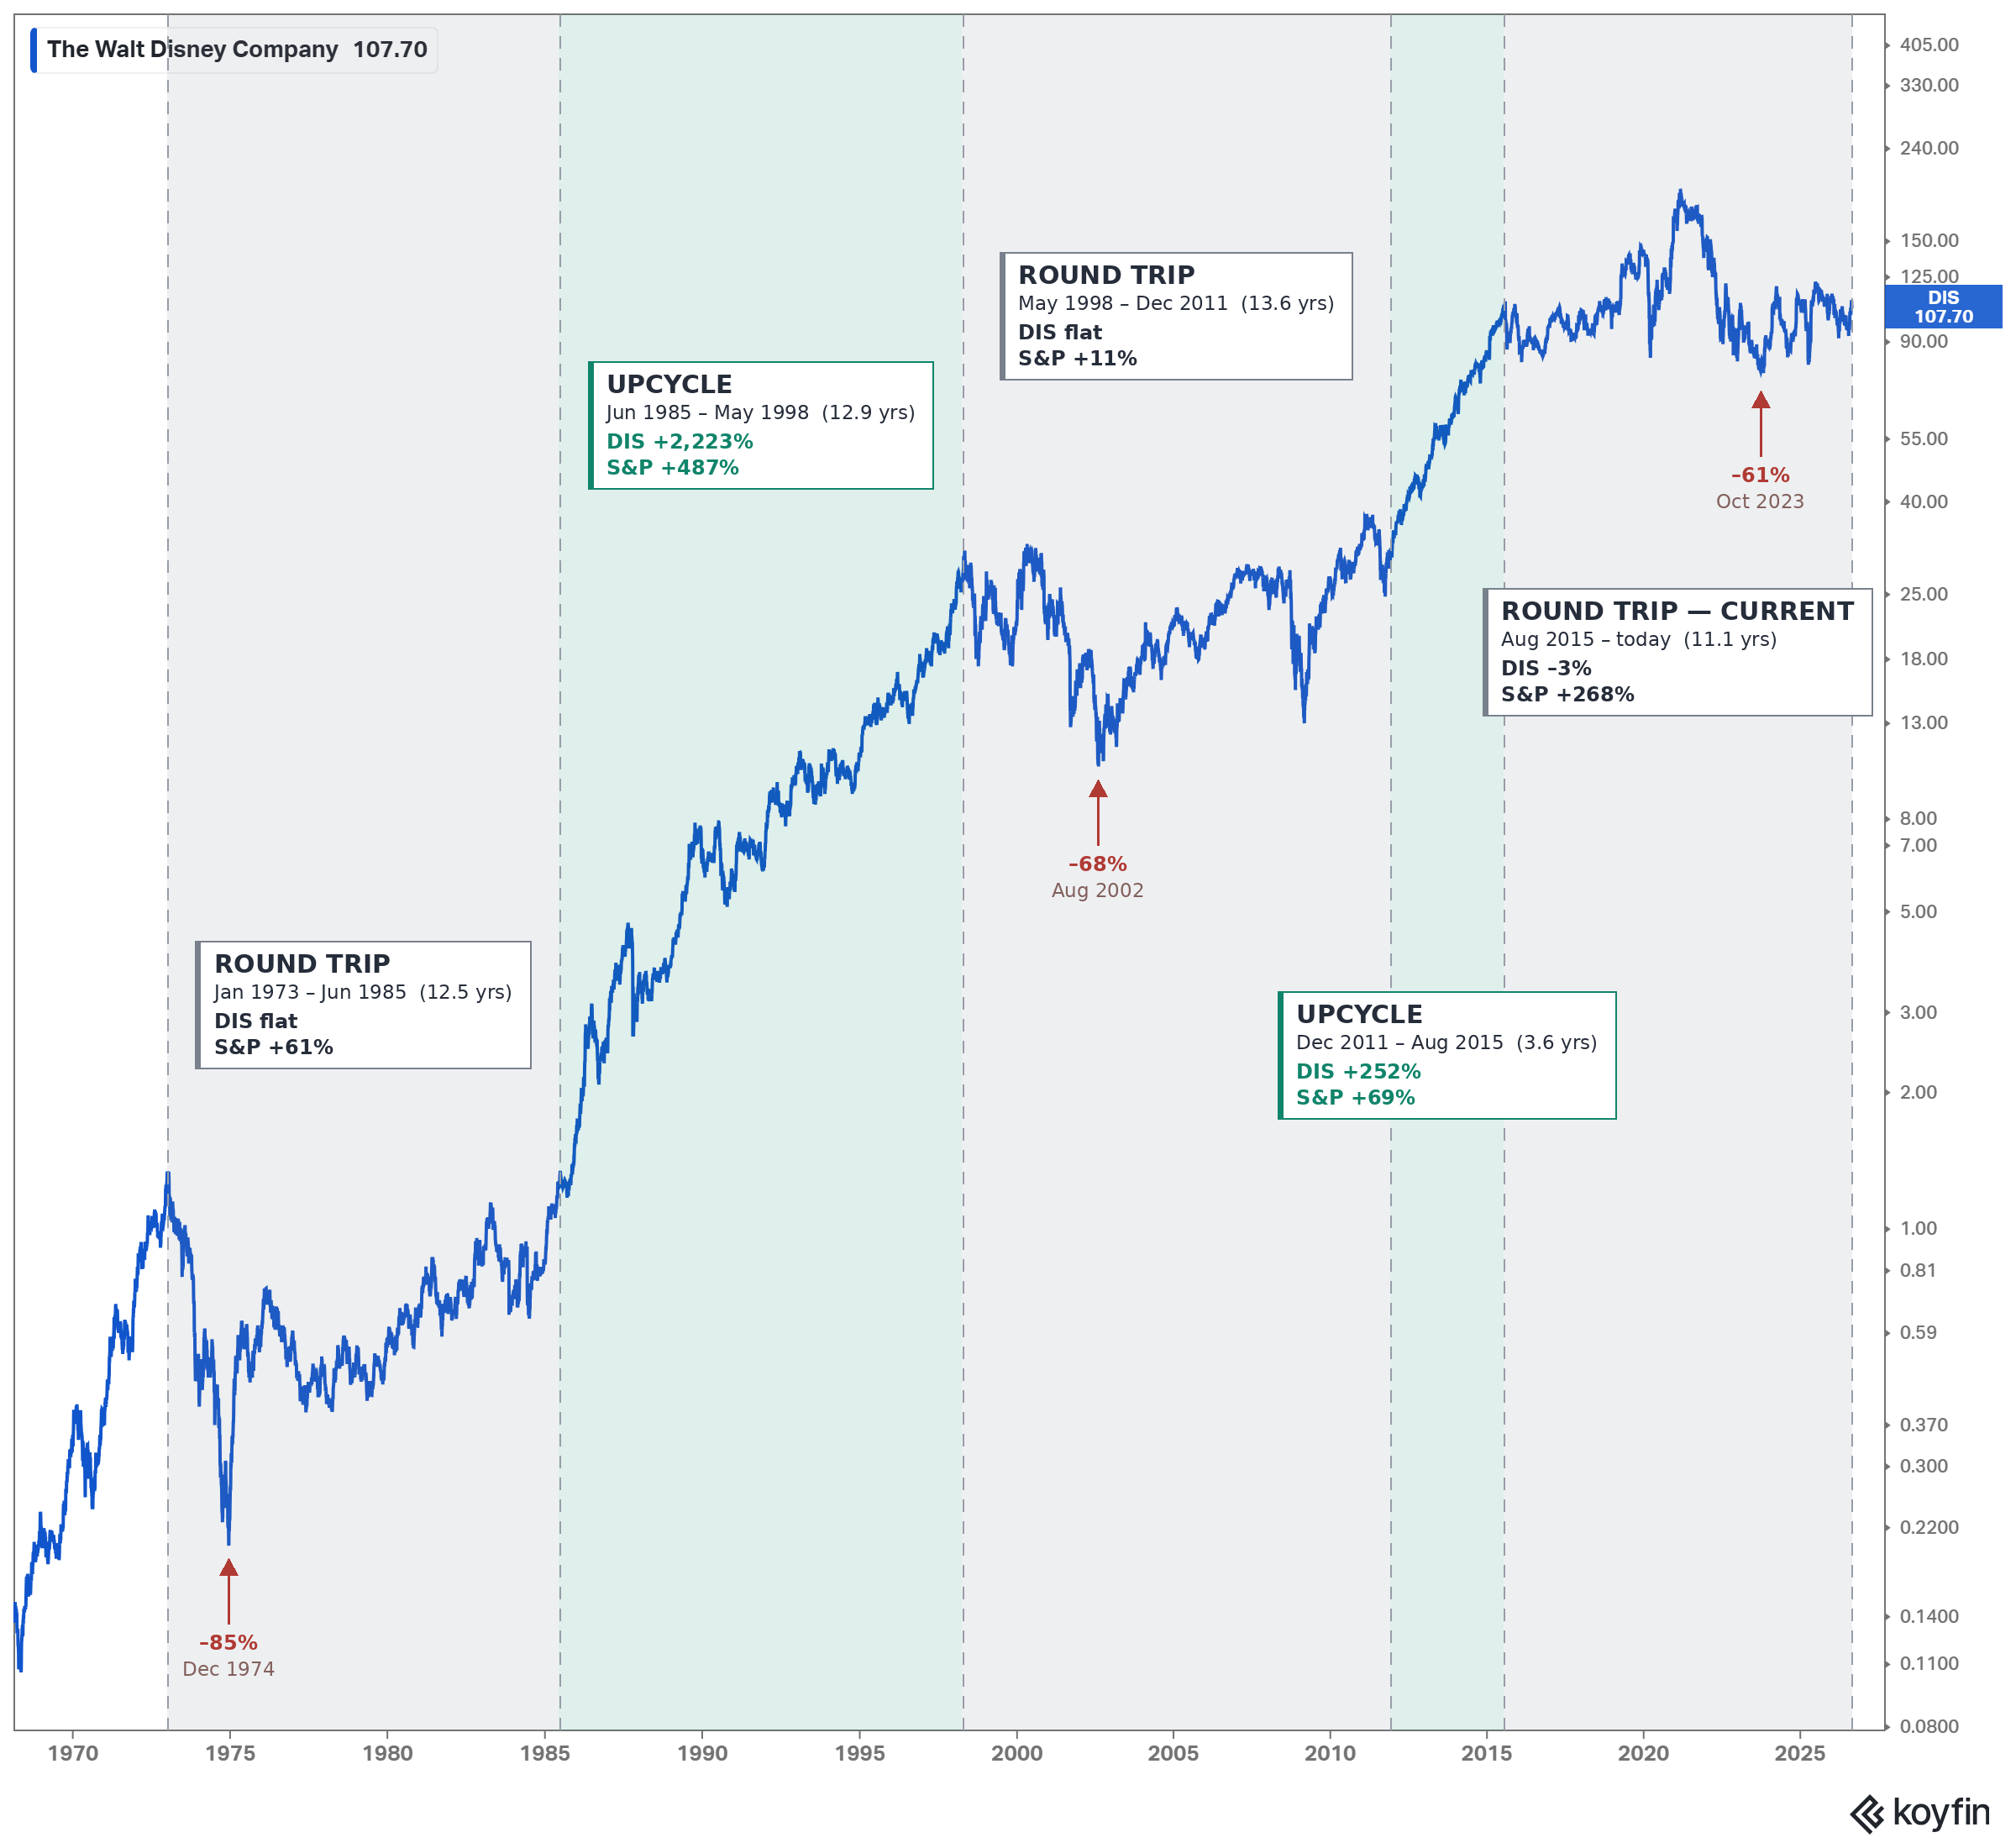
Disney stock is no stranger to long stretches of grinding sideways. Since 1973, there have been three, each featuring a peak-to-trough drawdown of more than 60% and collectively representing the only three 60%+ drawdowns in company history. The first ran from January 1973 to June 1985, followed by another from May 1998 to December 2011. The current stretch began in August 2015 and is now 11.1 years old, with Disney down 3% while the S&P 500 has returned 268%, making it the worst stretch of relative underperformance Disney has ever seen.
All three were driven by the same two conditions: a stalled creative engine and unresolved leadership. Both prior periods ended once those problems were fixed, setting the stage for massive runs of outperformance, with Disney returning 2,223% from 1985 to 1998 and 252% from 2011 to 2015.
With the creative engine finding its footing and the succession question resolved, Disney has addressed the same two headwinds that defined its prior sideways stretches. If history is any guide, we could be at the very beginning of another major upcycle at the Mouse House.
To be clear, we do not own Disney because of a chart. We own it because we originally underwrote the company paying for Experiences alone, a segment now generating $10B of operating income and worth what we believe is ~$80 per share on a standalone basis. That left everything else as a free flier, which today includes a Streaming business running at record margins, the leading sports media brand in the world, and a film studio producing $1B+ films at a pace no competitor can match.
For all of that, shares remain ~45% below their all-time high despite revenue, operating profit, and free cash flow all sitting at or near record levels. The stock trades at just ~14x forward earnings, roughly half its five-year average of 26x and only 0.7x the S&P 500 multiple.
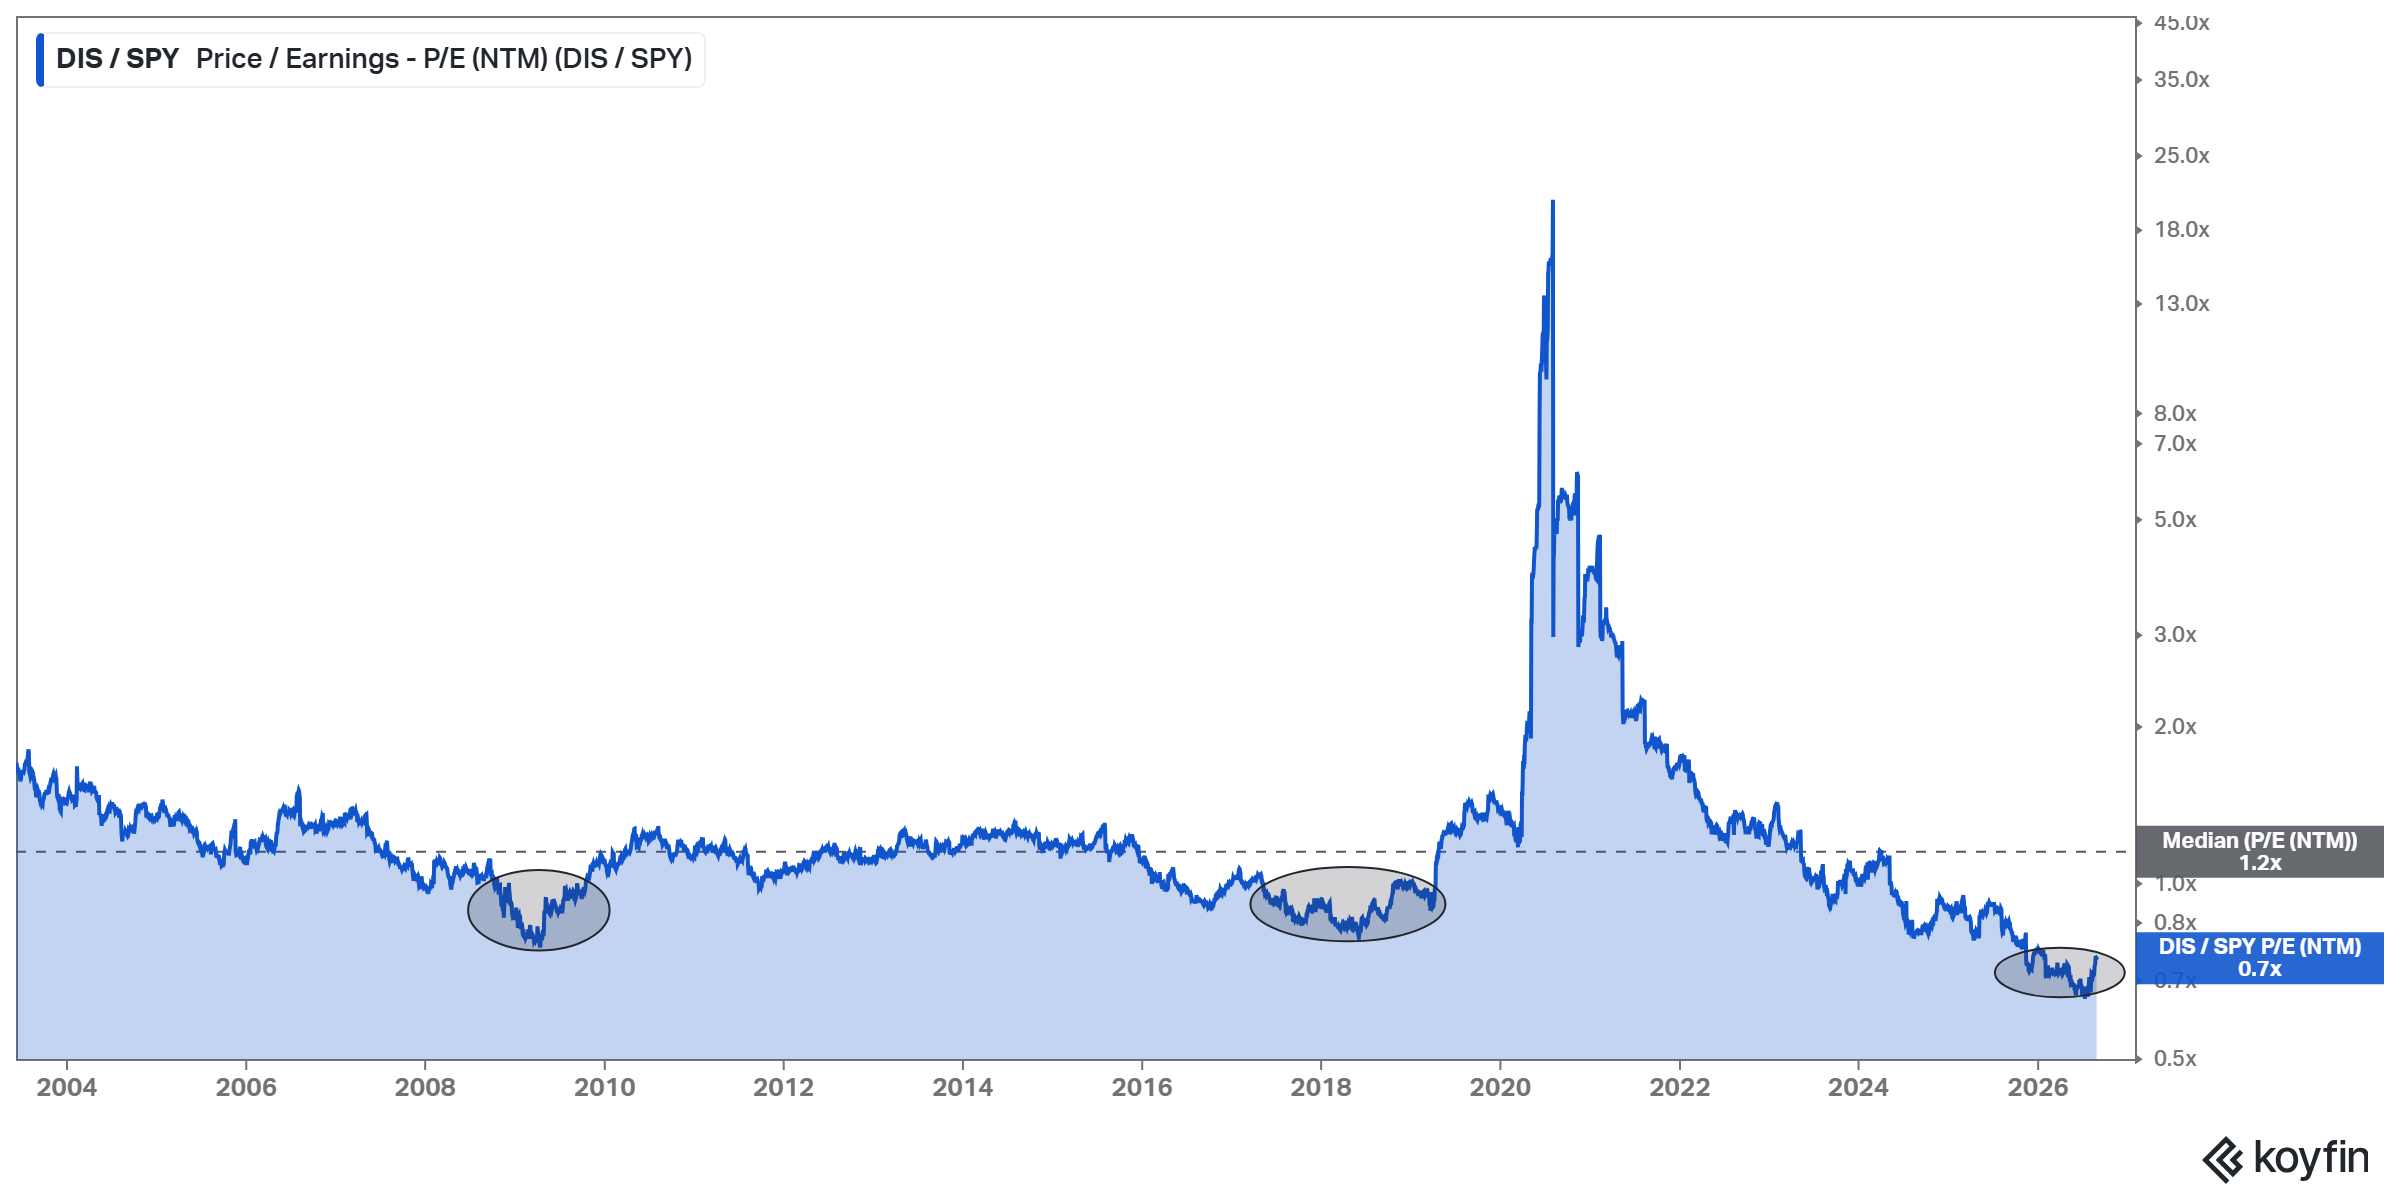
So what does it take for Disney to finally re-rate? We think it comes down to consistent execution. Deliver on management’s earnings growth outlook, and Disney is a double-digit earnings compounder trading at a fraction of the market multiple, a disconnect we don’t think will last for very long.

Q3 Earnings Breakdown
10 Key Points
1) Revenue came in at $25.25B (+7% Y/Y), slightly below consensus of $25.39B, with growth broad-based across all three segments. Total segment operating income of $5.56B (+21% Y/Y) modestly exceeded prior guidance, with margins expanding to 22.0% from 19.3%. Adjusted EPS of $2.06 (+28% Y/Y from $1.61) topped consensus of $1.86.
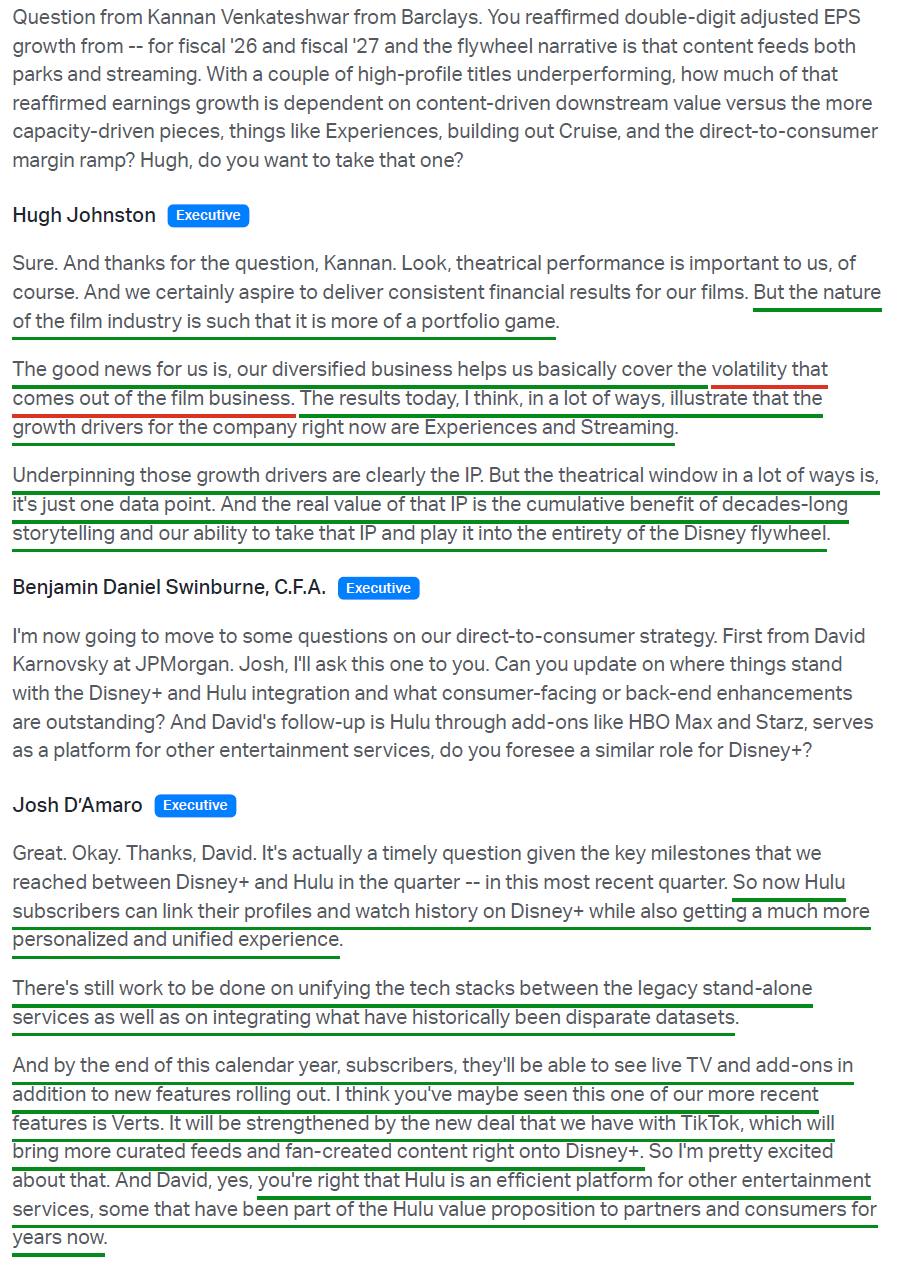
2) Streaming continues to take the baton from Linear Networks as Disney’s next growth engine, with Disney+ and Hulu SVOD revenue of $5.53B (+11% Y/Y), decelerating from +13% in Q2, while operating income more than doubled to $712M from $329M. Operating margin reached a record 12.9%, up ~630 bps Y/Y and ~230 bps sequentially from the prior record of 10.6% set last quarter, keeping Disney well ahead of schedule on its full-year double-digit target versus ~5.4% in FY2025. Subscription fees grew 15% (9 points volume, 3 points rate, 1 point FX), while advertising rose just 3% as marketplace supply pressured rates. Worldwide churn declined, helped by the app unification milestone that allows Hulu subscribers to link profiles and manage subscriptions on Disney+. Management plans to ~triple local international originals over three years and is exploring a free ad-supported tier, while a new global TikTok agreement will feed curated fan content into Disney+ Verts.
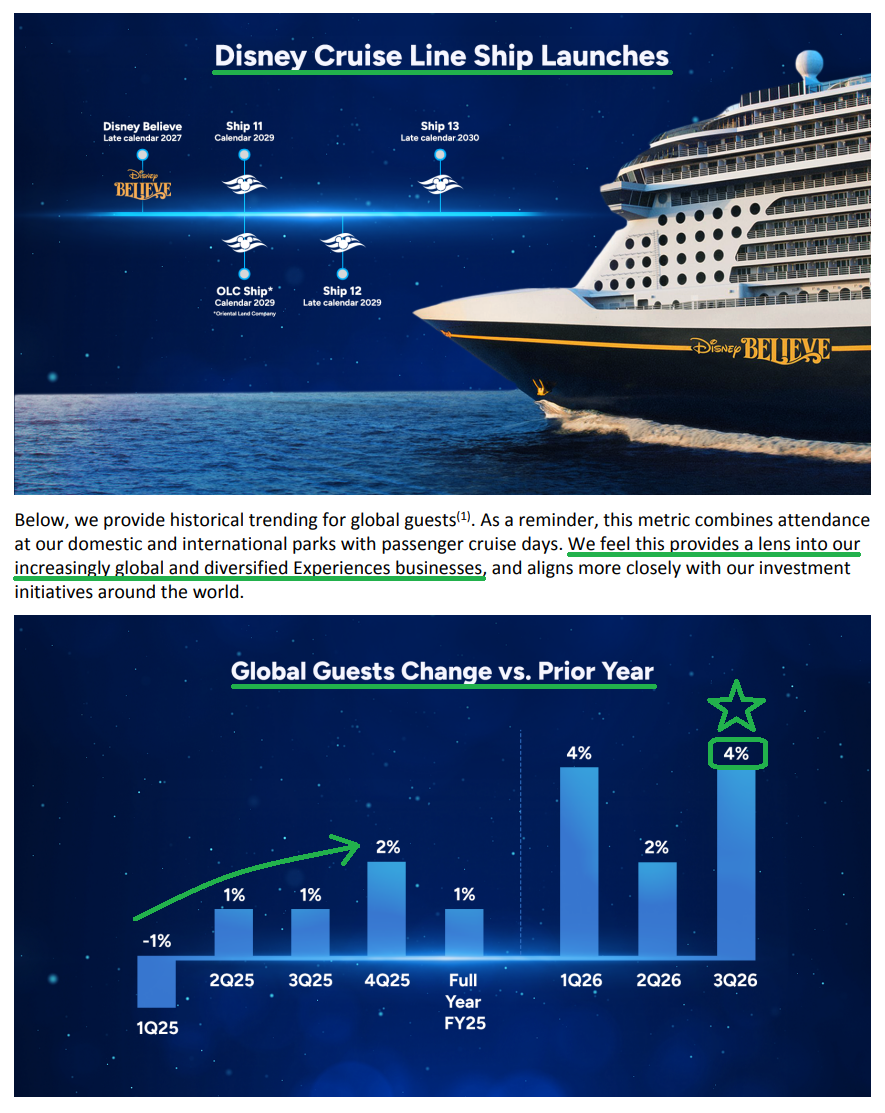
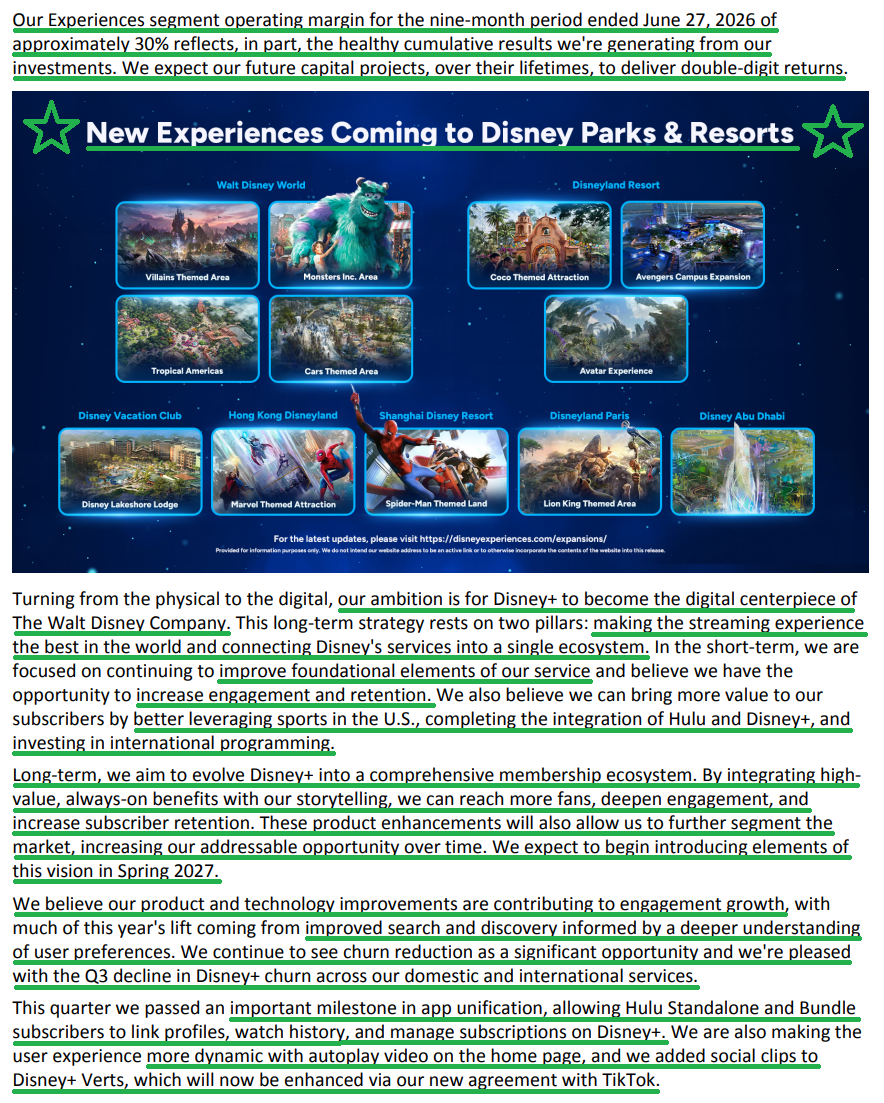
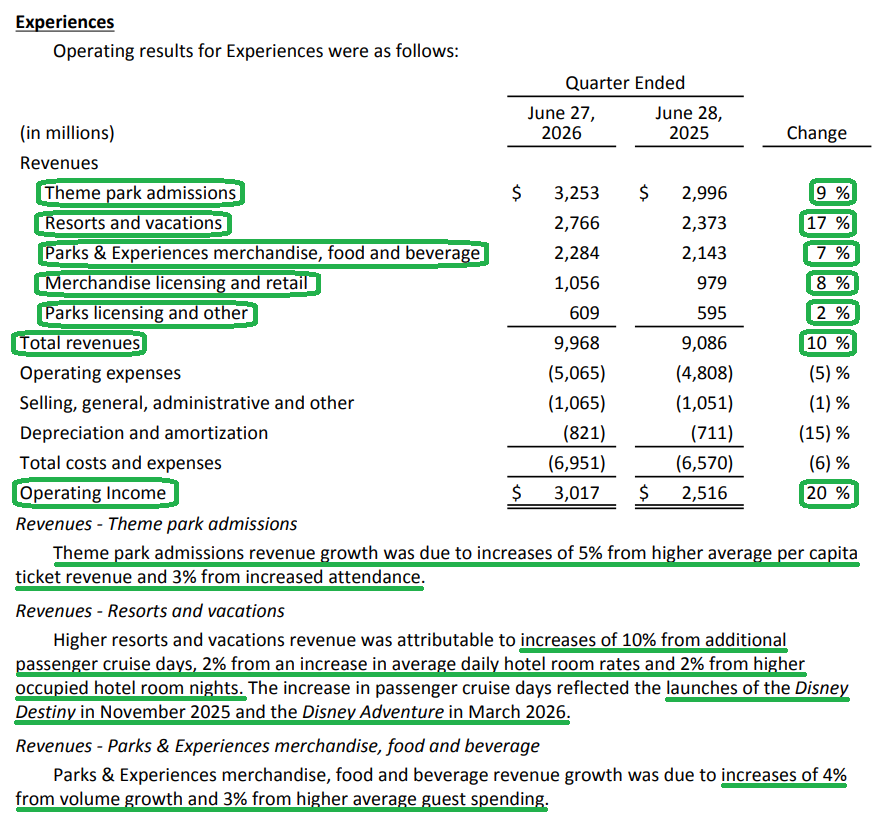
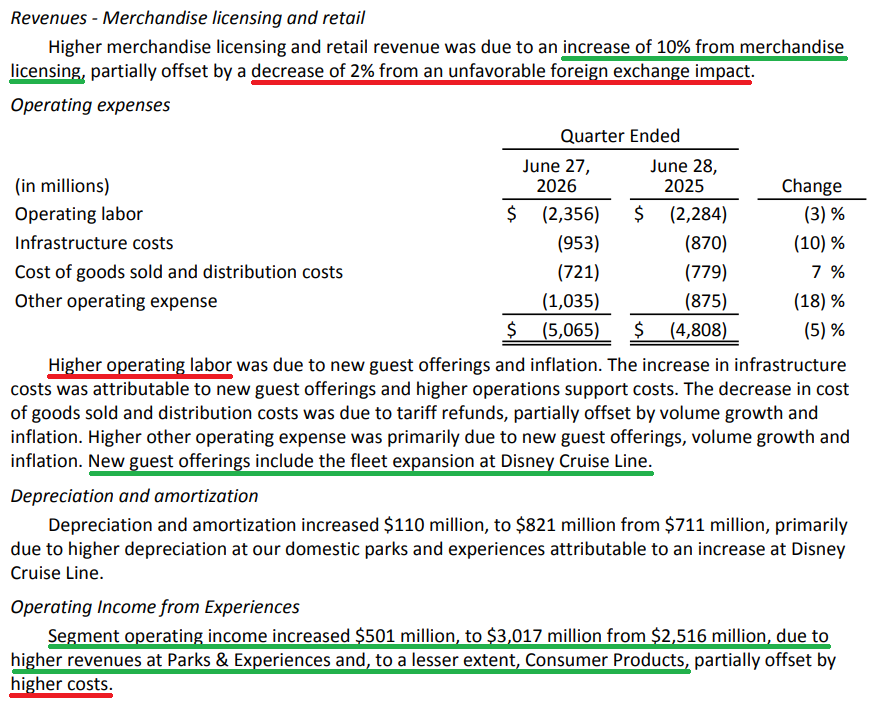
3) Experiences delivered its sixth straight record revenue quarter at $9.97B (+10% Y/Y), with record operating income of $3.02B (+20% Y/Y) and margins expanding to 30.3% from 27.7%. ~4 points of that operating income growth came from a ~$100M tariff refund, which had no impact on segment revenue, putting underlying growth closer to 16%. Global guests, which aggregate domestic and international park attendance along with passenger cruise days, grew 4% Y/Y. Domestic Parks & Experiences generated $7.12B (+11%) in revenue and $2.09B (+27%) in operating income, with attendance up 3% versus consensus expectations closer to 0.5%, alongside a 4% increase in per-capita spending. International parks were the lone soft spot, with operating income down 13% to $369M on consumer weakness in Asia that management had anticipated and expects to persist into Q4. Encouragingly, the international visitation headwinds pressuring domestic parks continued to moderate relative to Q2. Consumer Products revenue rose 7% to $1.07B, with operating income up 26% to $560M, marking the strongest quarter of Y/Y Consumer Products revenue growth in 20 quarters.
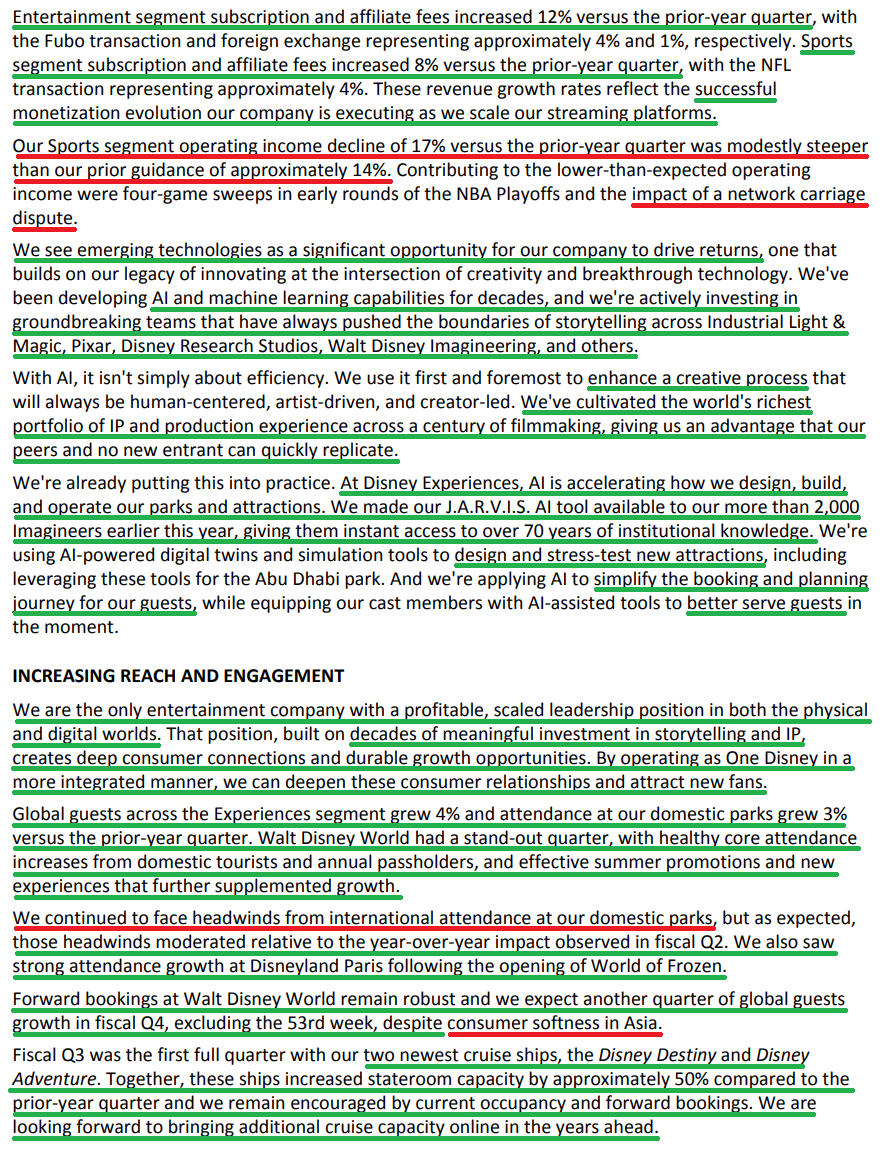
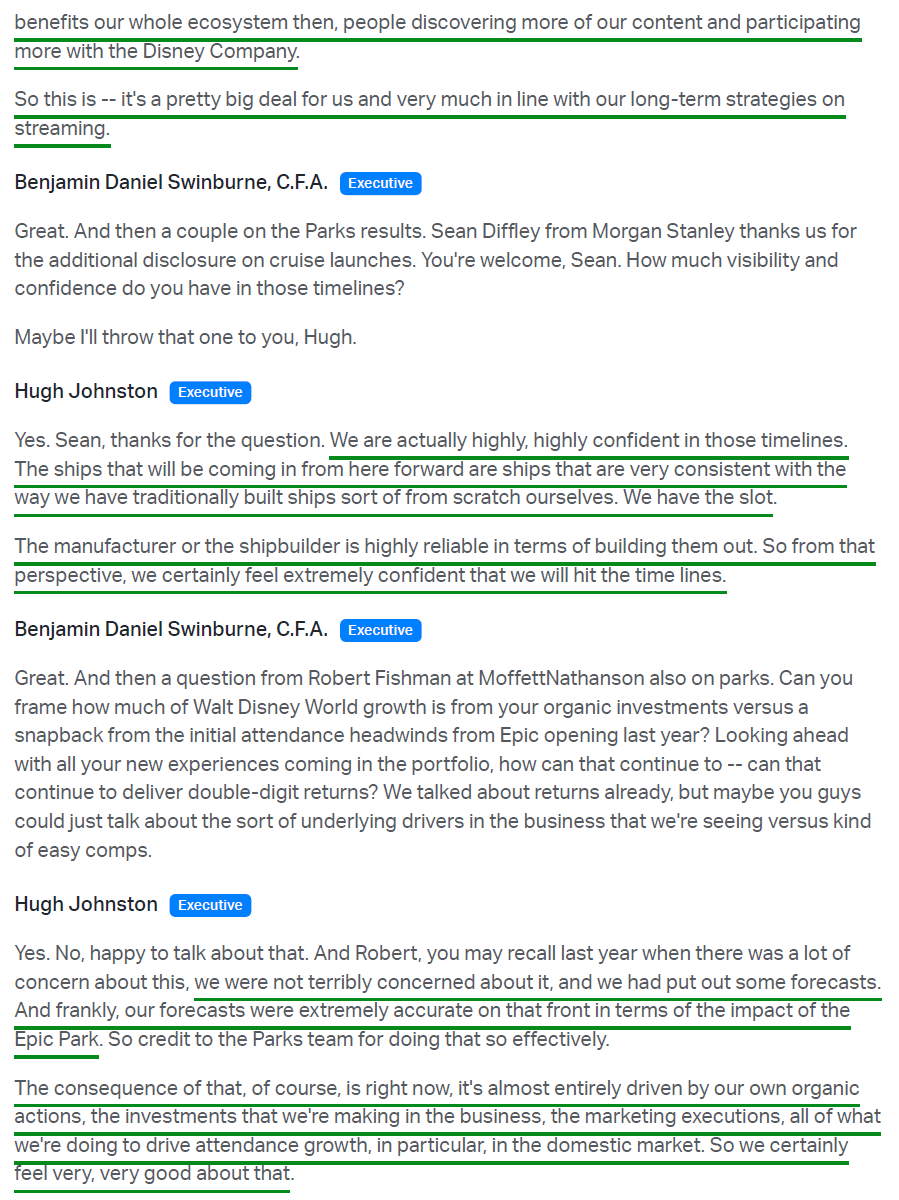
4) Disney’s cruise expansion continues to pay off, with Q3 marking the first full quarter for both the Disney Destiny and Disney Adventure, together increasing capacity ~50% Y/Y. That flowed directly into Resorts and Vacations revenue of $2.77B (+17%), including 10 points from additional passenger cruise days. Management remains encouraged by occupancy and forward bookings and is highly confident in its timeline to grow the fleet from eight ships to thirteen by 2031, with shipyard slots already secured.
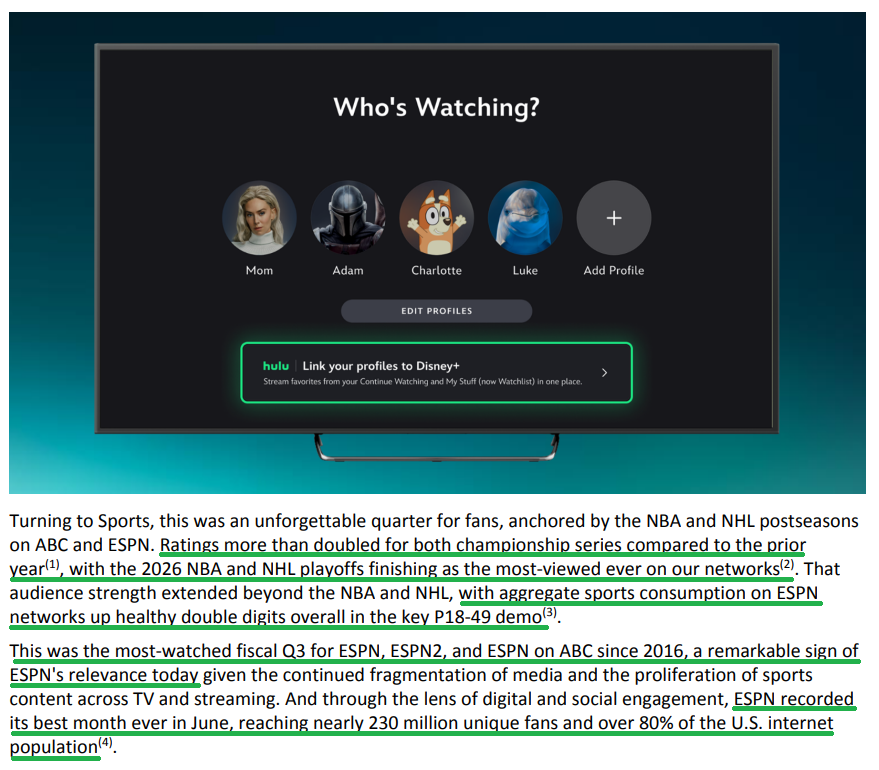
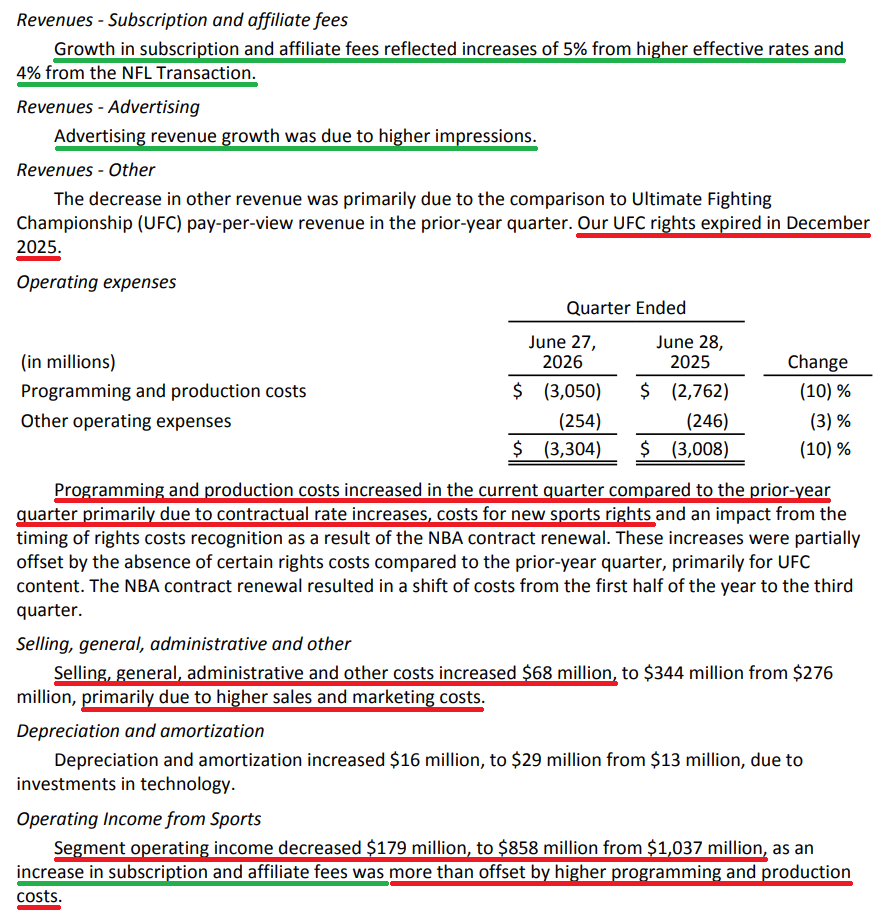
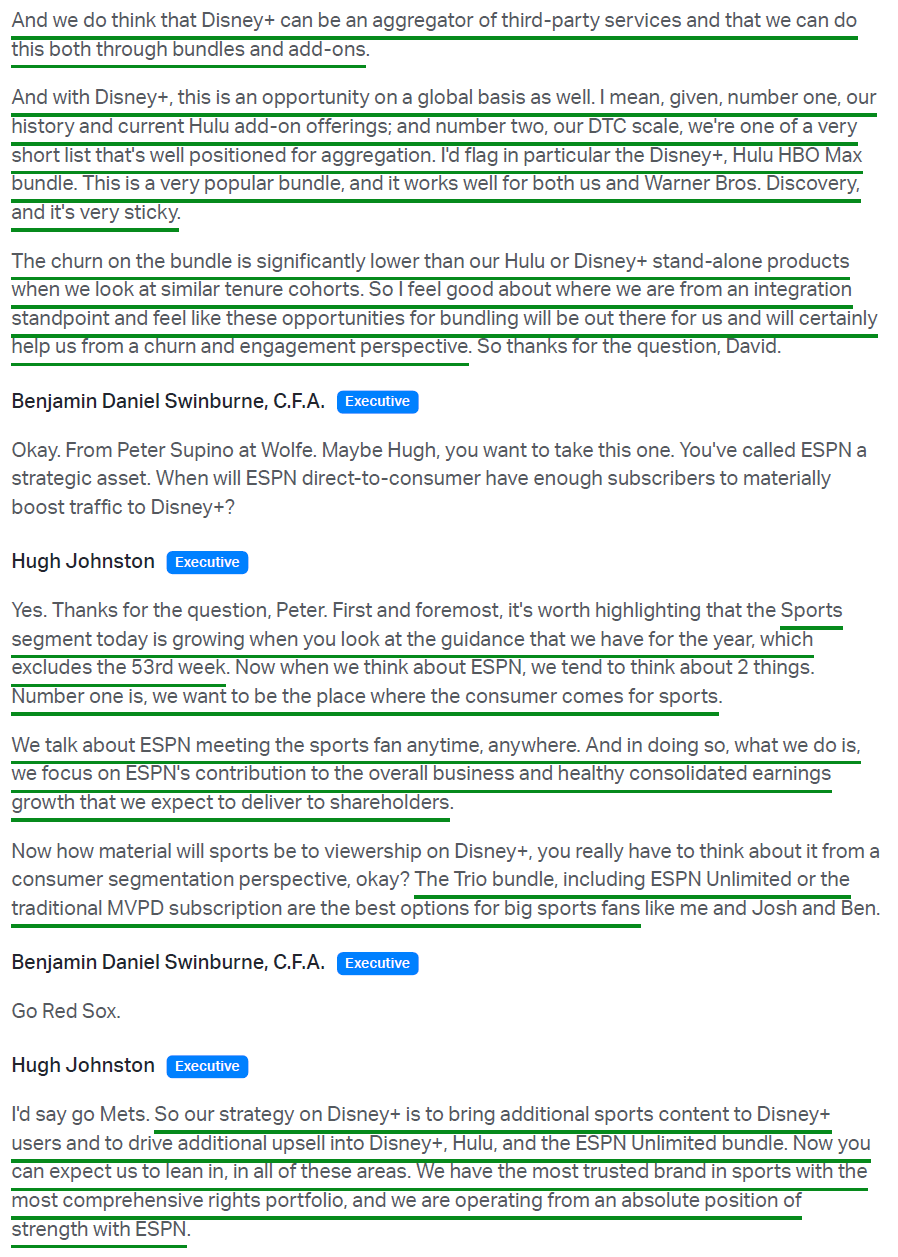
5) Sports revenue increased 4% Y/Y to $4.50B, driven by 8% growth in subscription and affiliate fees (5 points from higher rates, 4 points from the NFL transaction) and 5% growth in advertising on higher impressions, partially offset by a 41% decline in other revenue as the segment lapped UFC pay-per-view. Operating income fell 17% to $858M, a steeper decline than the ~14% management had guided, though full-year Sports operating income remains on track to grow mid-single digits excluding the 53rd week. Engagement during the quarter was a standout, with NBA and NHL Finals ratings more than doubling Y/Y to become the most-viewed ever on Disney’s networks. This was also the most-watched fiscal Q3 for ESPN since 2016, with Super Bowl ad inventory for February 2027 already sold out.
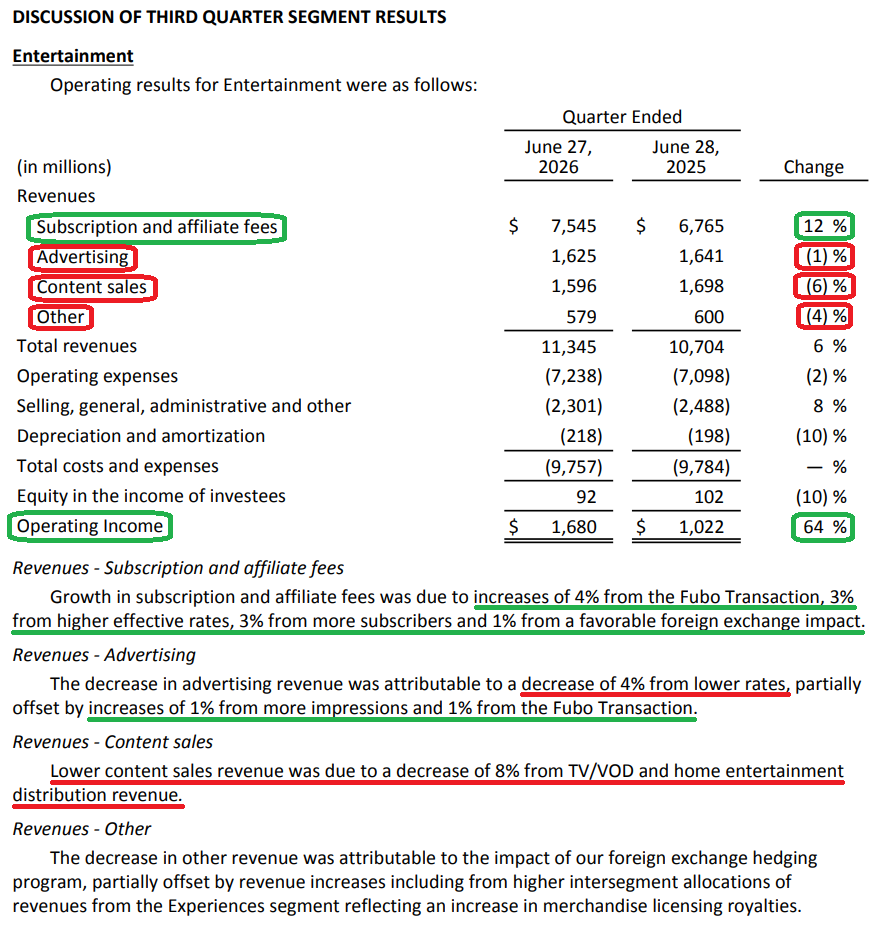
6) Results across Disney’s film slate were mixed this quarter. Toy Story 5 crossed $1.0B globally (now at $1.13B) since its June 19 release, lifting the franchise above $4B in lifetime box office, while generating 2B+ hours streamed on Disney+ and driving the strongest Consumer Products growth in 20 quarters. The Devil Wears Prada 2 has also generated ~$692.7M worldwide, with particular strength internationally. On the other hand, Star Wars: The Mandalorian and Grogu (~$345.8M) and the live-action Moana (~$308.3M) both underperformed box office expectations despite strong audience scores, with Moana’s shortfall set to weigh on Q4 Entertainment results, though management noted that each still contributed through merchandise, streaming, and parks.
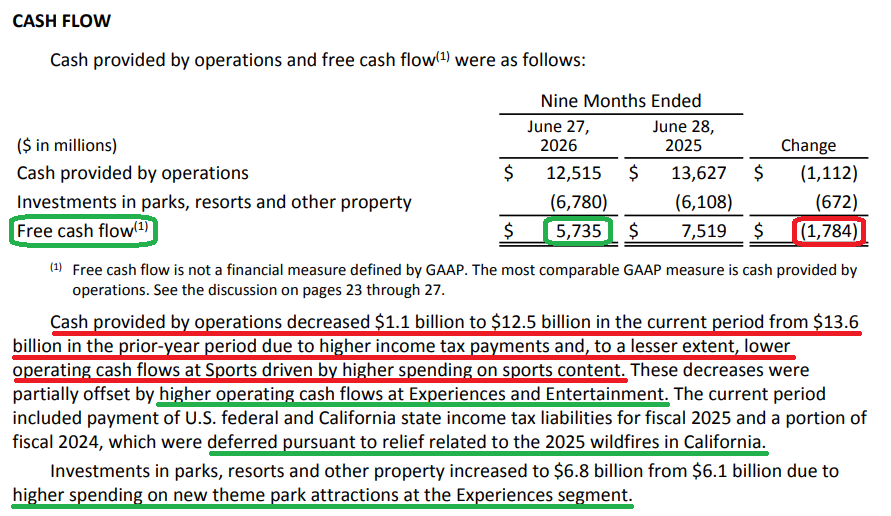
7) Operating cash flow came in at $4.87B (+33% Y/Y), with free cash flow of $3.07B (+63% Y/Y), though below the ~$3.61B consensus. Nine-month operating cash flow of $12.52B and free cash flow of $5.74B compare to $13.63B and $7.52B in the prior-year period, with the decline driven primarily by higher tax payments as previously deferred California wildfire relief liabilities caught up, alongside higher sports content spending. For FY26, management reiterated at least $19B in operating cash flow and continues to track toward ~$10B in free cash flow.
8) Capex totaled $1.79B for the quarter, bringing YTD spending to $6.78B (+11% Y/Y) and keeping the company on track for ~$9B in FY26. The bulk remains earmarked for cruise fleet expansion and new attractions, including Villains Land in Orlando and the Avengers Campus expansion in Anaheim, with projects underway at every site globally. Management reiterated that Experiences ROIC has increased meaningfully over time and expressed confidence that future projects should deliver double-digit returns over their lifetimes.
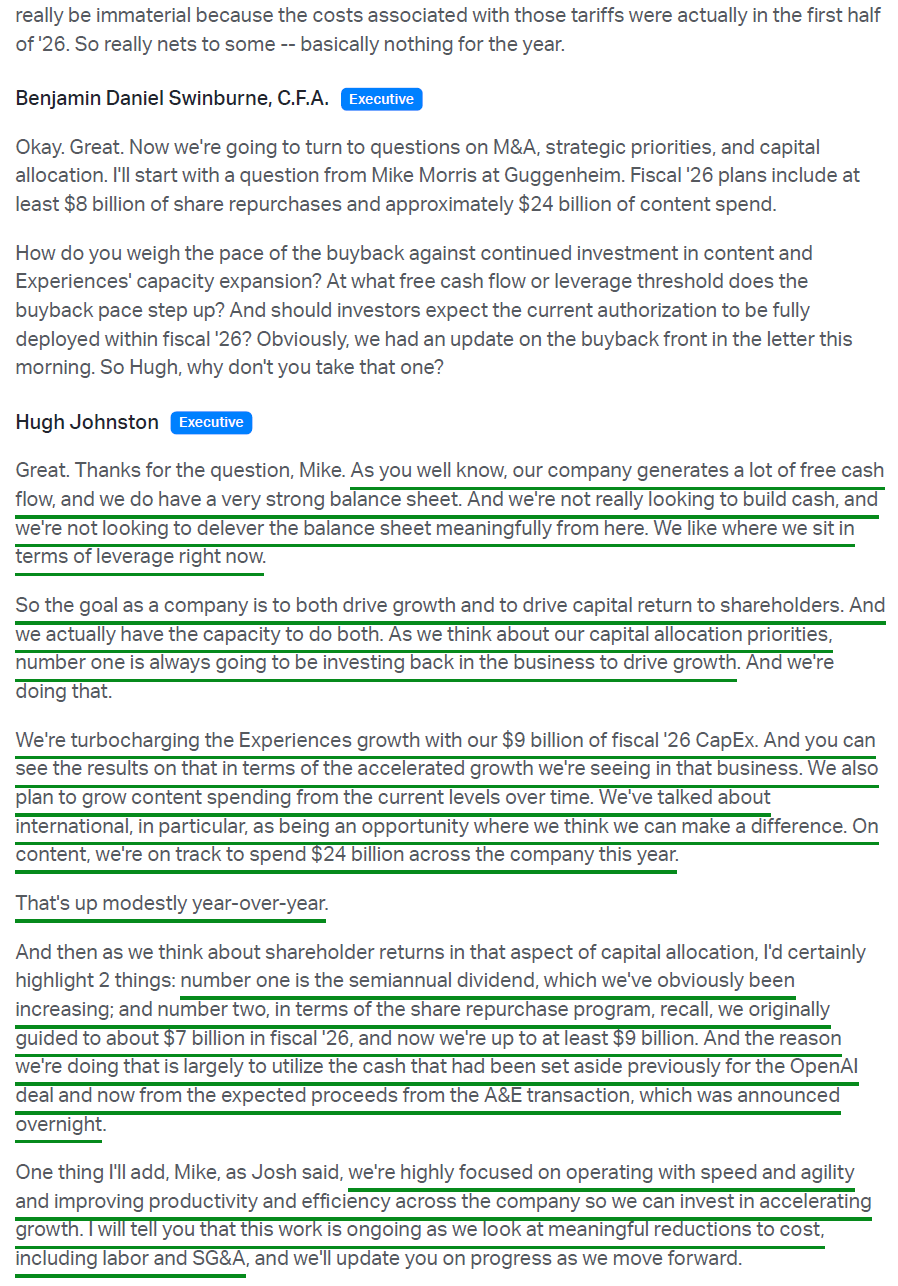
9) Management raised its full-year share repurchase target to at least $9B, up from the original ~$7B guide, funded in part by cash previously set aside for the OpenAI deal and ~$1.2B in expected proceeds from the sale of Disney’s 50% stake in A+E Global Media to co-owner Hearst. Disney has repurchased $7.24B YTD alongside $1.34B in dividends, with management stating that they believe shares are undervalued and are not looking to build cash or delever further.
10) Management reiterated its full-year outlook, continuing to expect ~12% adjusted EPS growth for fiscal 2026 excluding the 53rd week, or ~16% including it, while maintaining double-digit adjusted EPS growth expectations for fiscal 2027. Q4 total segment operating income is guided to ~$4.9B, including ~$600M from the 53rd week. Experiences is now expected at the high end of prior high-single-digit operating income growth, Sports at mid-single digits, and Entertainment at double digits, though Q4 Entertainment will absorb Moana’s box office shortfall and a softer advertising environment in domestic SVOD.
Earnings Call Highlights
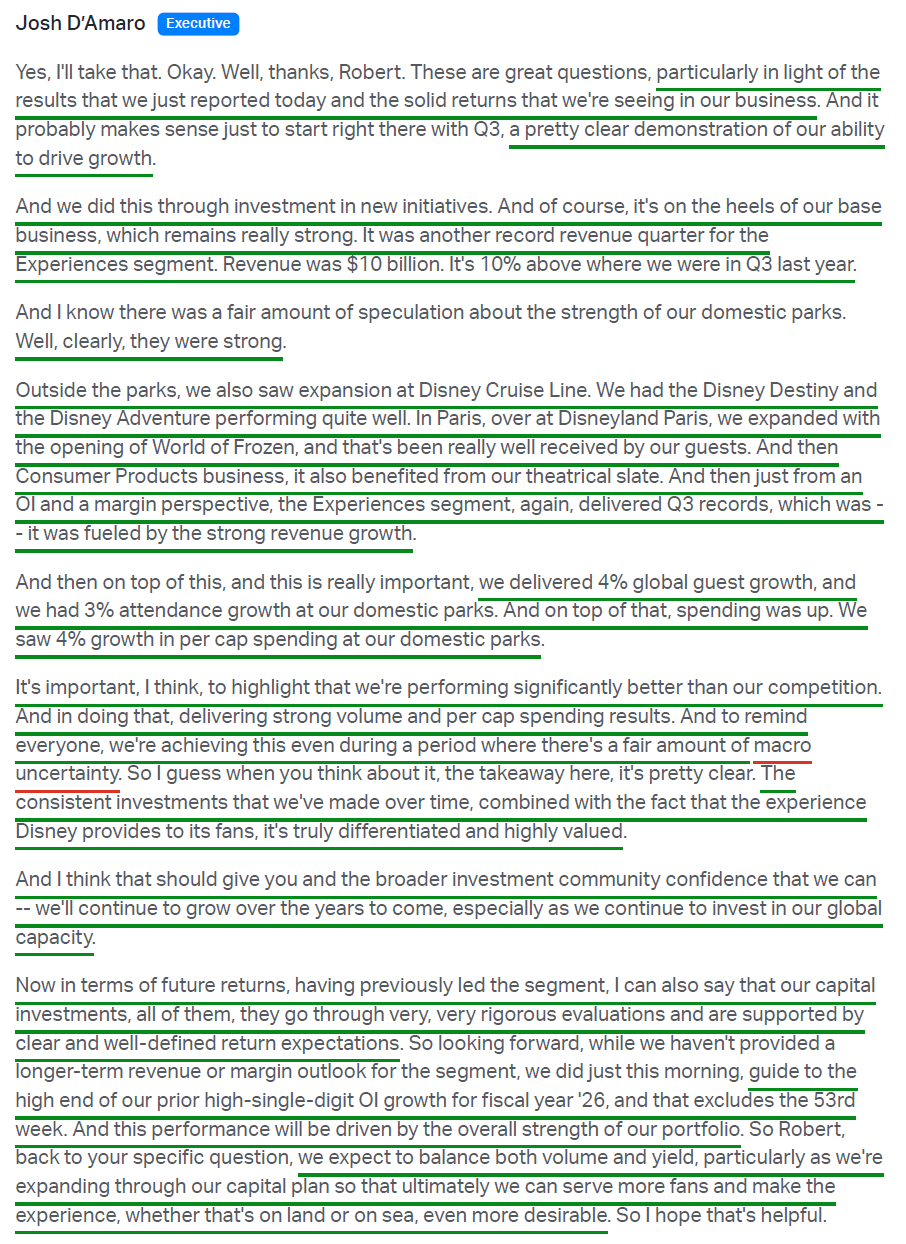
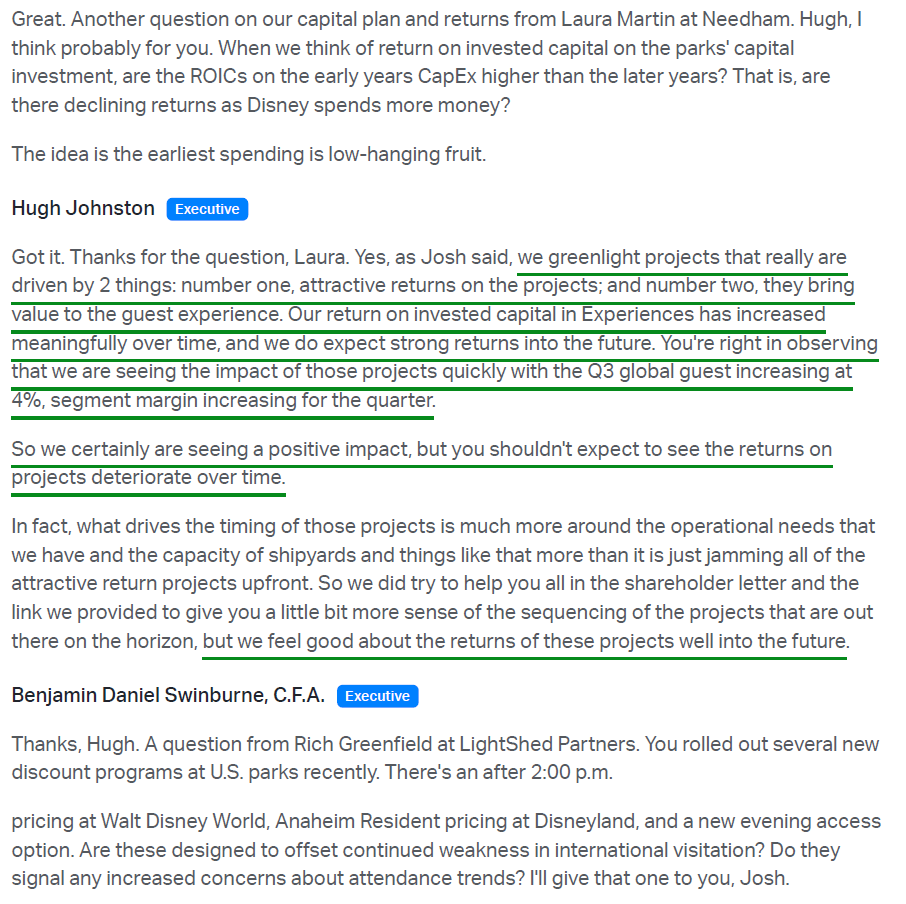
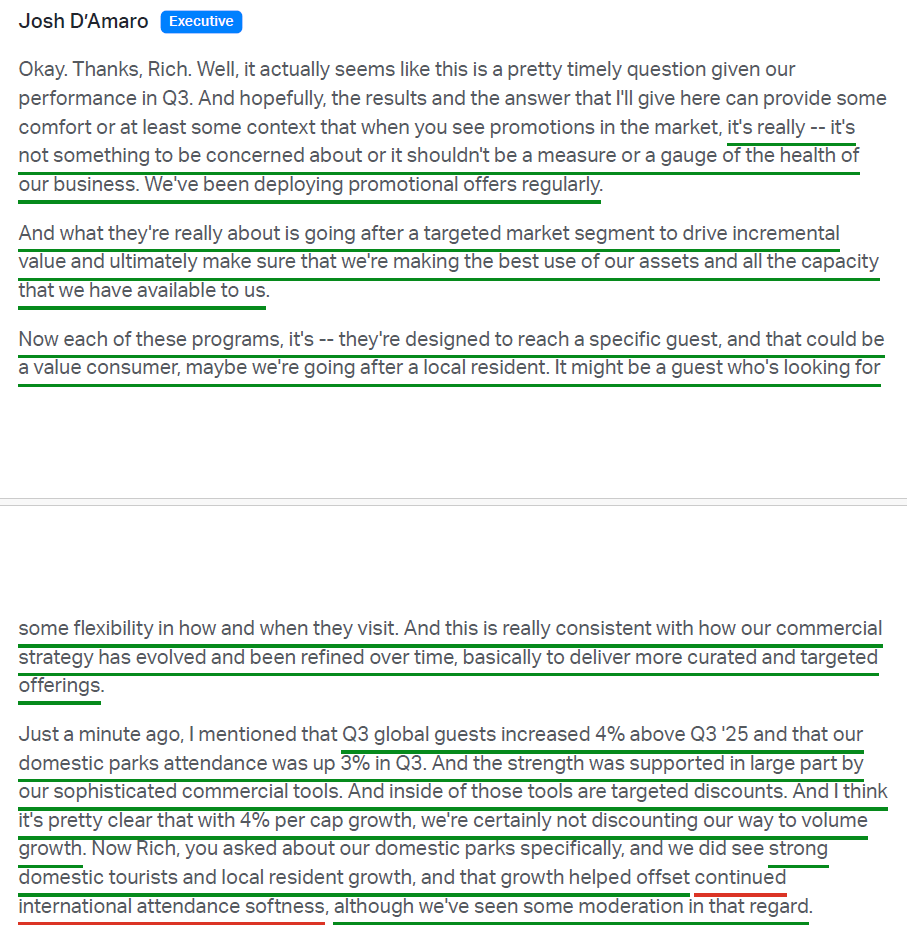
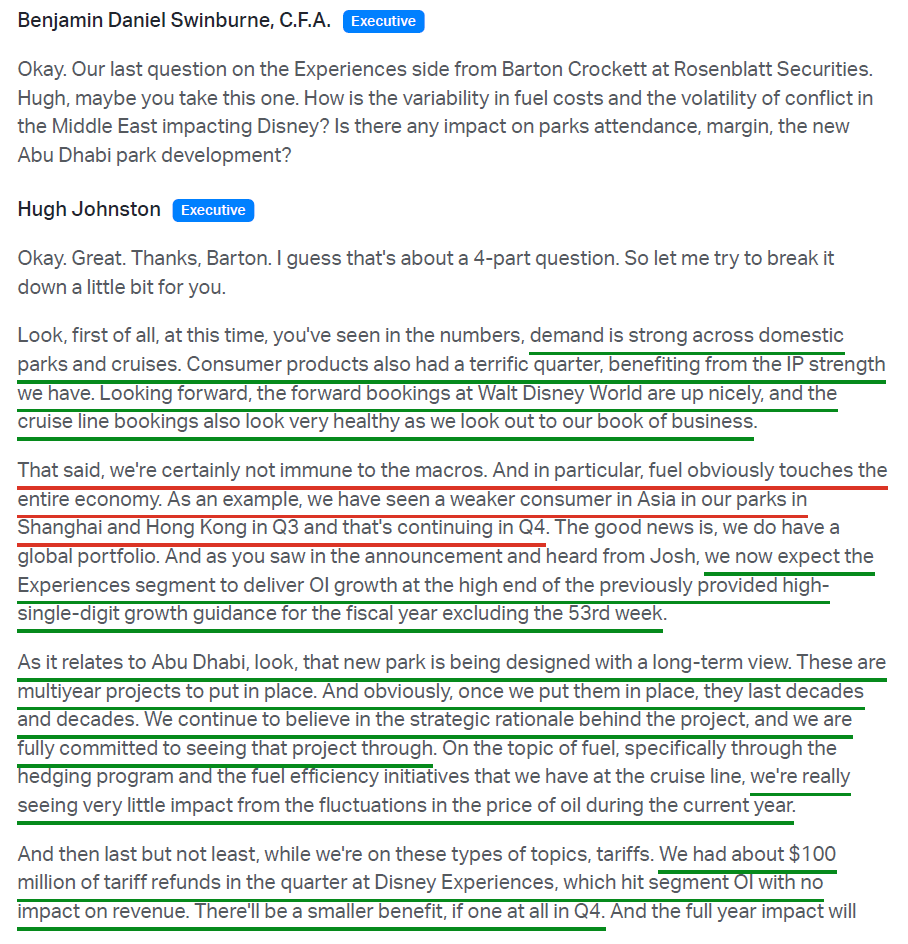
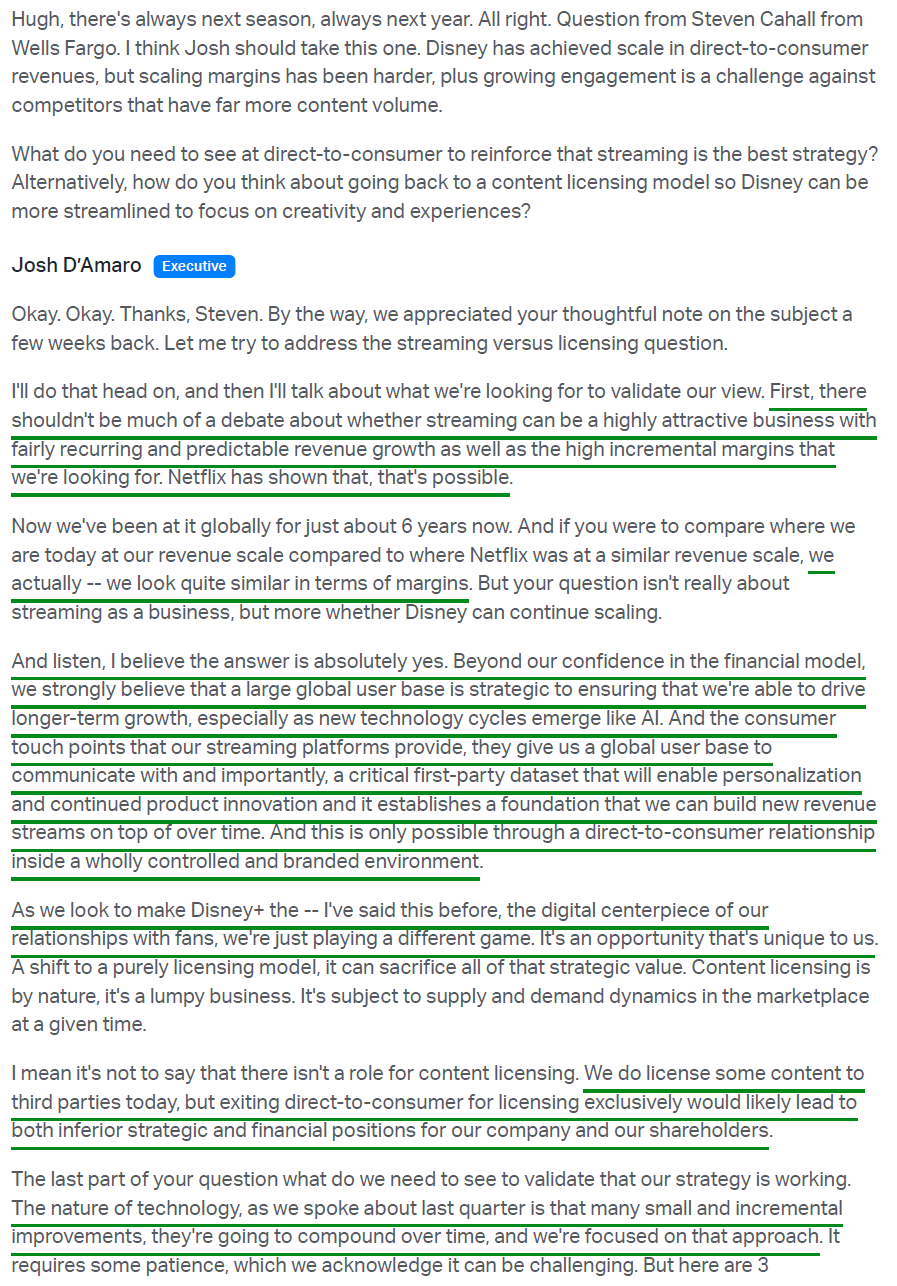
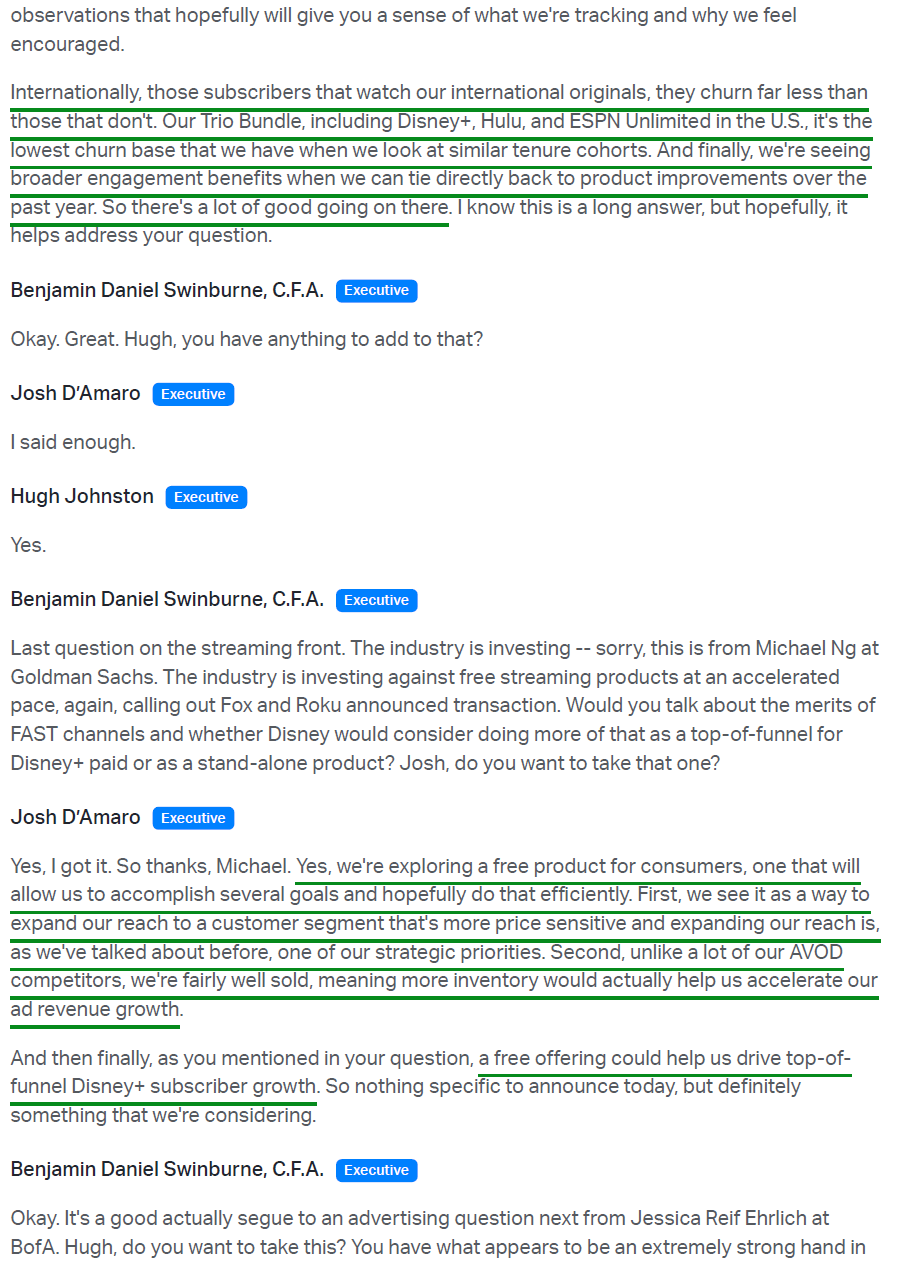
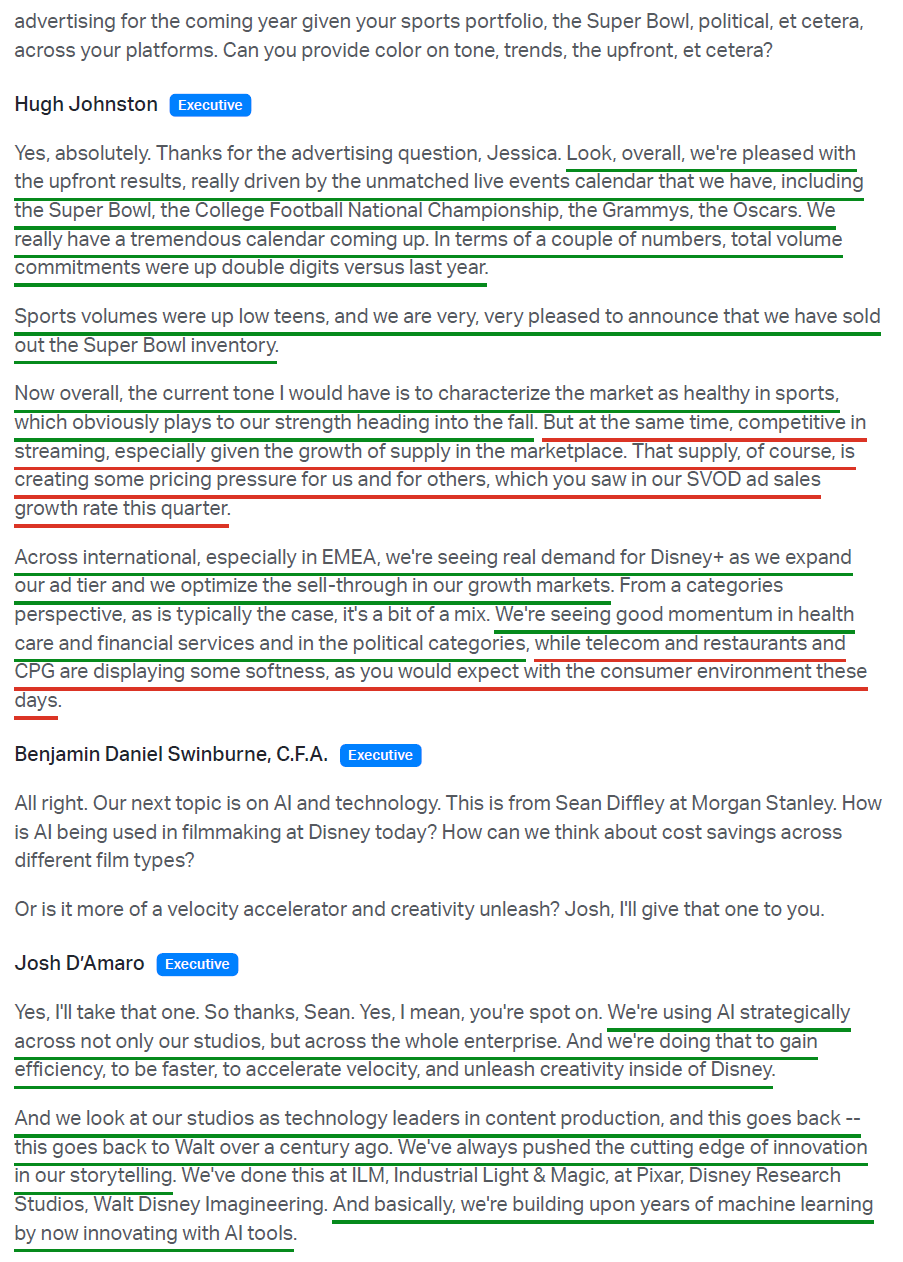
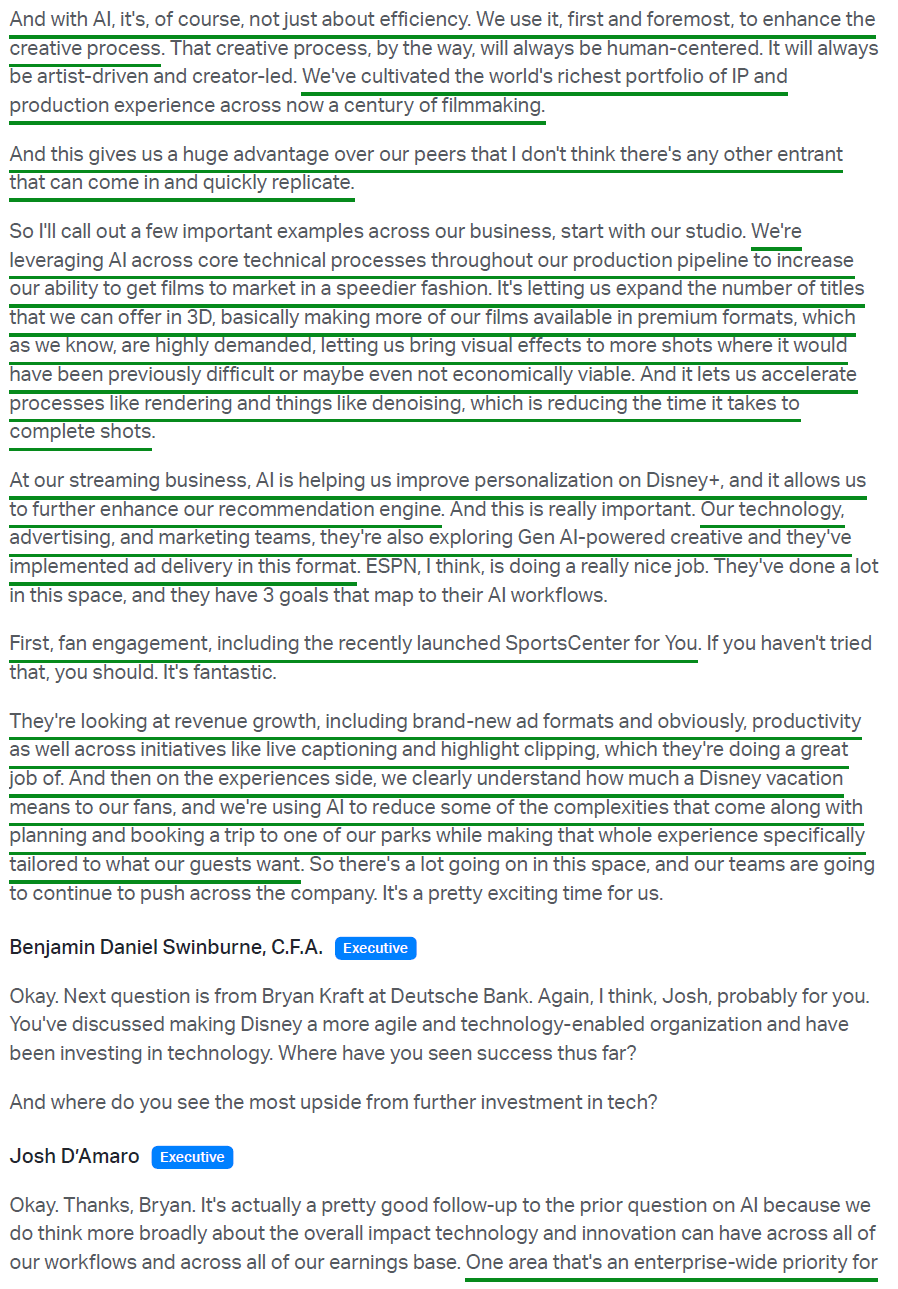
Morningstar Analyst Note
Etsy Update
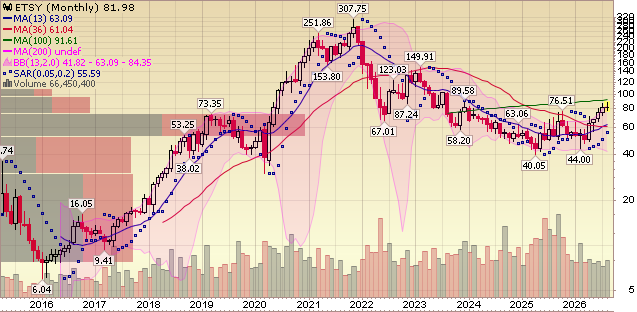
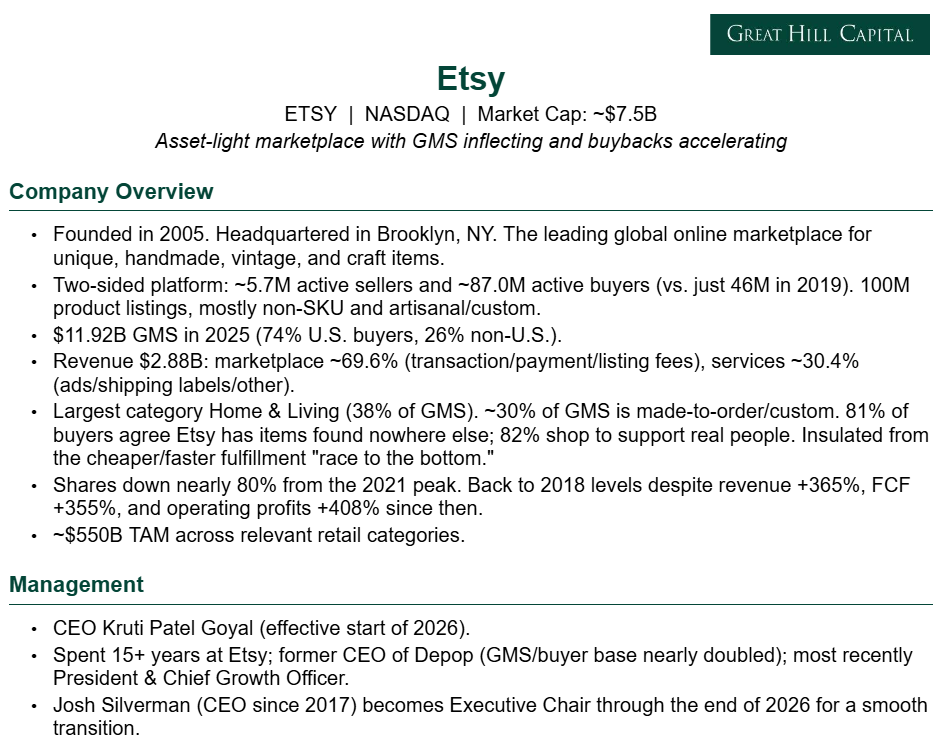
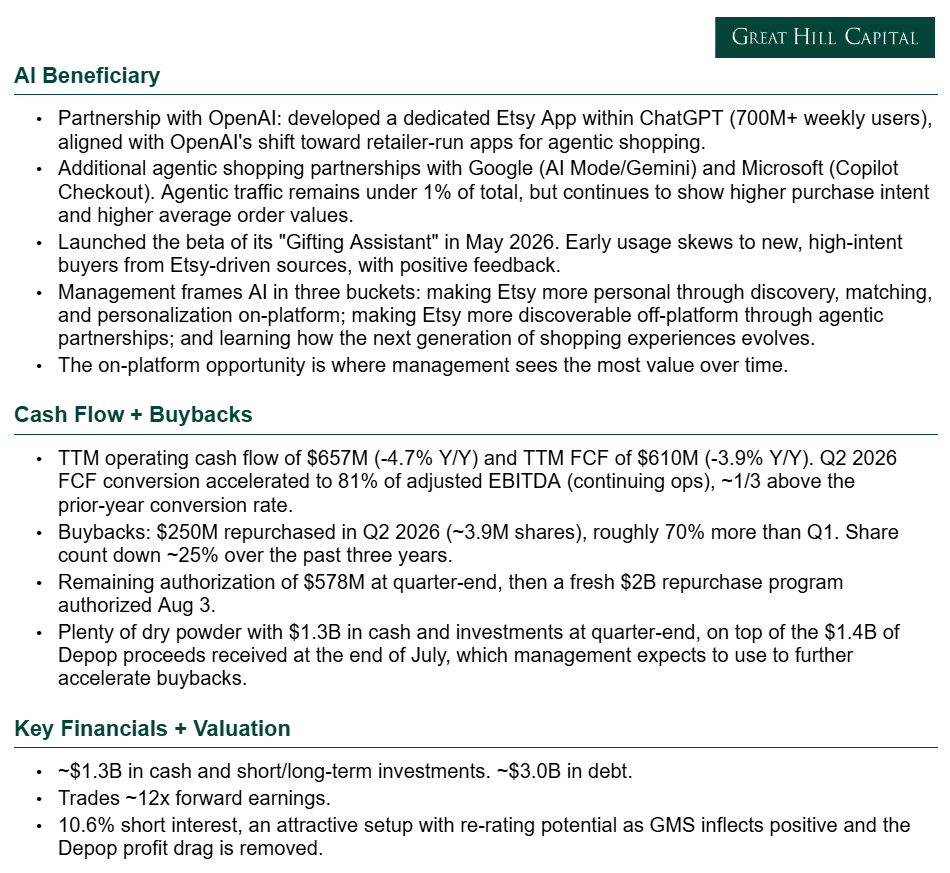
For newer readers, here’s a brief overview of the key drivers behind our Etsy (ETSY) thesis, an asset-light online marketplace inflecting back to growth after digesting the pandemic pull-forward, while aggressively buying back stock along the way:
Q2 Earnings Breakdown
10 Key Points
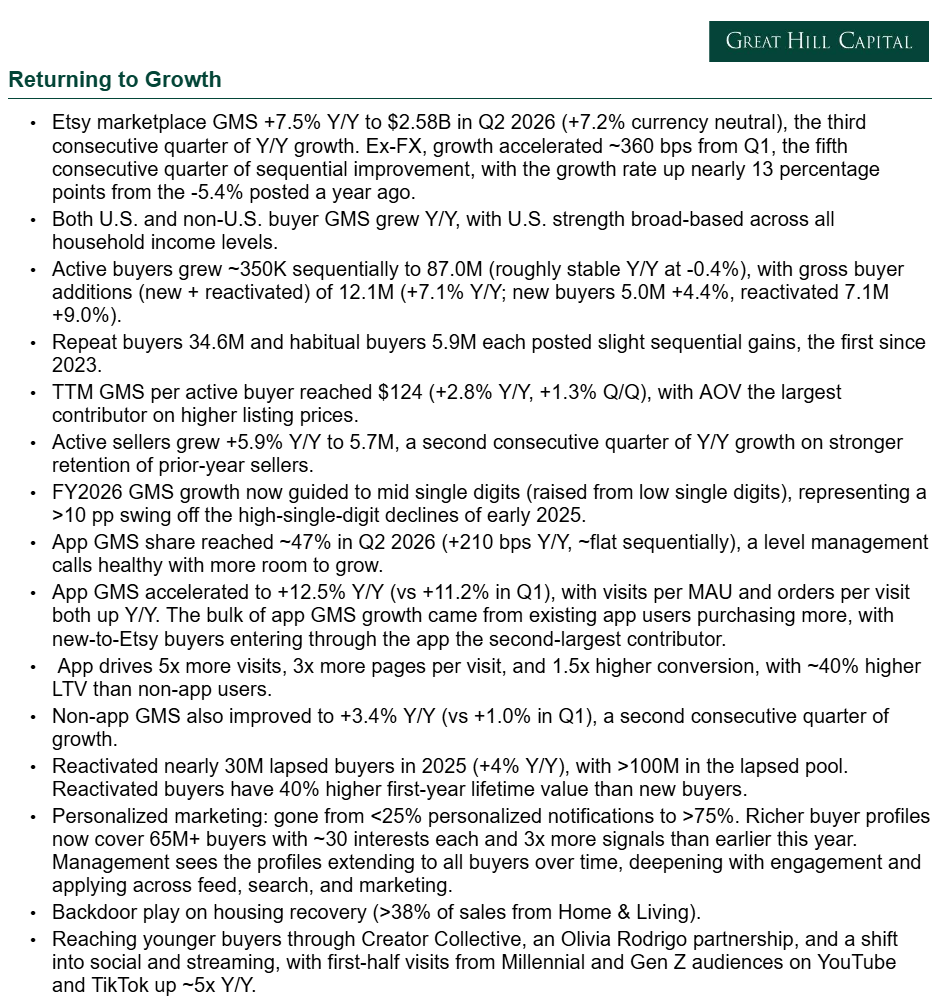
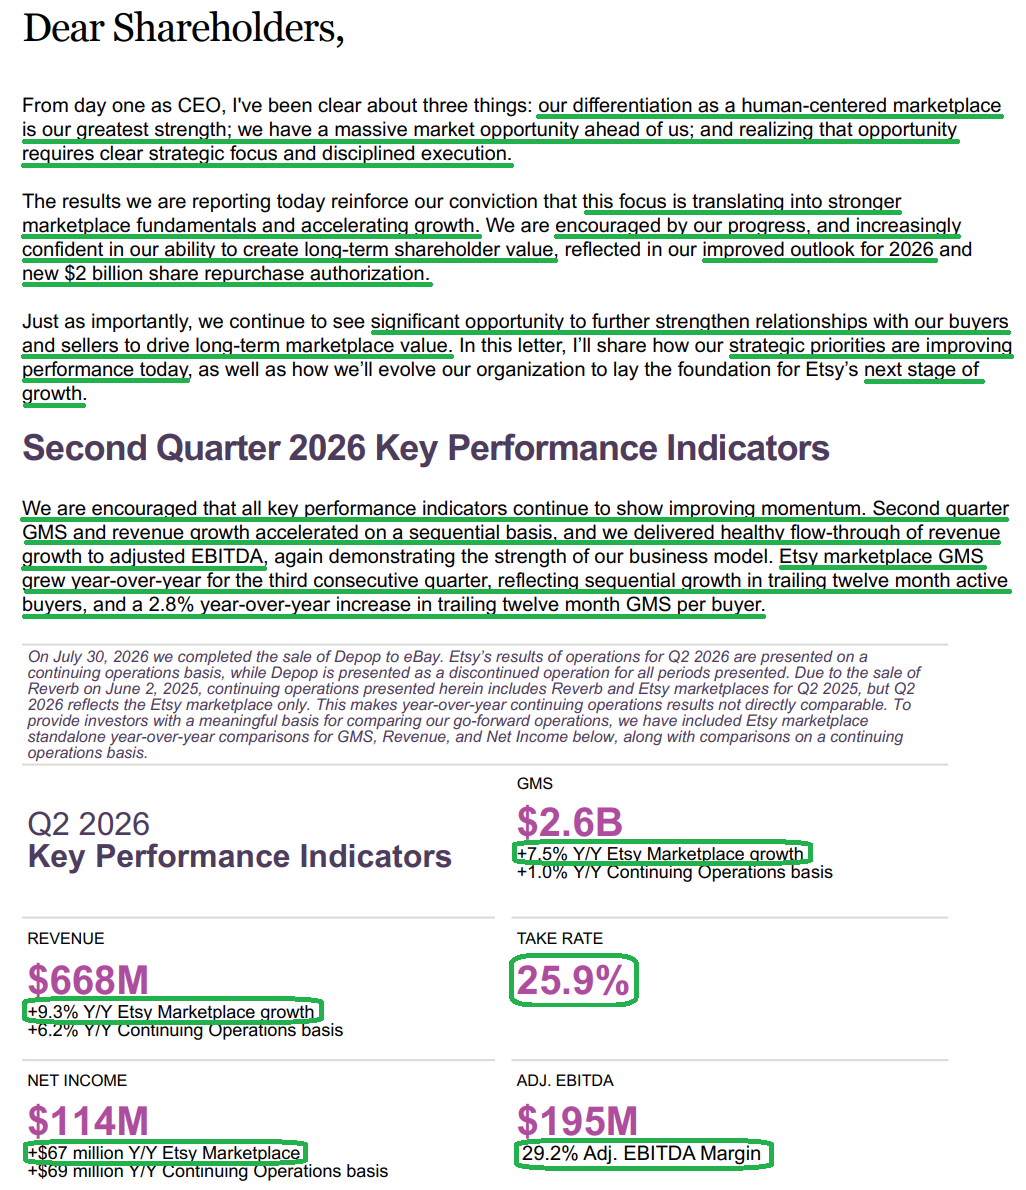
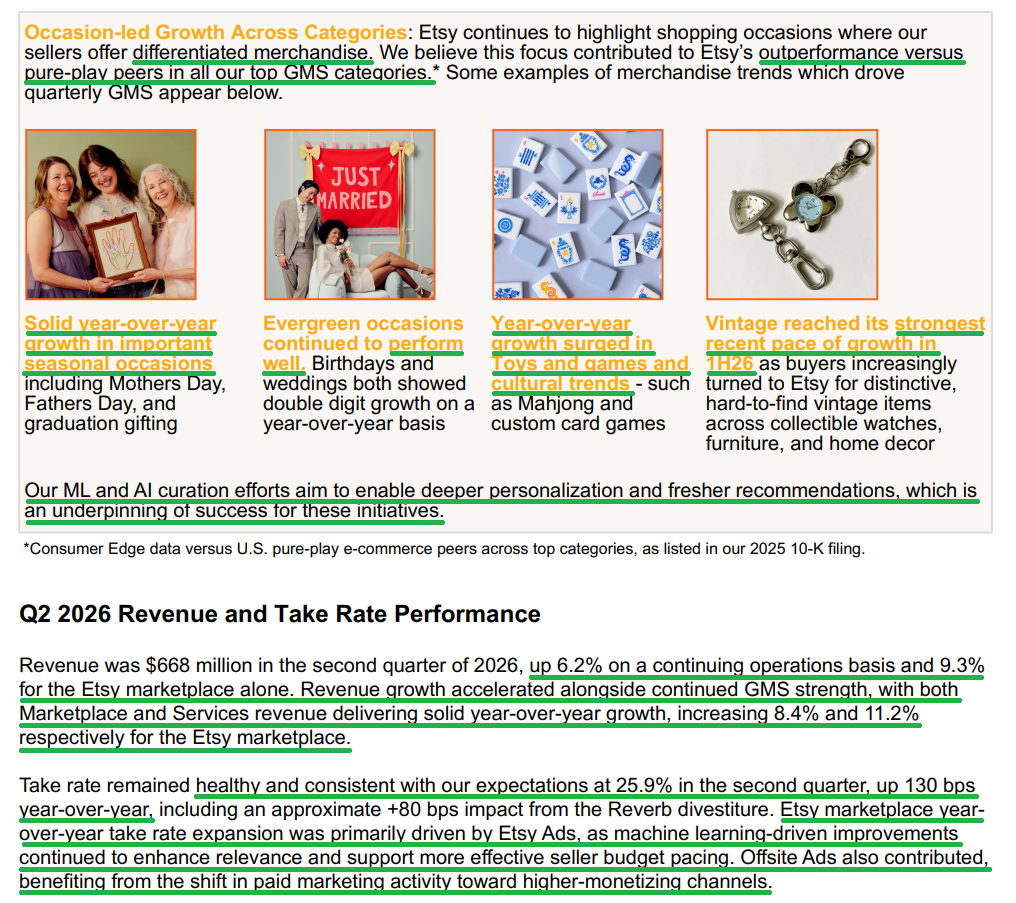
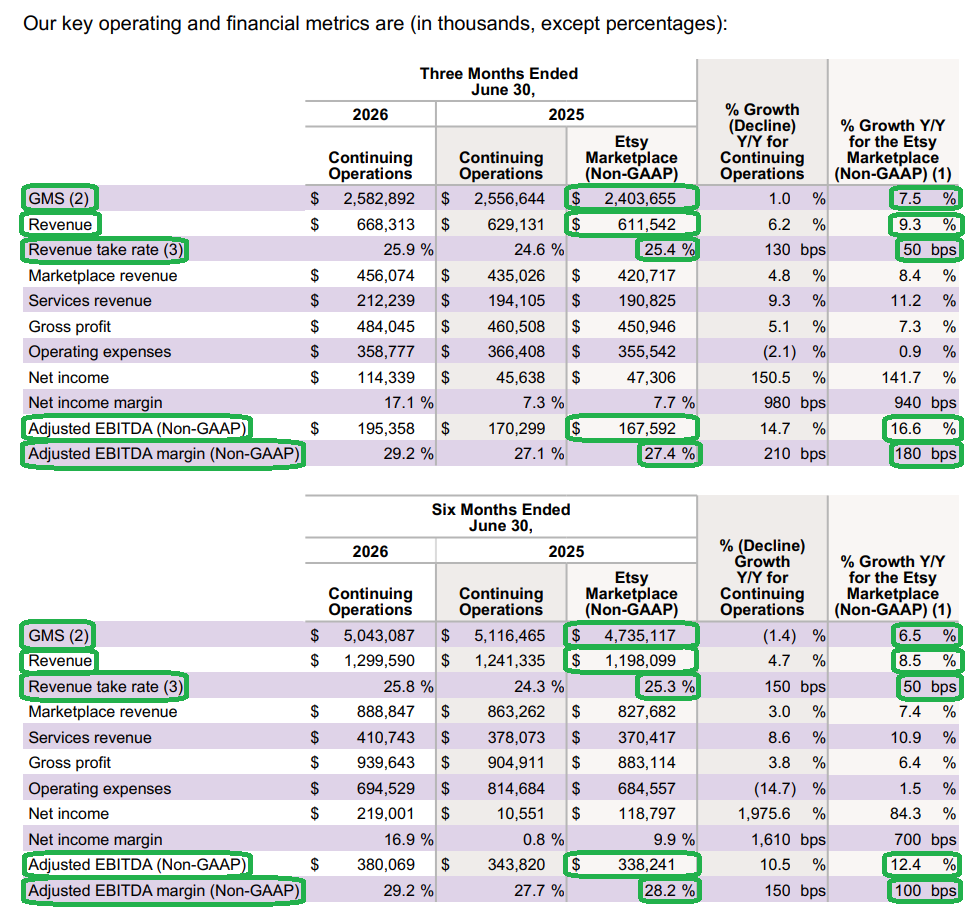
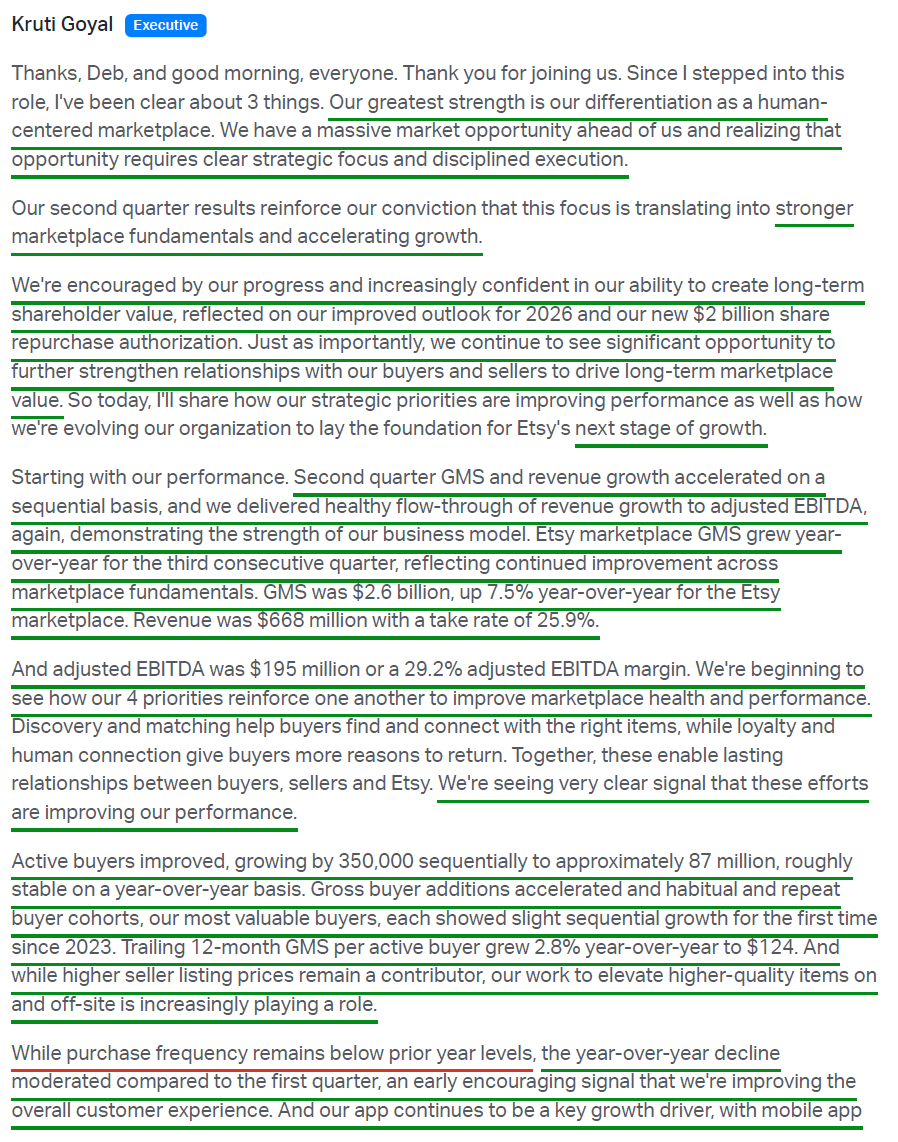
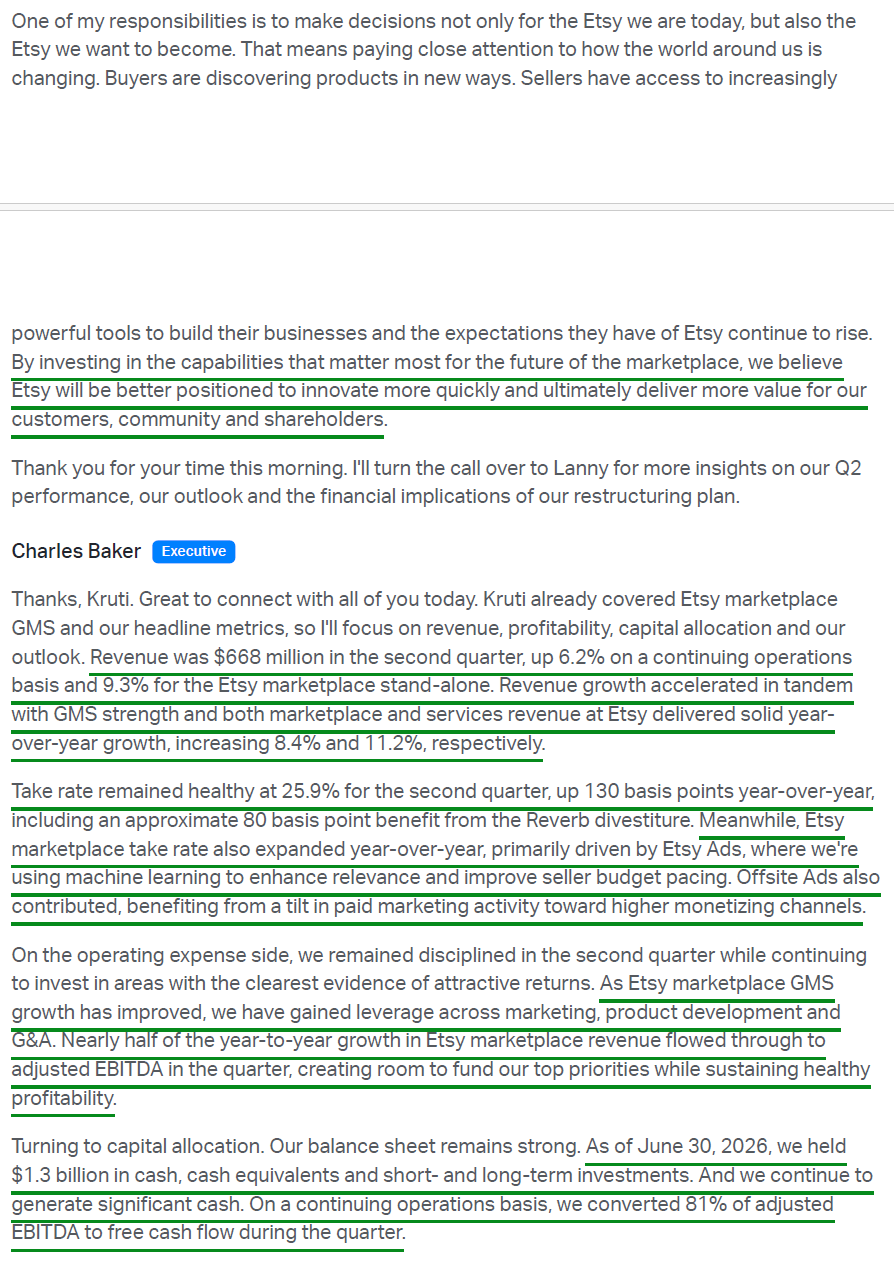
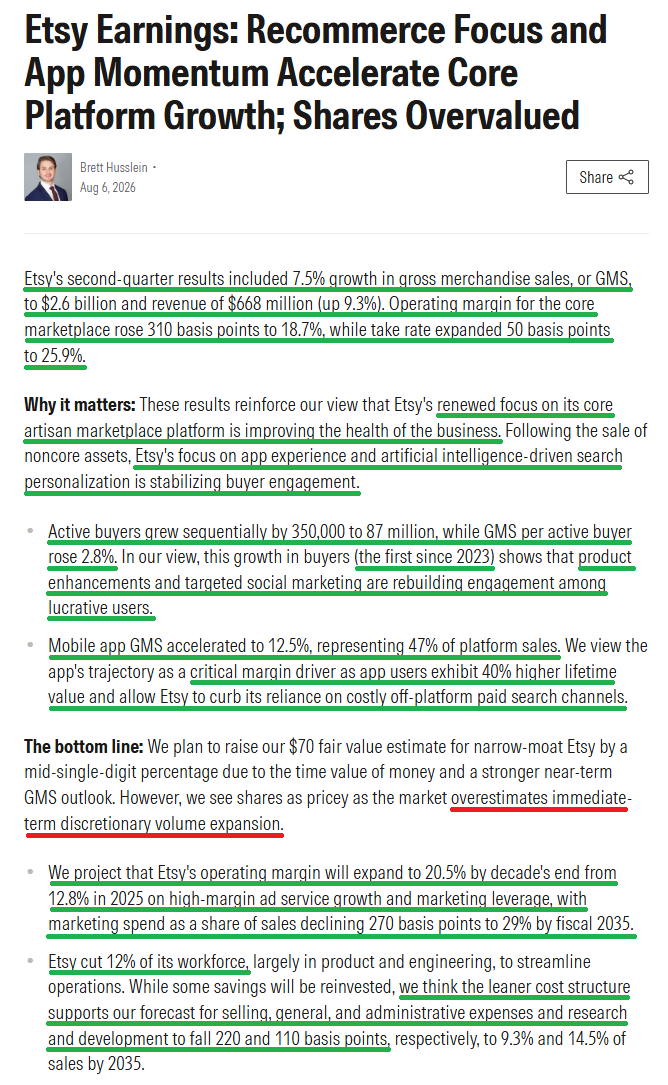
1) Etsy delivered Q2 revenue of $668.3M (+9.3% Y/Y for the Etsy marketplace, +6.2% Y/Y on a continuing operations basis), ahead of consensus of $649.1M and accelerating from +7.6% Y/Y in Q1. Marketplace revenue increased +8.4% to $456.1M, while higher-margin services revenue grew +11.2% to $212.2M.
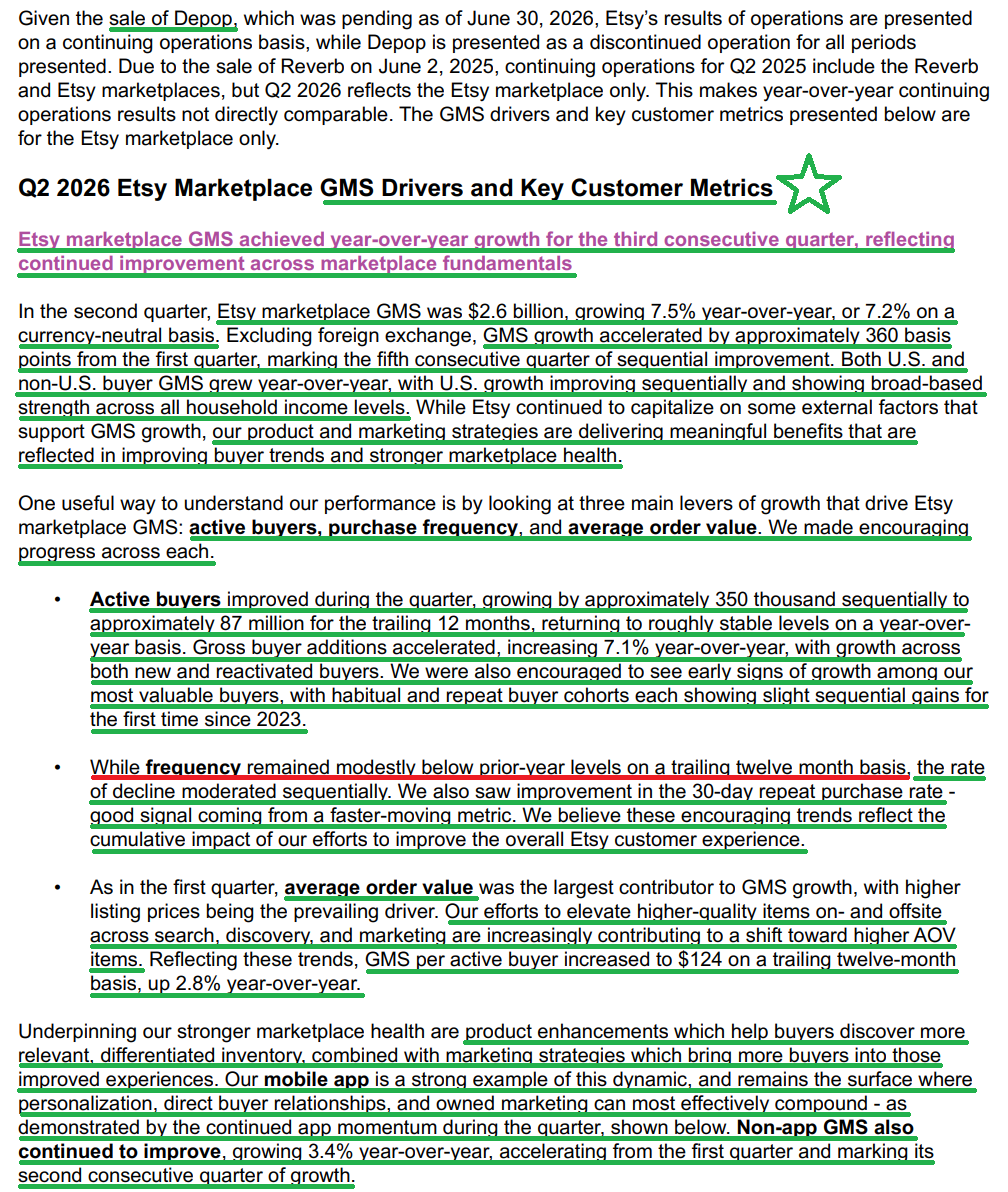
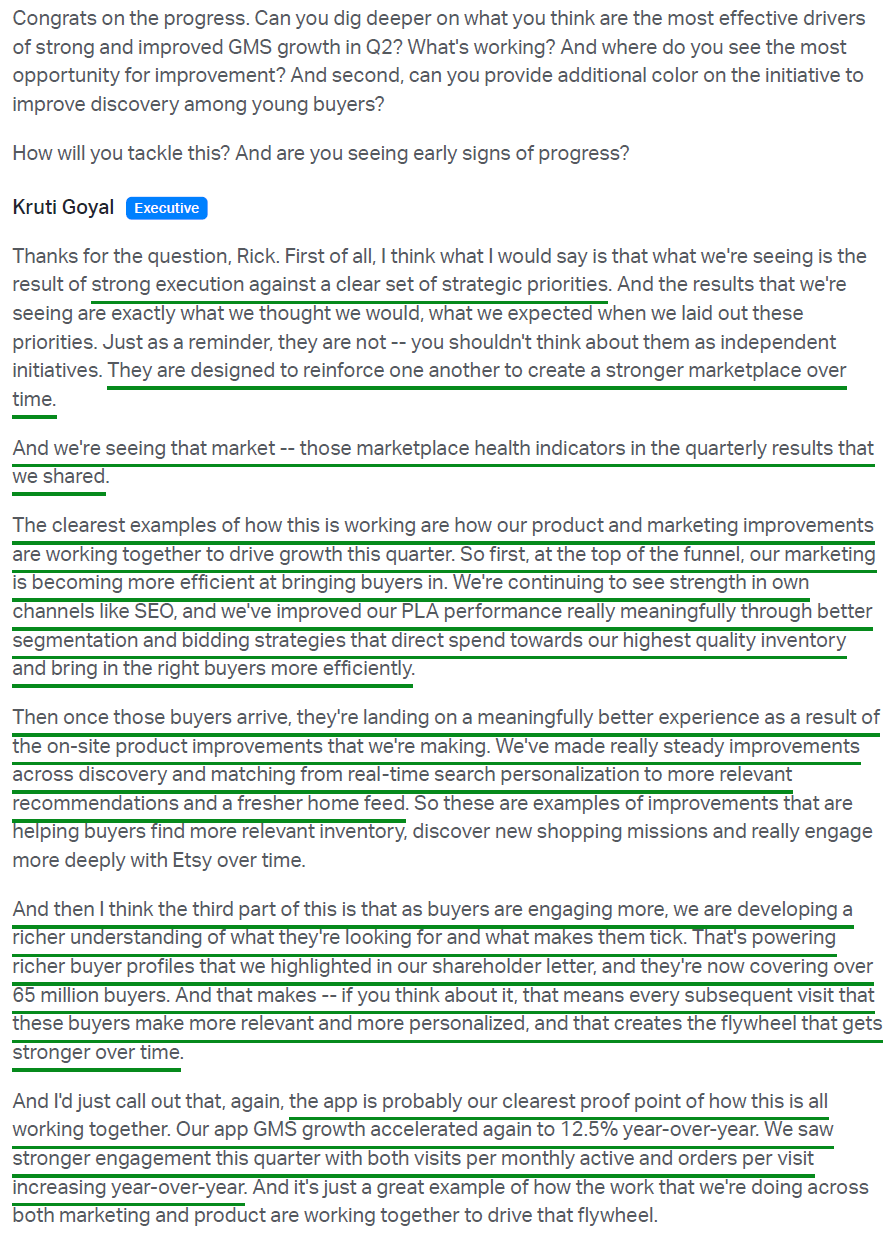
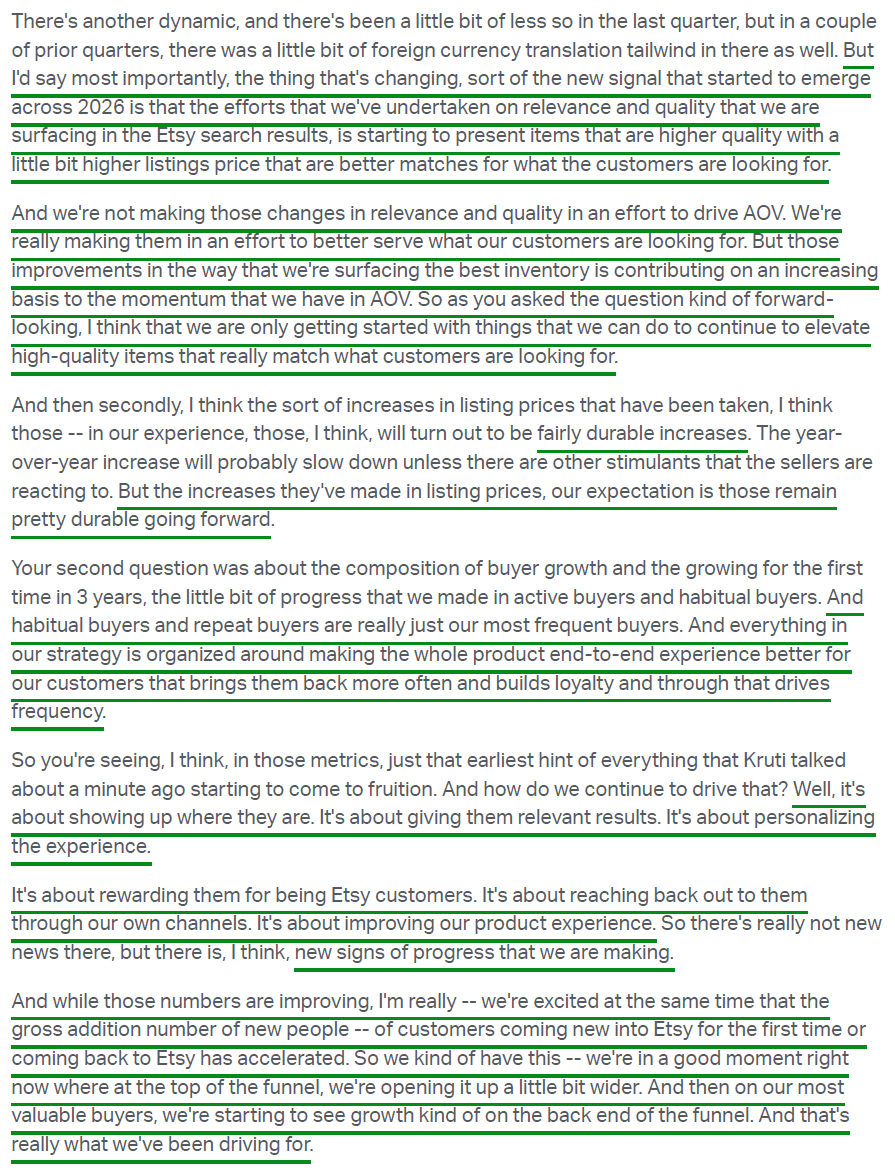
2) Etsy marketplace GMS reached $2.58B (+7.5% Y/Y, +7.2% Y/Y currency-neutral), ahead of consensus of $2.51B and above prior guidance of $2.48B to $2.53B (+3% to +5% Y/Y), marking the third consecutive quarter of Y/Y Etsy marketplace GMS growth. Excluding FX, growth accelerated ~360 bps from Q1, representing the fifth consecutive quarter of sequential improvement, with the growth rate up nearly 13 percentage points from the -5.4% posted in the year-ago quarter. Both U.S. and non-U.S. buyer GMS grew Y/Y, with U.S. growth improving sequentially and broad-based across all household income levels. Average order value was the largest contributor to growth, driven by higher listing prices, with TTM GMS per active buyer reaching $124 (+2.8% Y/Y, +1.3% Q/Q).
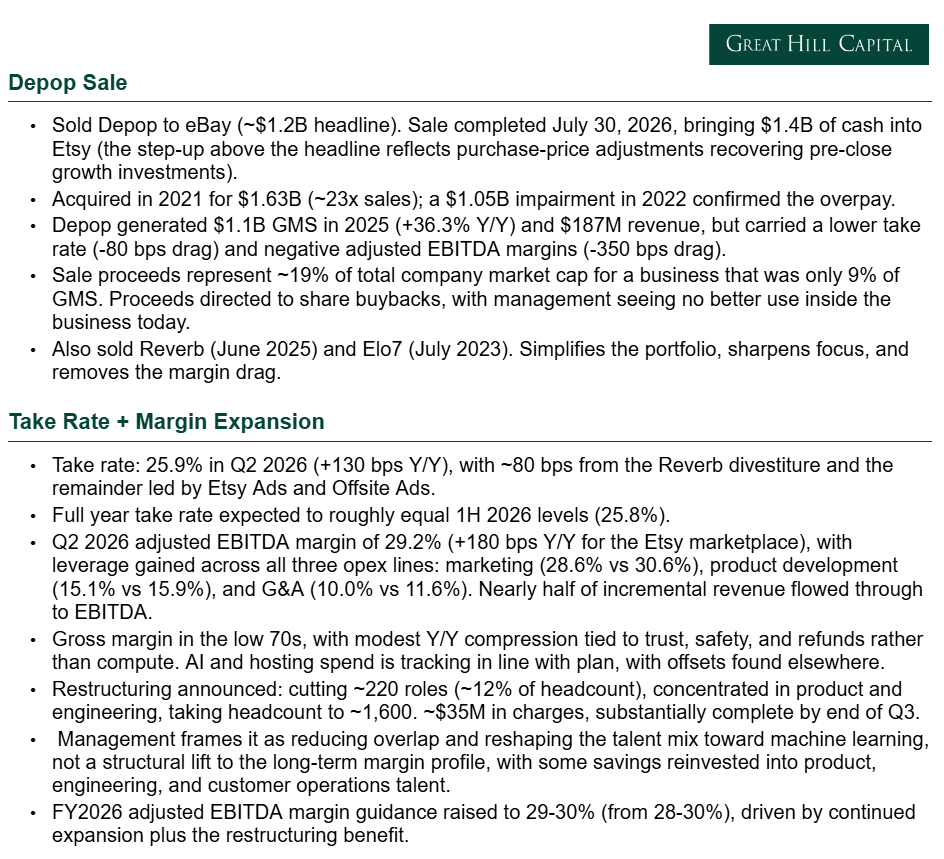
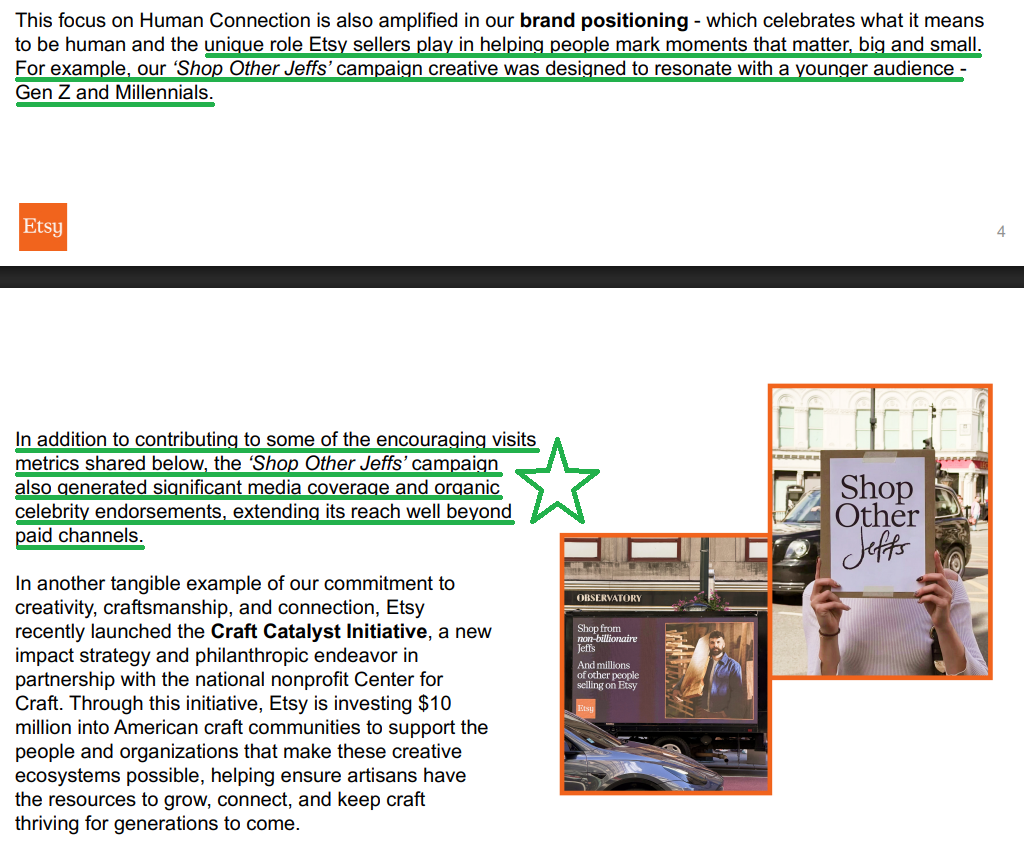
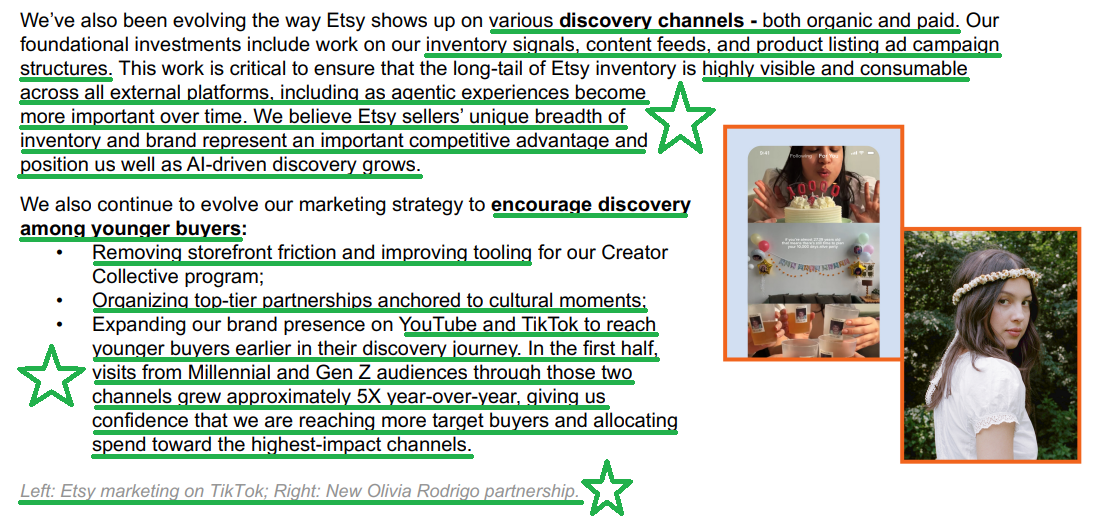
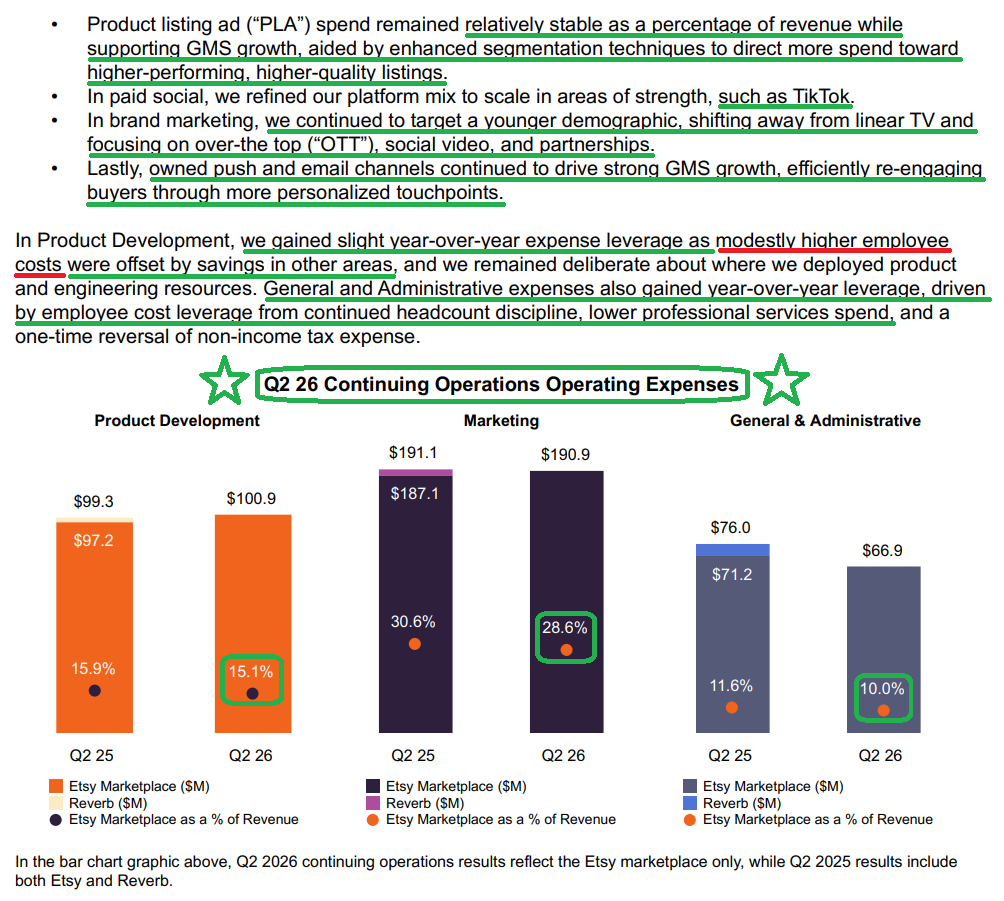
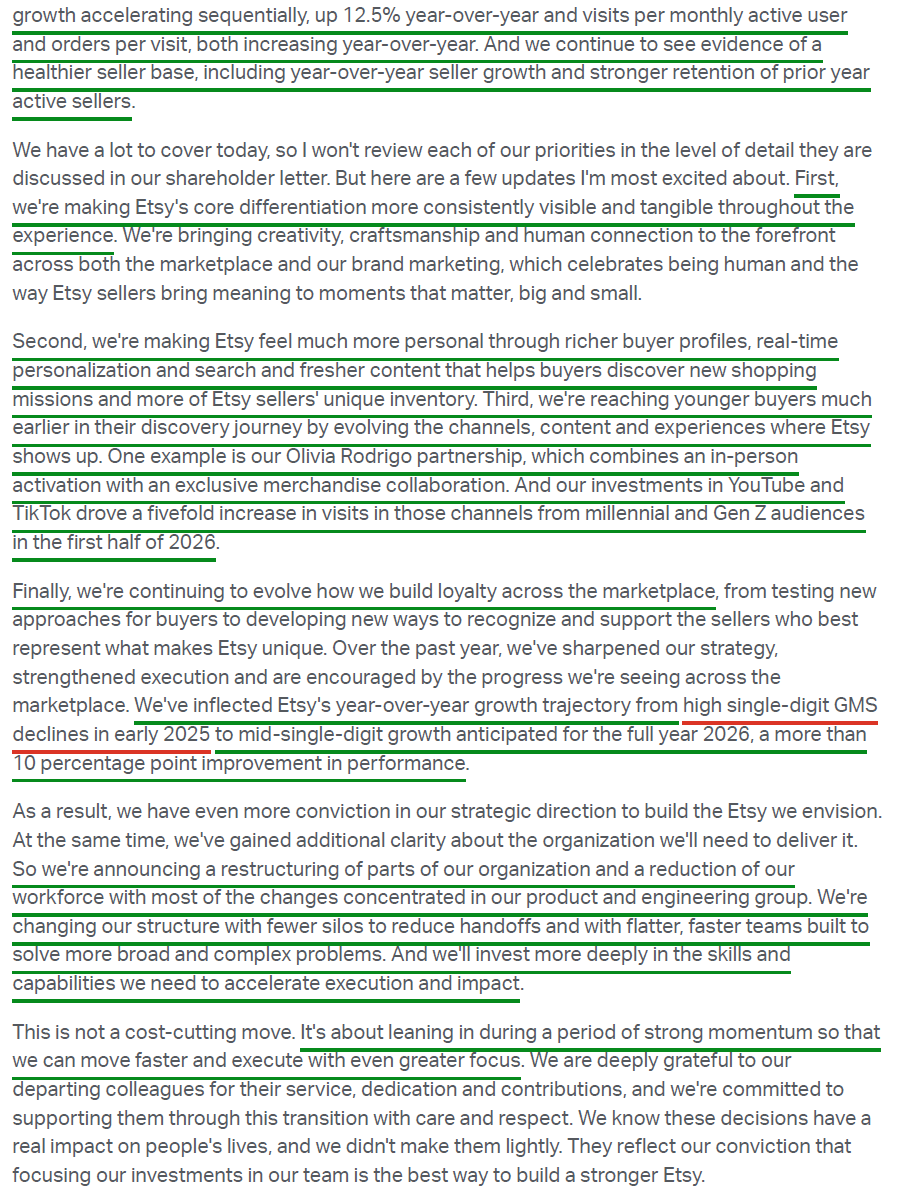
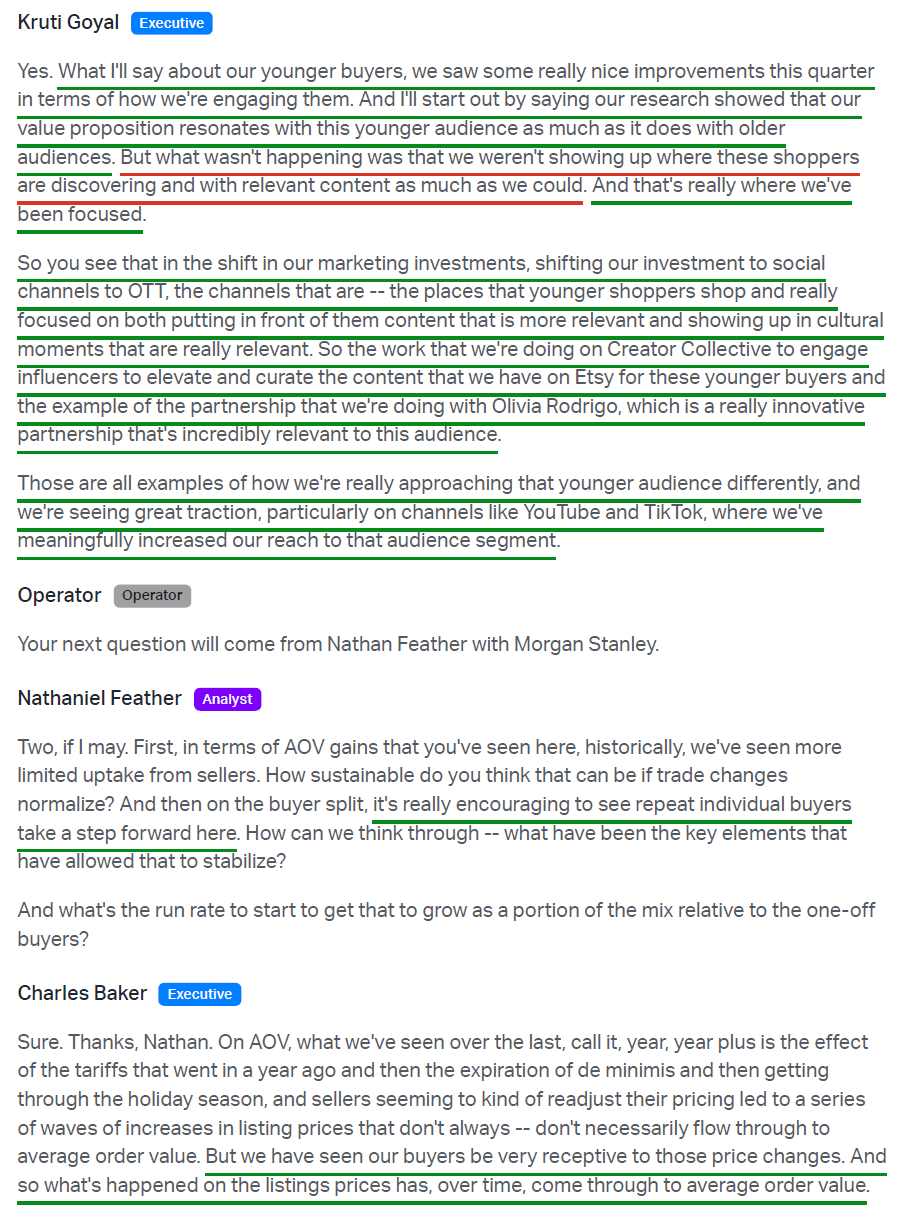
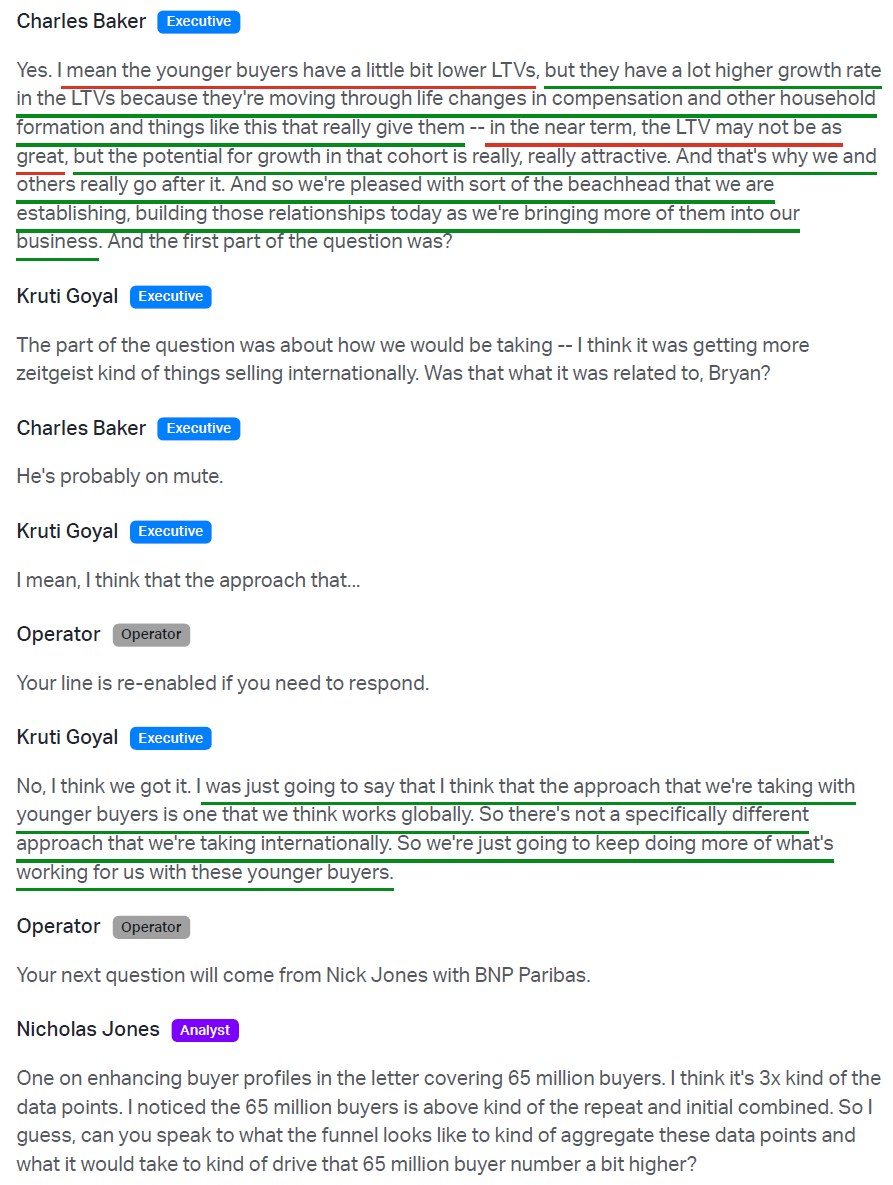
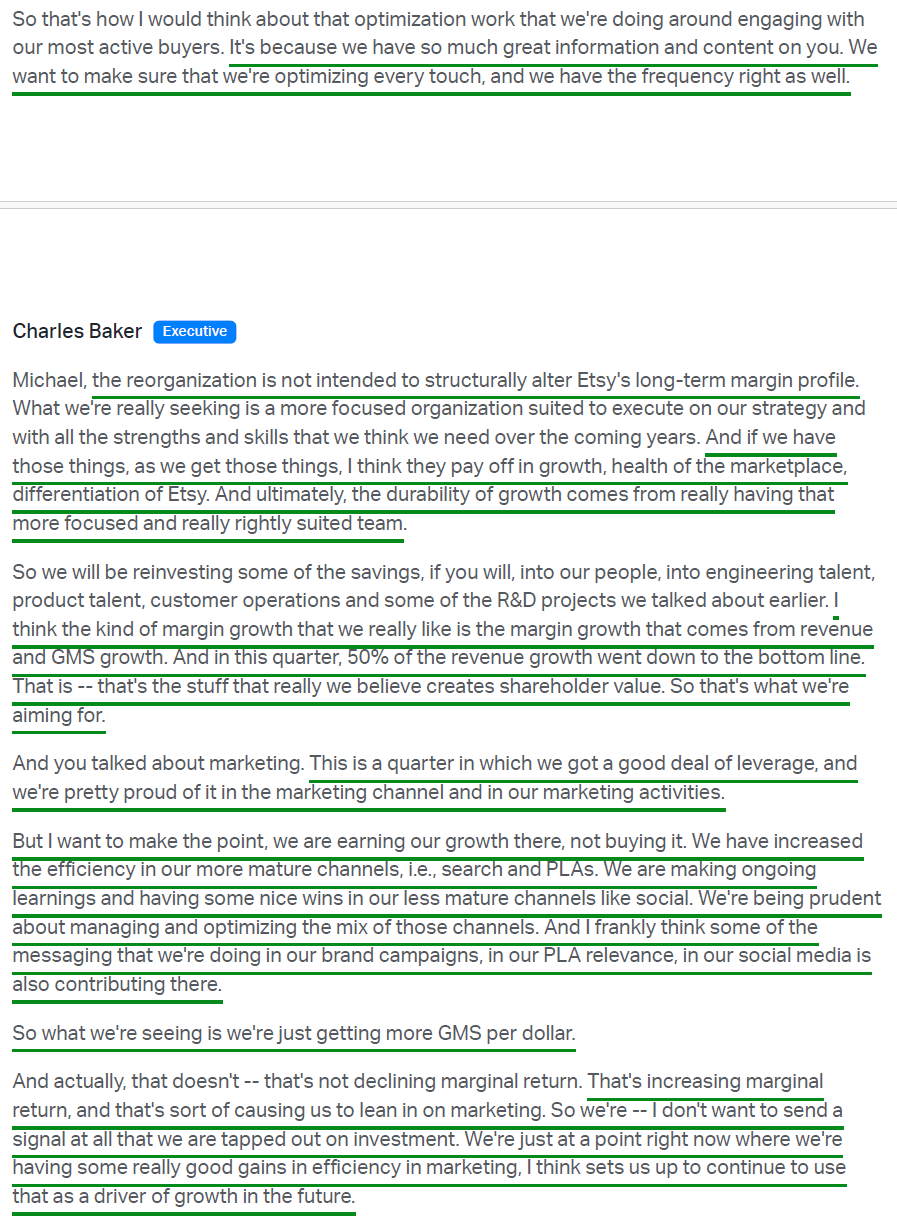
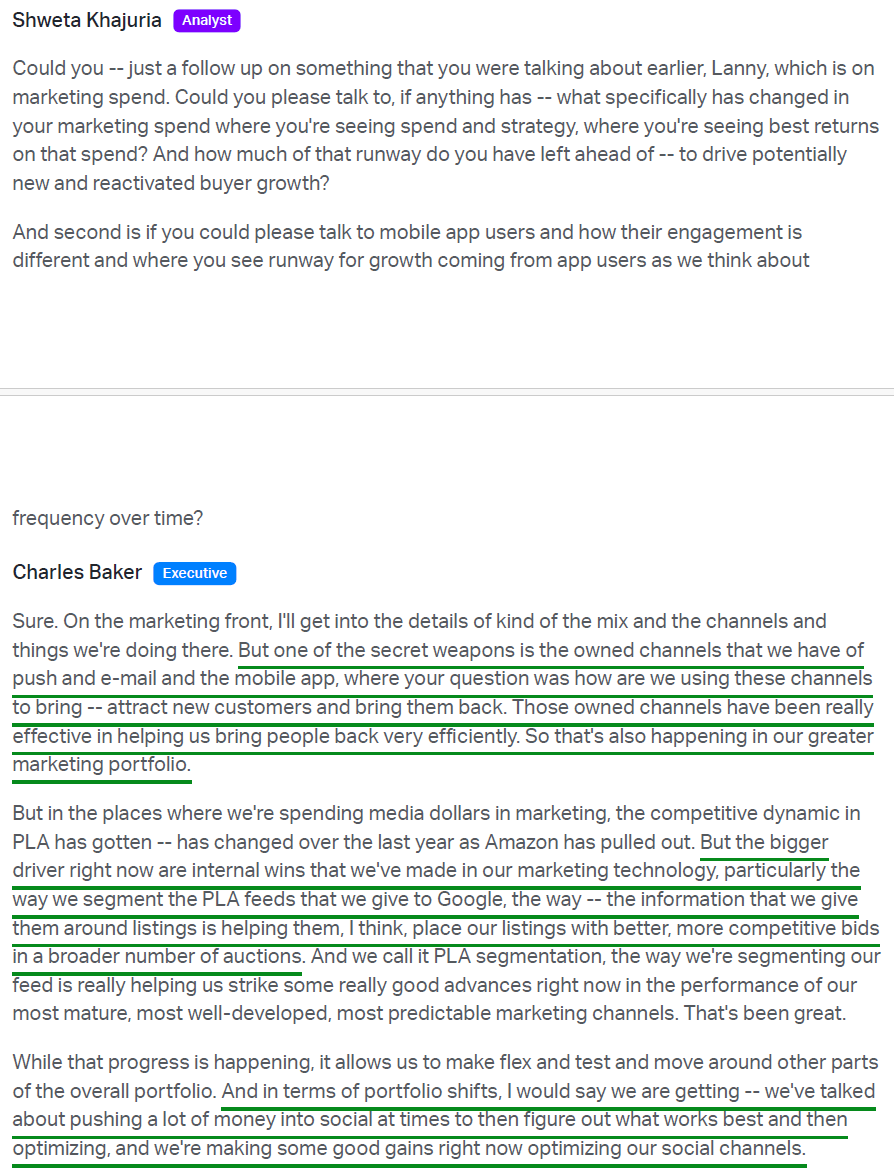
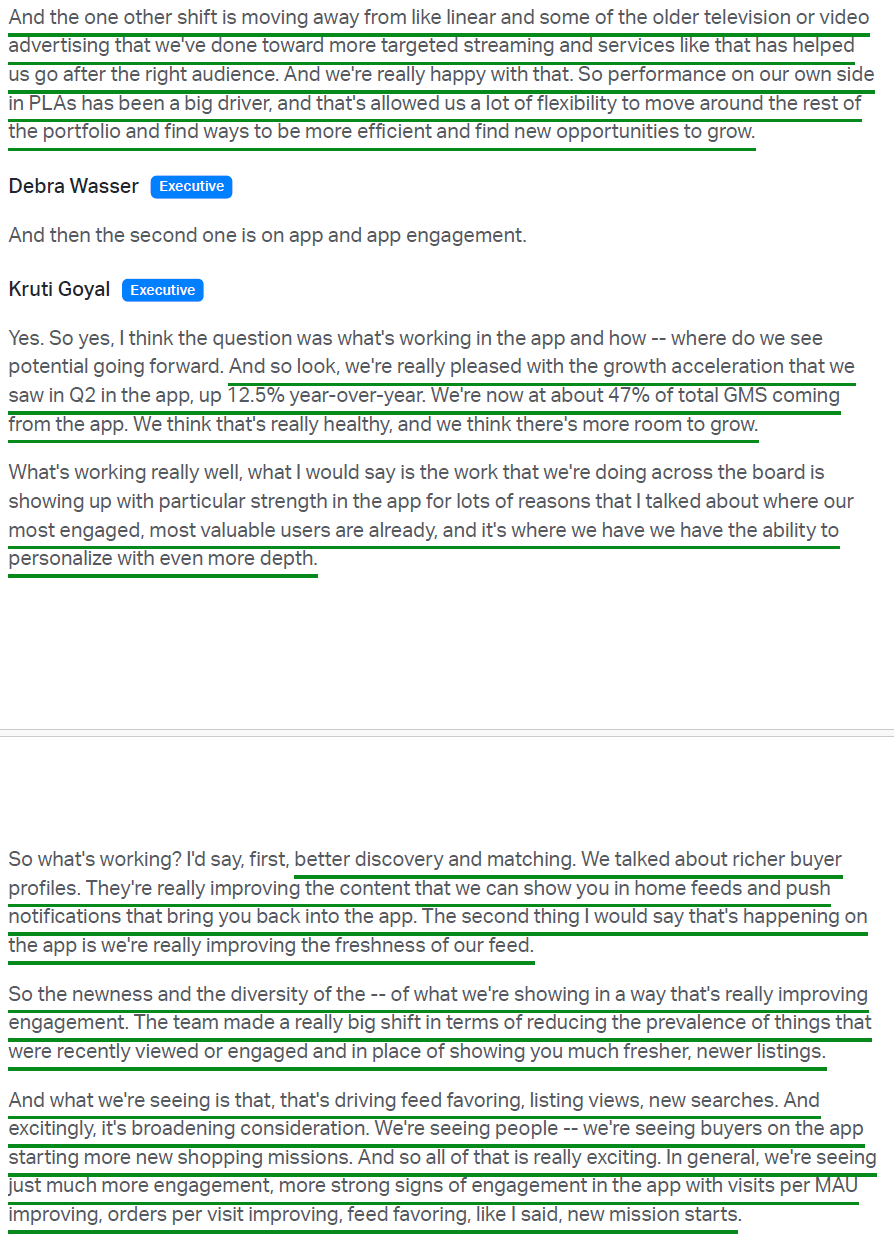
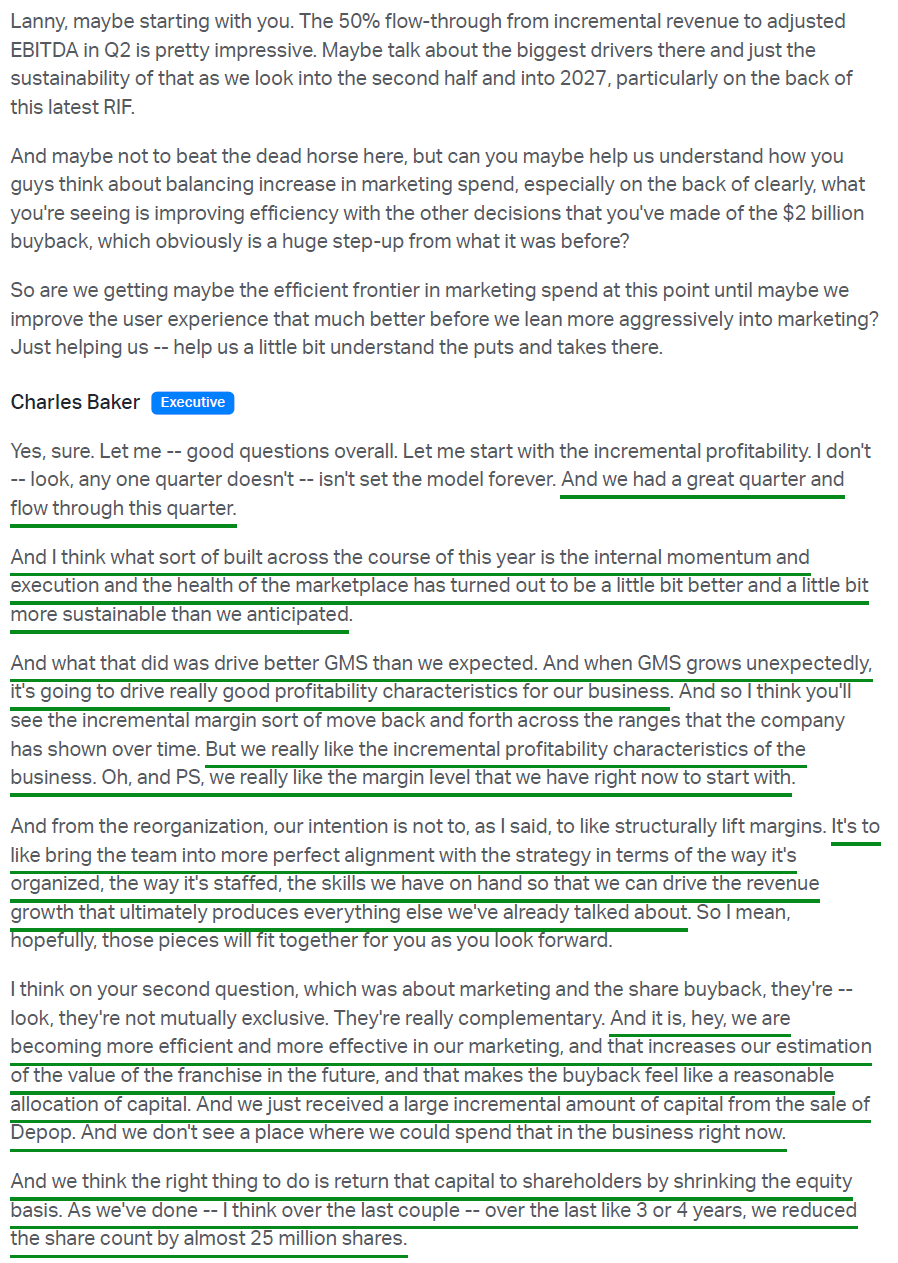
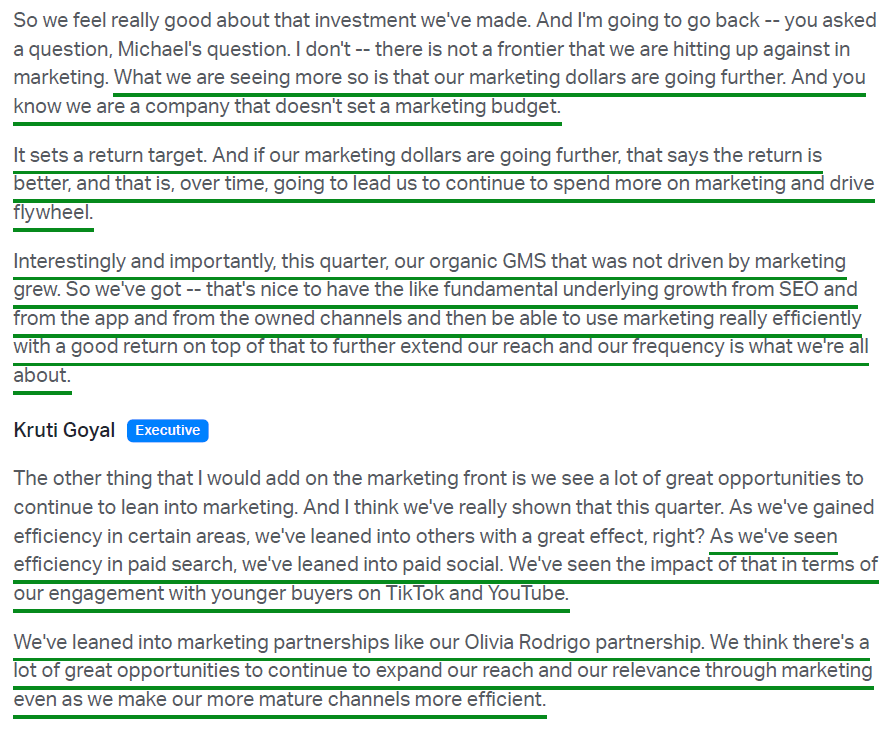
3) Adjusted EBITDA came in at $195.4M (29.2% margin, +180 bps Y/Y for the Etsy marketplace), ahead of prior guidance of 27% to 29%, with nearly half of incremental revenue flowing through to adjusted EBITDA in the quarter. Etsy gained leverage across all three opex lines: marketing fell to 28.6% of revenue (vs 30.6%), product development to 15.1% (vs 15.9%), as modestly higher employee costs were offset by savings elsewhere, and G&A to 10.0% (vs 11.6%) on continued headcount discipline, lower professional services spend, and a one-time reversal of non-income tax expense. Marketing remains the strongest efficiency lever, with management leaning into paid social in areas of strength such as TikTok and shifting brand spend away from linear TV toward over-the-top streaming and social video, where first-half visits from Millennial and Gen Z audiences grew ~5x Y/Y.
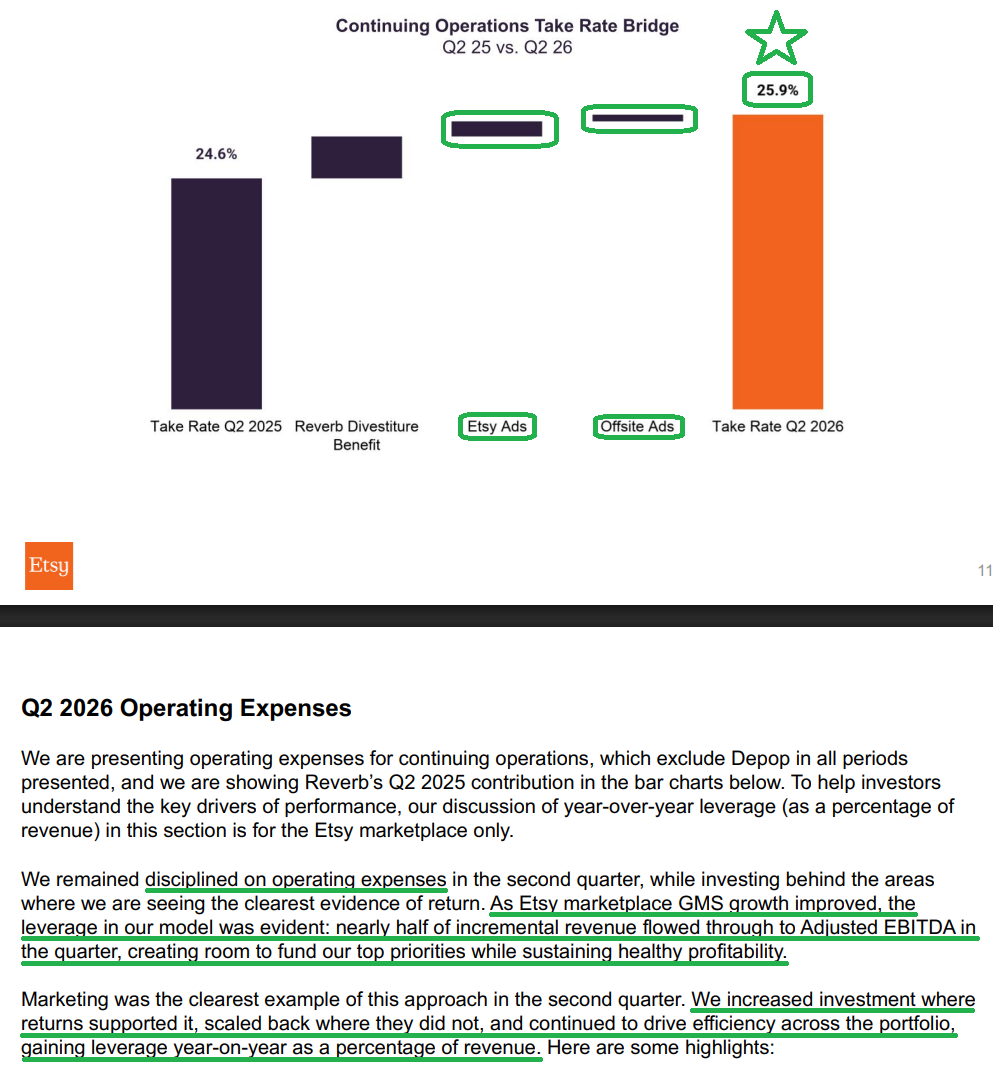
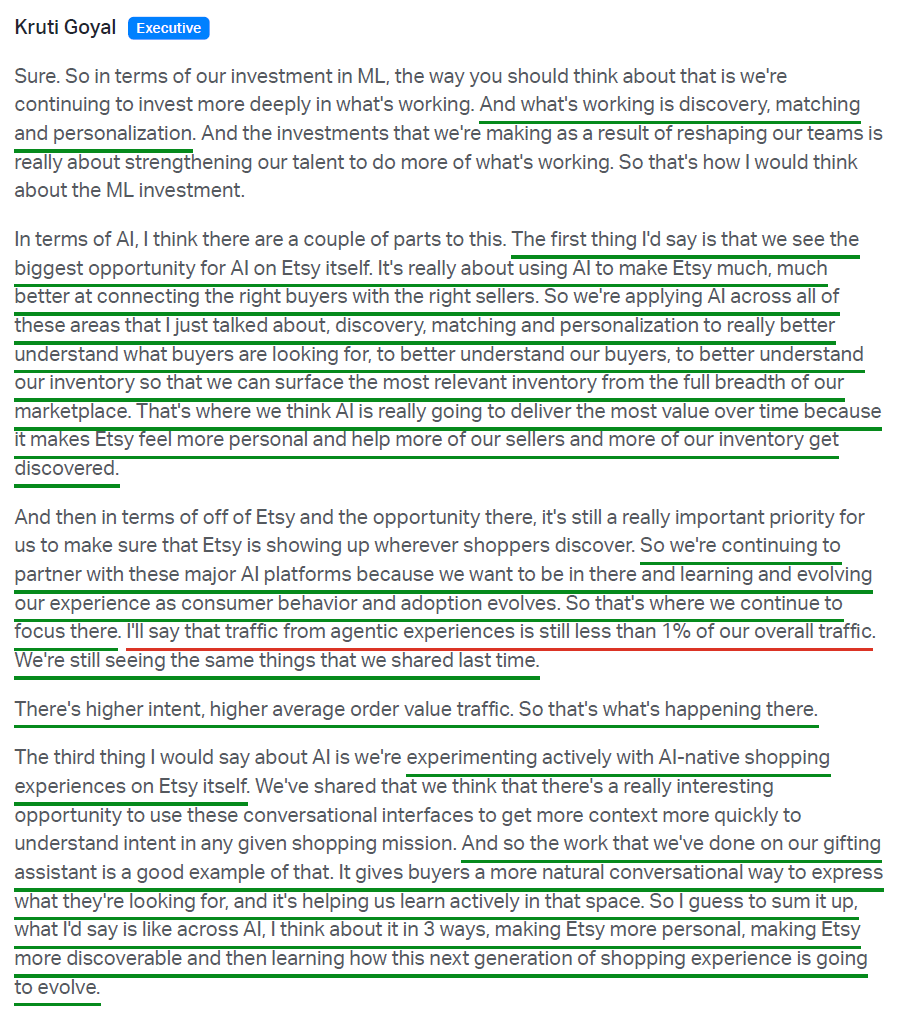
4) Take rate expanded +130 bps Y/Y to 25.9%, ahead of prior guidance of ~25.7%, with ~80 bps of the expansion driven by the Reverb divestiture. The remainder was led by Etsy Ads, where machine learning improvements continue to enhance relevance and put seller ad budgets to better use throughout the day. Offsite Ads also contributed, benefiting from the shift in paid marketing activity toward higher-monetizing channels.
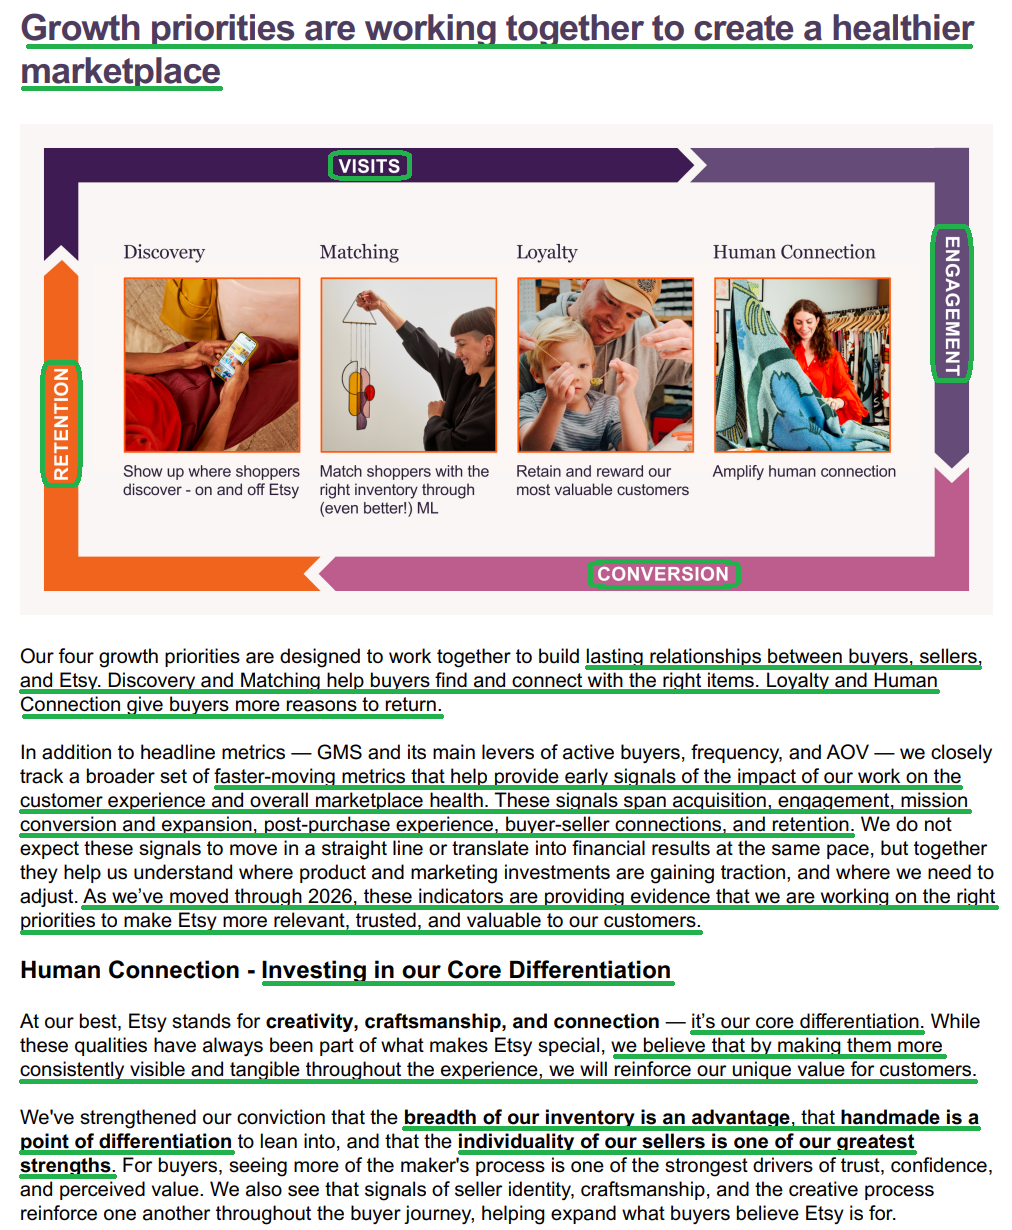
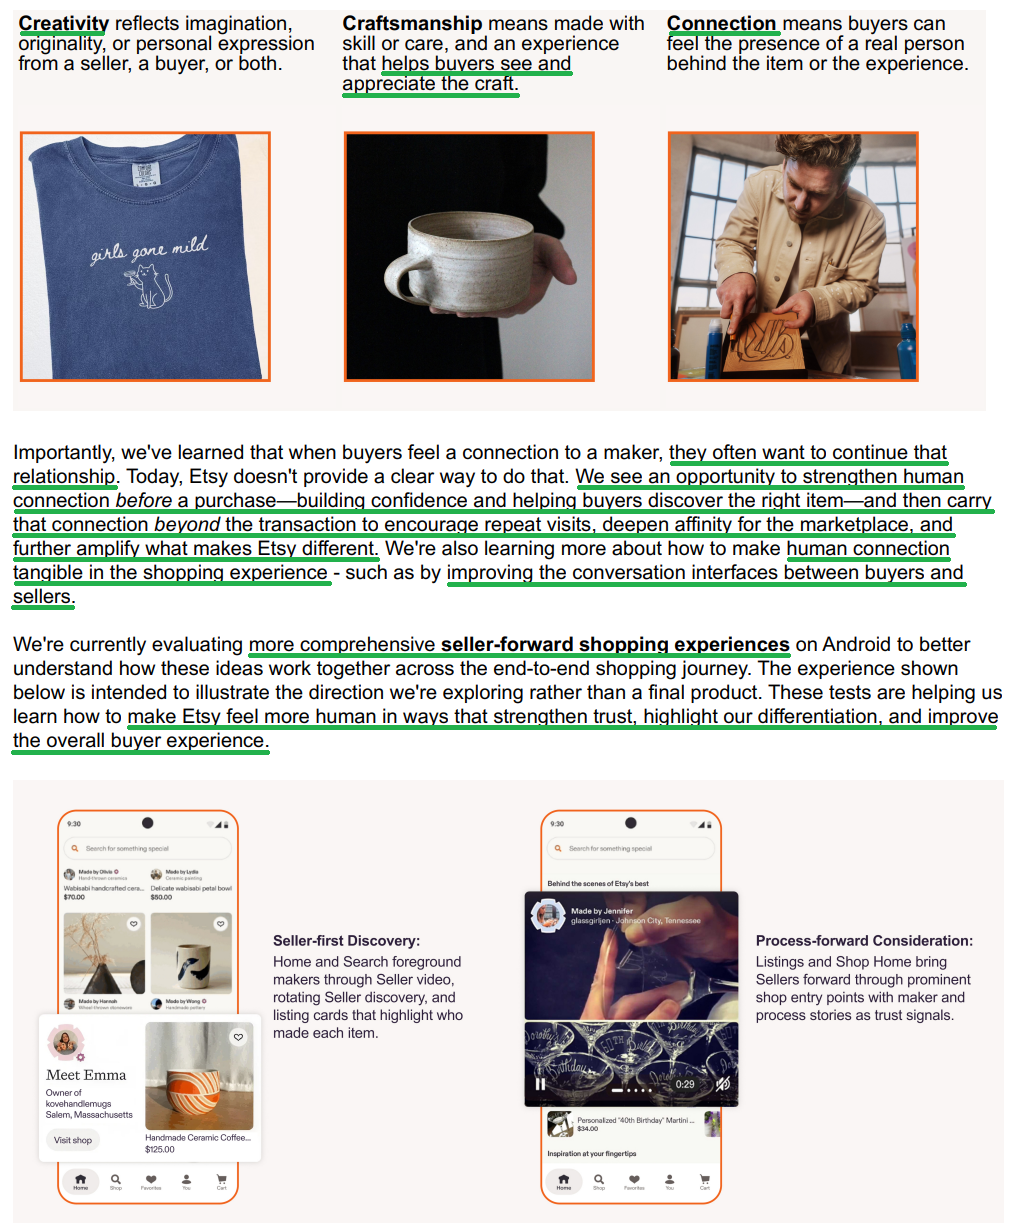
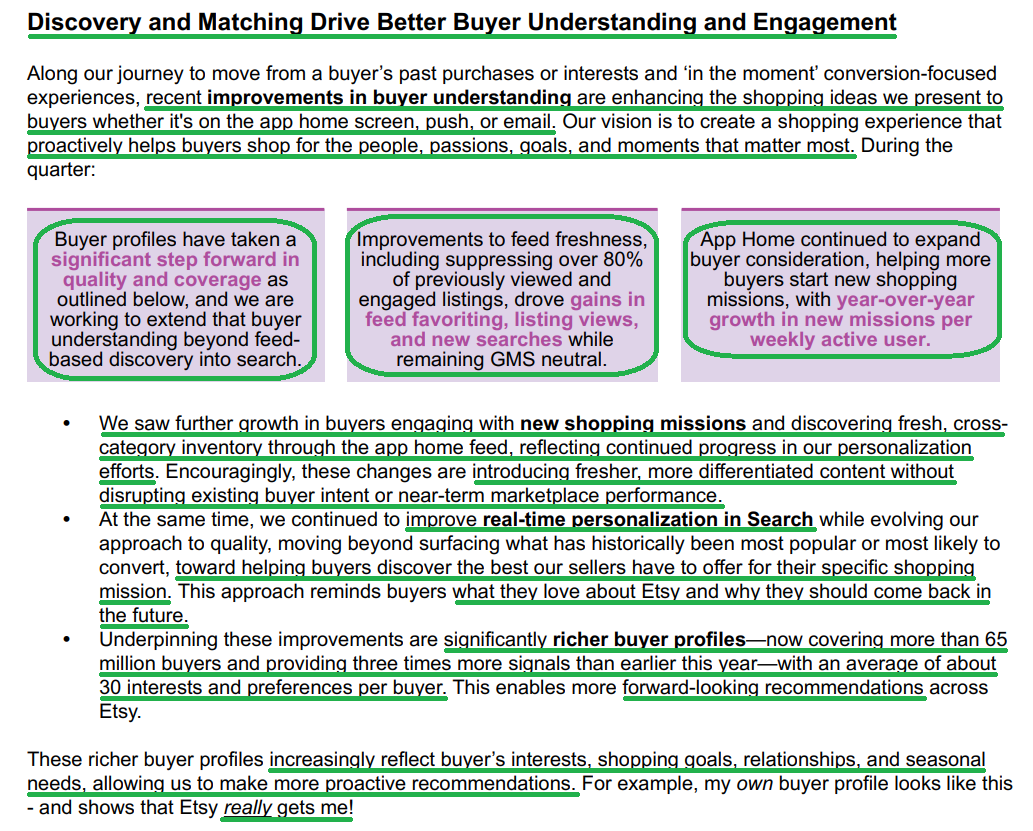
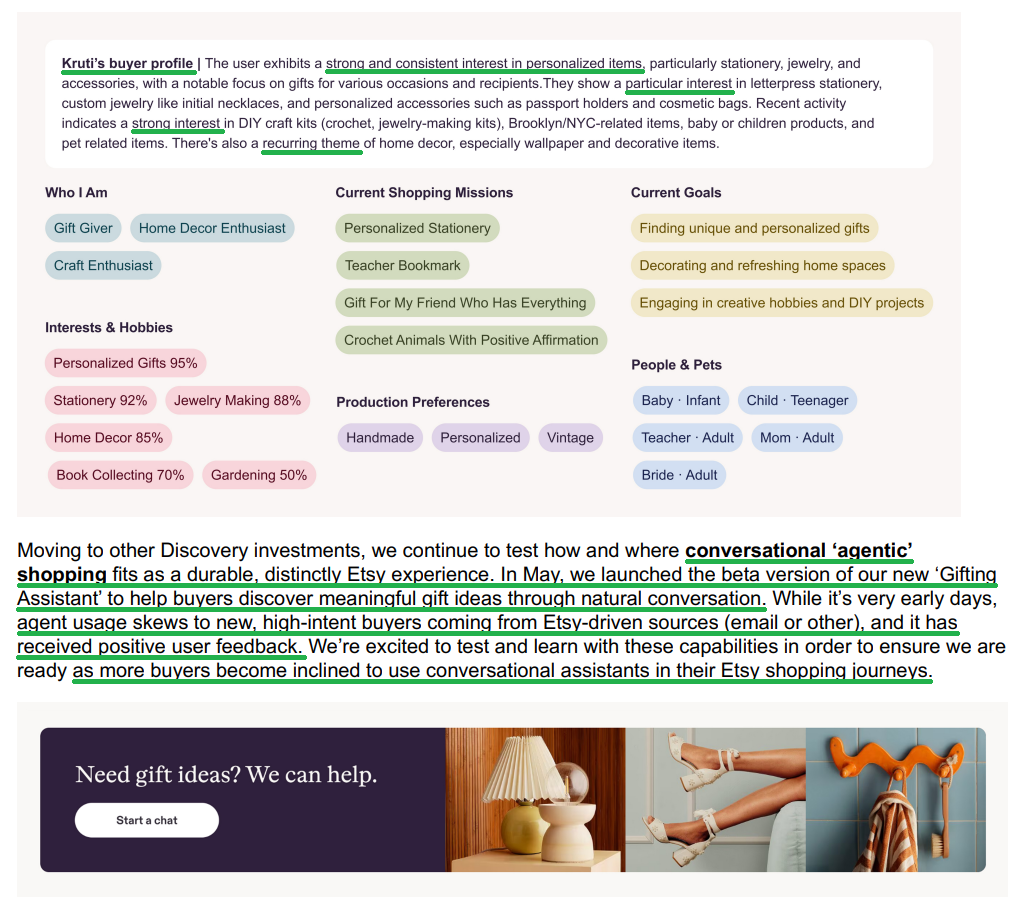
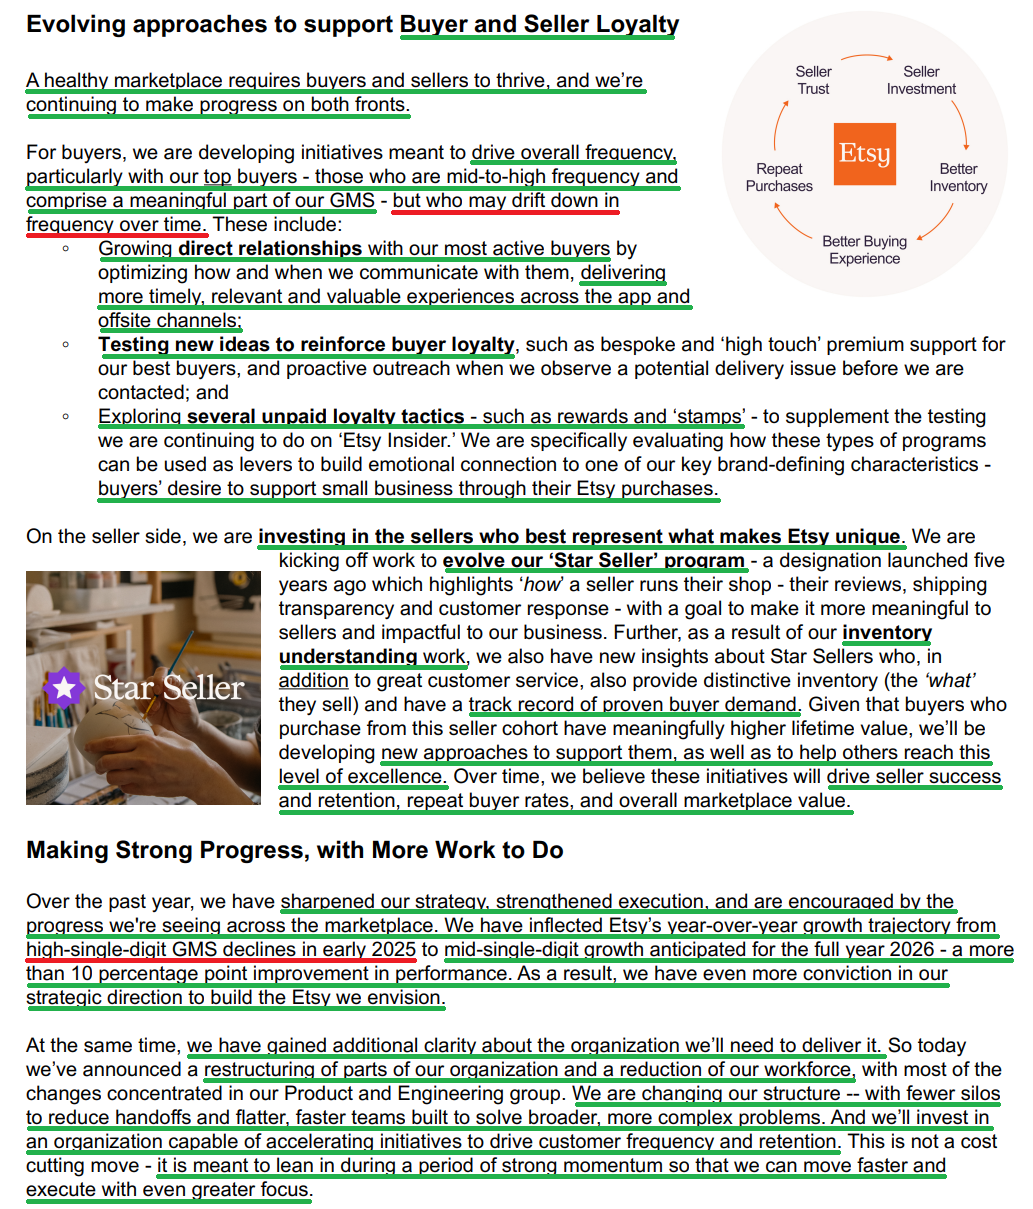
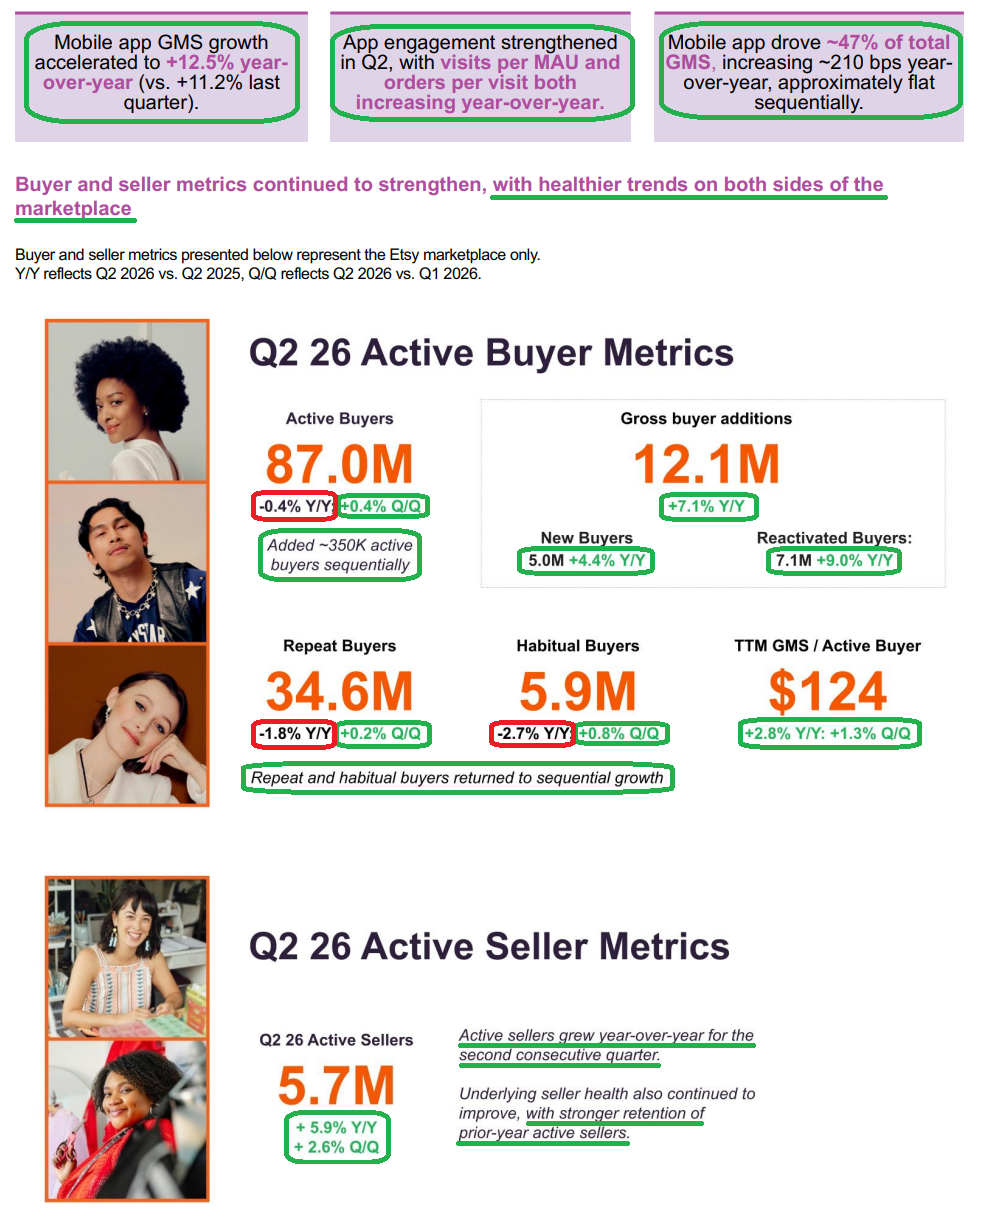
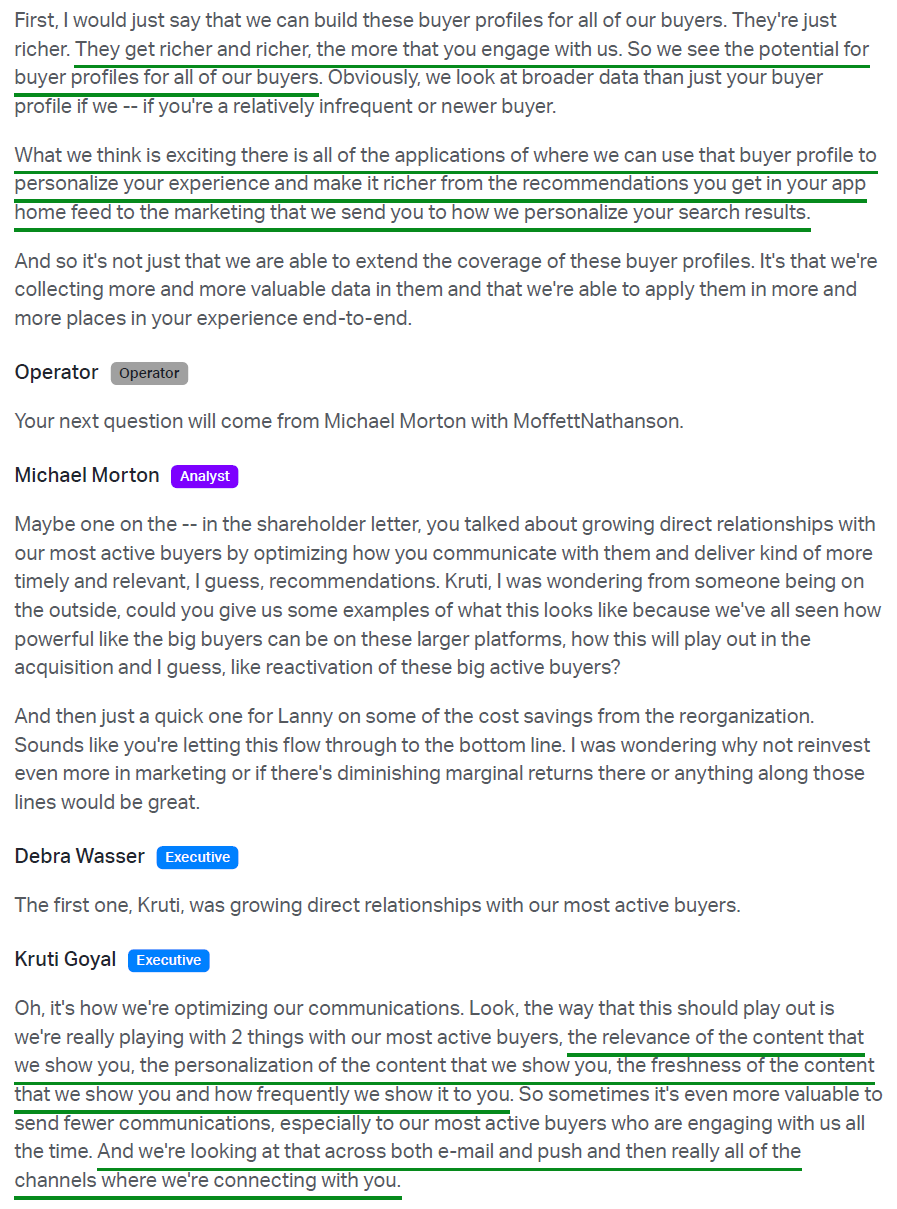
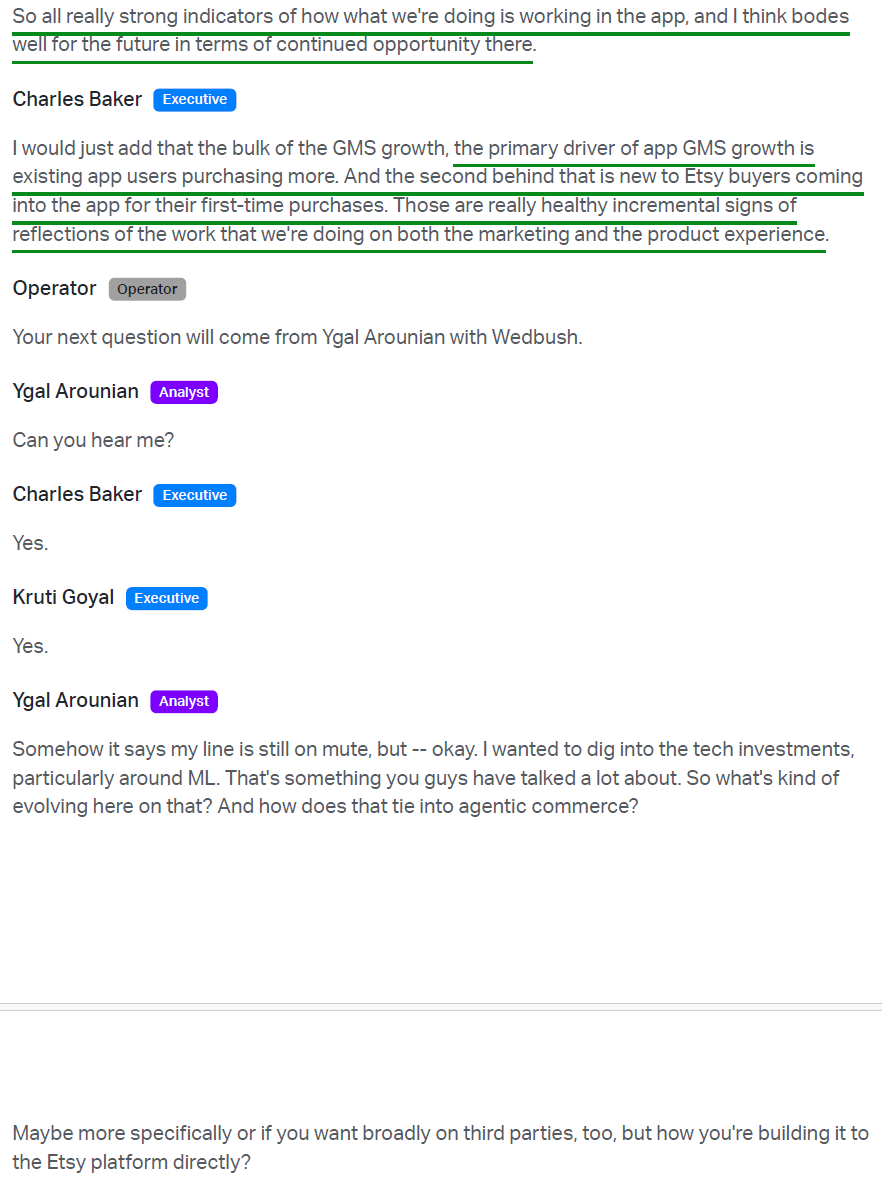
5) The mobile app remains the centerpiece of the growth inflection, with app GMS accelerating to +12.5% Y/Y (vs +11.2% in Q1) and reaching ~47% of total GMS (+210 bps Y/Y, roughly flat sequentially), a level management called healthy, with more room to grow. App engagement strengthened during the quarter, with both visits per MAU and orders per visit increasing Y/Y. Etsy also pulled back on resurfacing listings buyers had already viewed, showing fresher inventory instead, which drove more favoriting and searching, with buyers beginning to shop for a wider range of occasions. Management noted that the bulk of app GMS growth came from existing app users purchasing more, with new-to-Etsy buyers entering through the app as the second-largest contributor. Non-app GMS also improved to +3.4% Y/Y (vs +1.0% last quarter), accelerating from Q1 and marking its second consecutive quarter of growth.
6) Key customer metrics continued to move in a healthier direction on both sides of the marketplace. Active buyers grew ~350K sequentially to 87.0M (-0.4% Y/Y, +0.4% Q/Q), returning to roughly stable levels on a Y/Y basis. Gross buyer additions accelerated to 12.1M (+7.1% Y/Y), with new buyers of 5.0M (+4.4% Y/Y) and reactivated buyers of 7.1M (+9.0% Y/Y). Repeat buyers of 34.6M and habitual buyers of 5.9M each posted slight sequential gains, the first since 2023. Active sellers grew +5.9% Y/Y to 5.7M, marking the second consecutive quarter of Y/Y growth and supported by stronger retention of prior-year active sellers. Frequency remained modestly below prior-year levels on a TTM basis, though the rate of decline moderated sequentially and the 30-day repeat purchase rate improved.
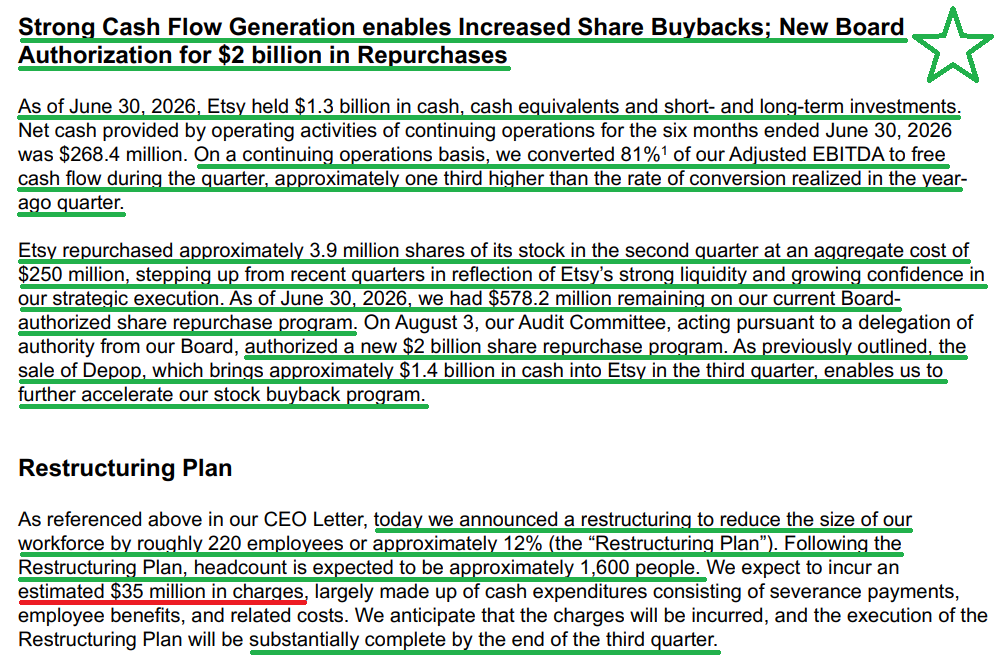
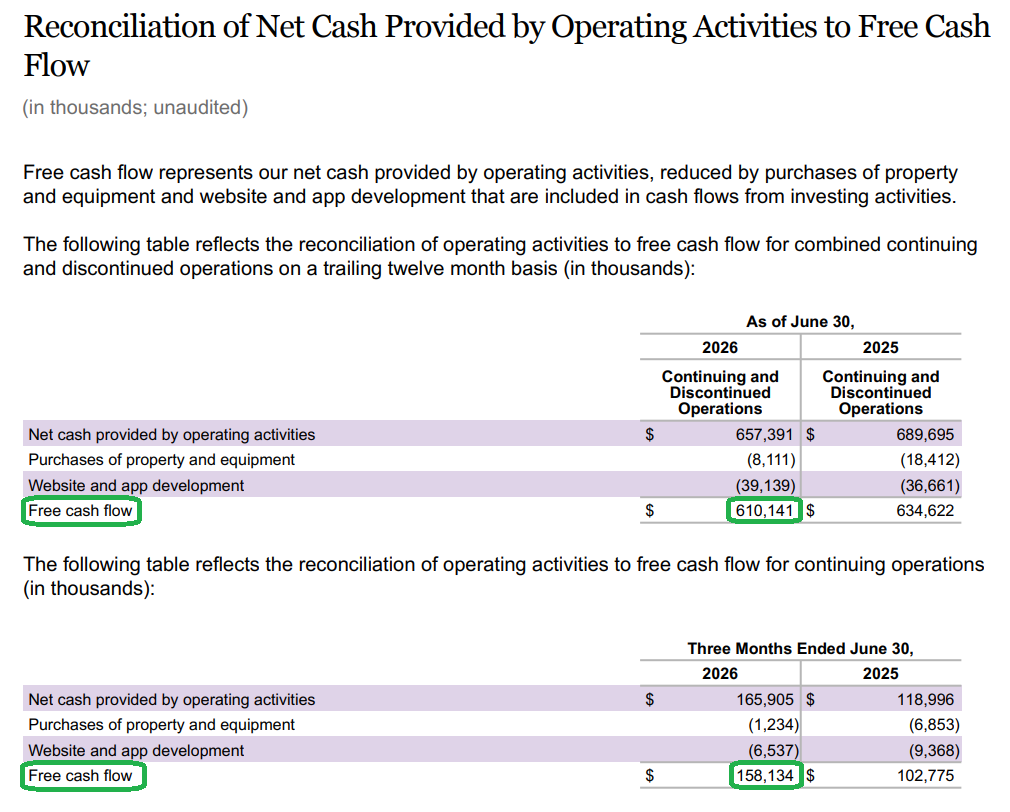
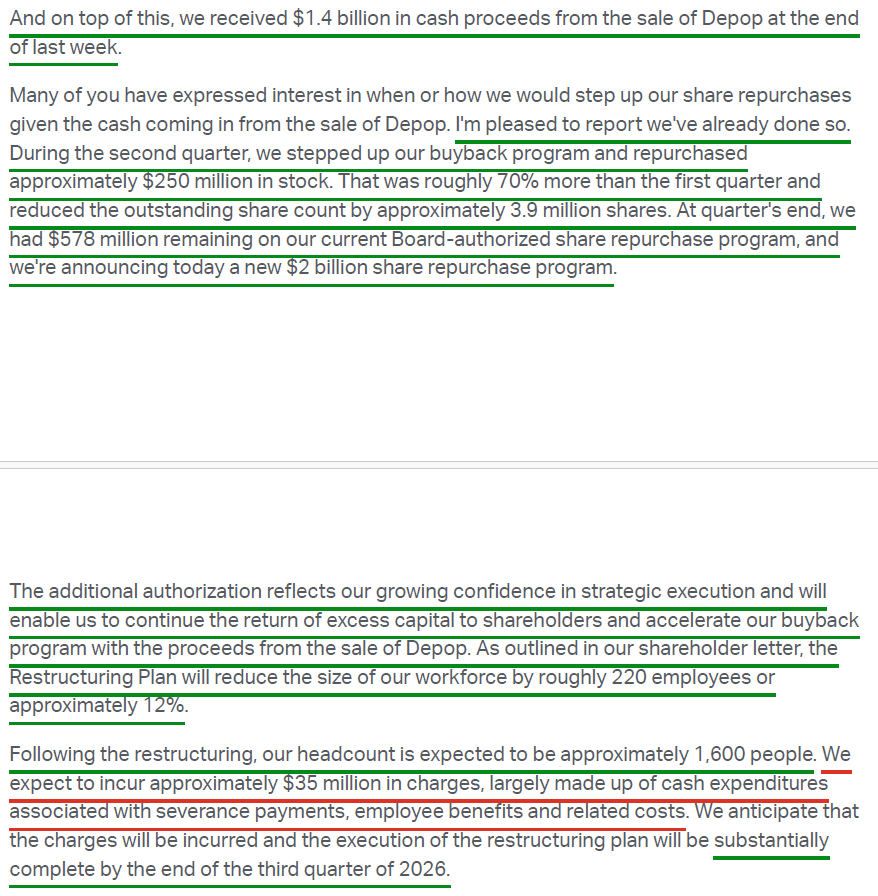
7) Etsy generated $165.9M of operating cash flow from continuing operations in Q2, bringing TTM operating cash flow to $657.4M (-4.7% Y/Y). Free cash flow came in at $158.1M for the quarter on a continuing operations basis, representing a conversion rate of 81% of adjusted EBITDA that ran roughly one-third above the prior-year rate. TTM free cash flow finished at $610.1M (-3.9% Y/Y).
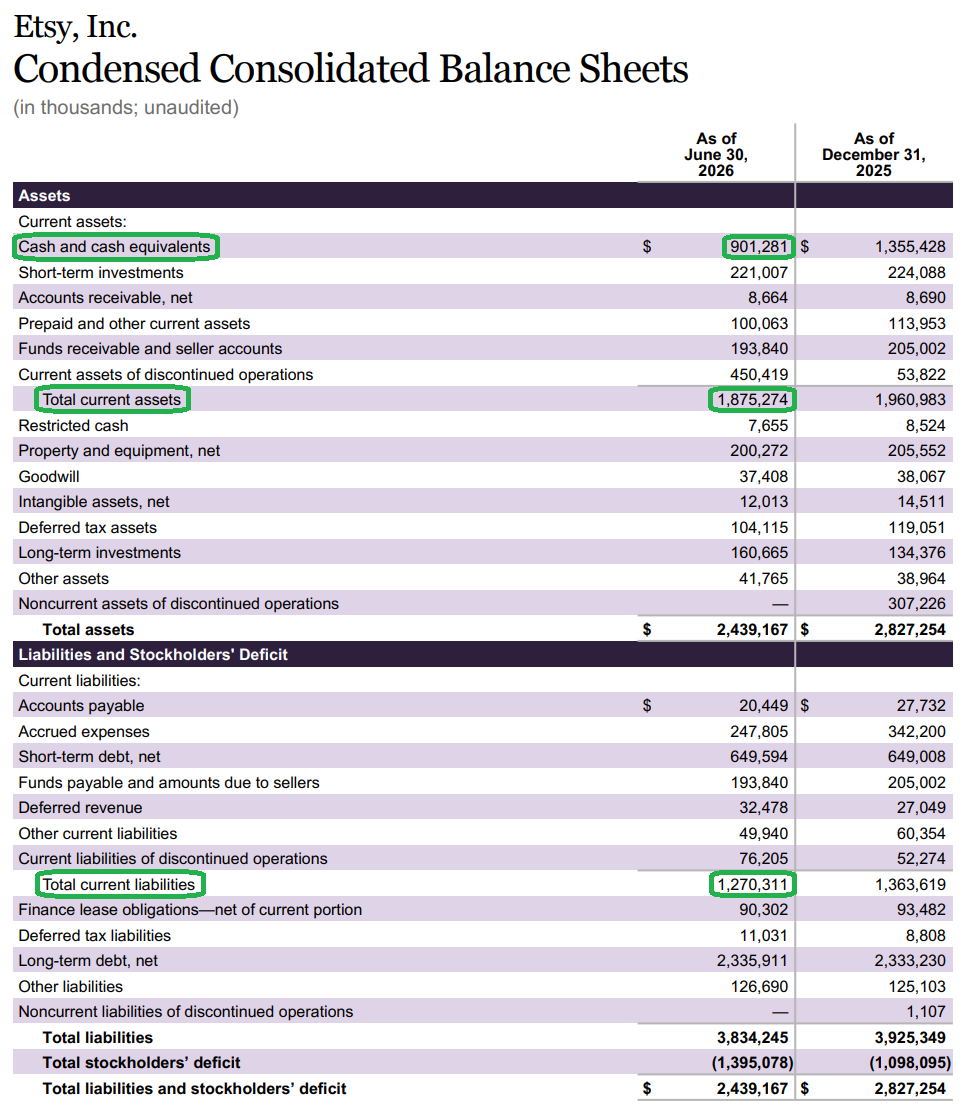
8) Etsy repurchased ~3.9M shares for $250M during Q2, roughly 70% more than Q1 and a significant step-up ahead of the $1.4B of cash from the Depop sale, which closed at the end of July and leaves plenty of dry powder alongside the $1.3B in cash and investments held at quarter-end. On top of the $578M remaining on the prior authorization, the Board announced a new $2B repurchase program, which management expects to use to further accelerate buybacks, seeing no better use for the Depop proceeds inside the business today.
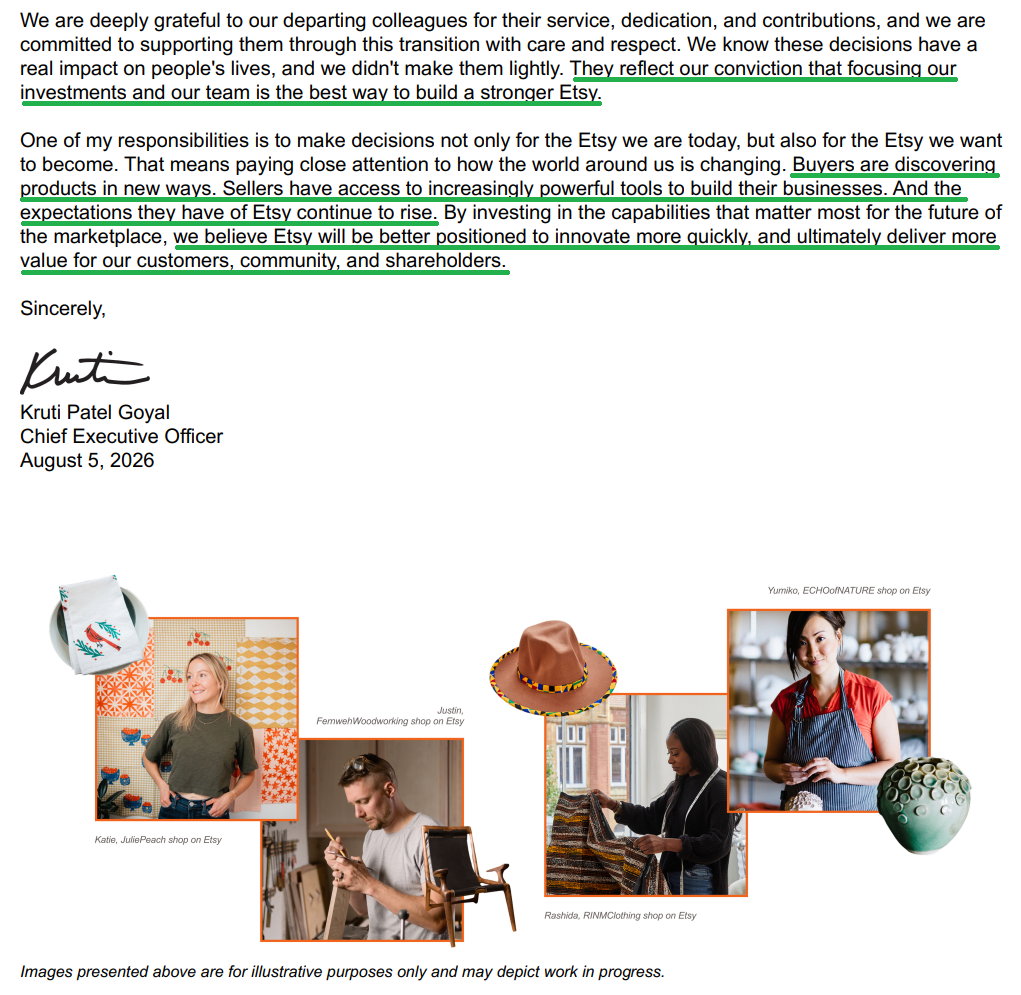
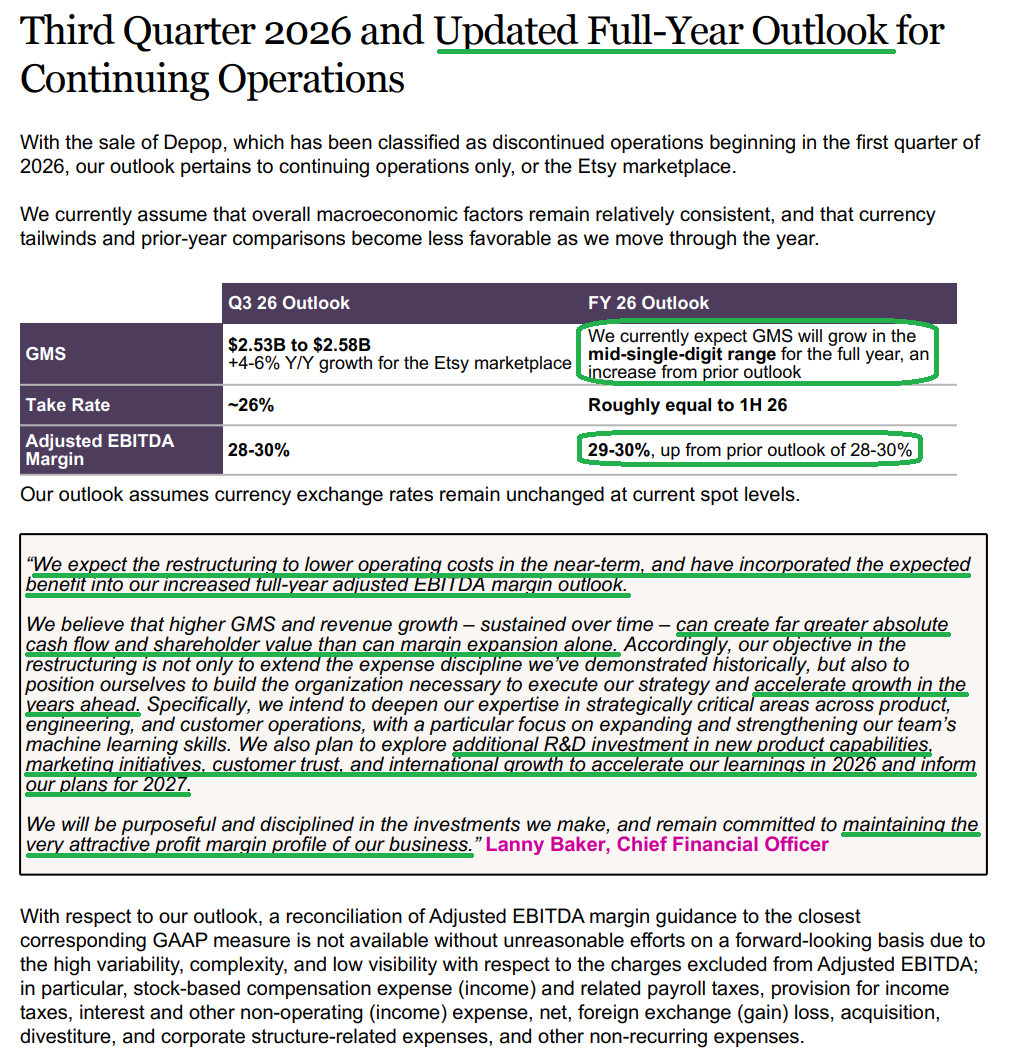
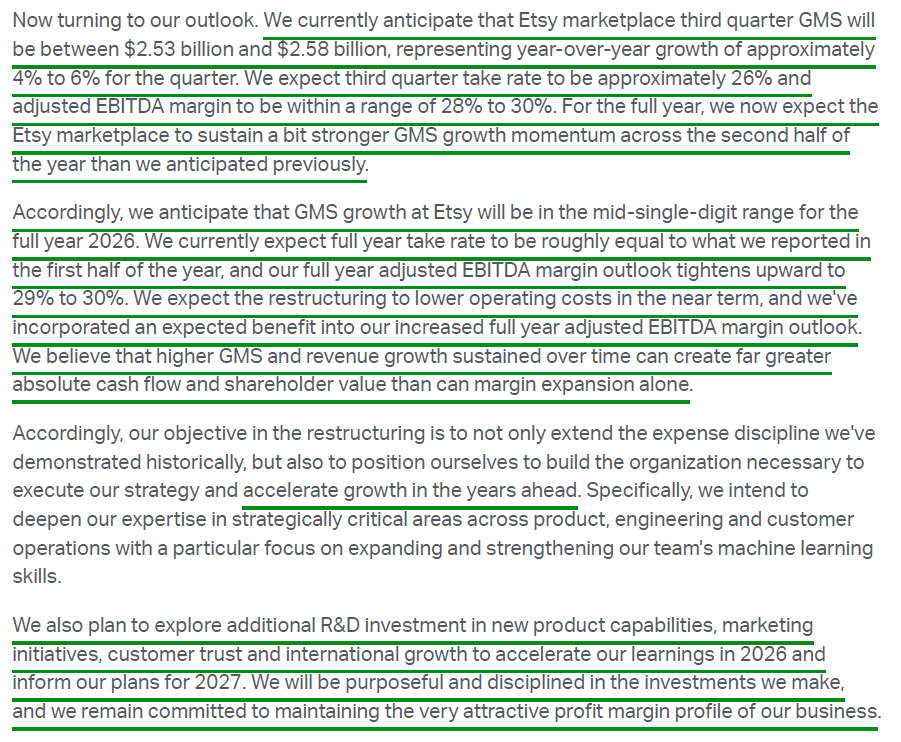
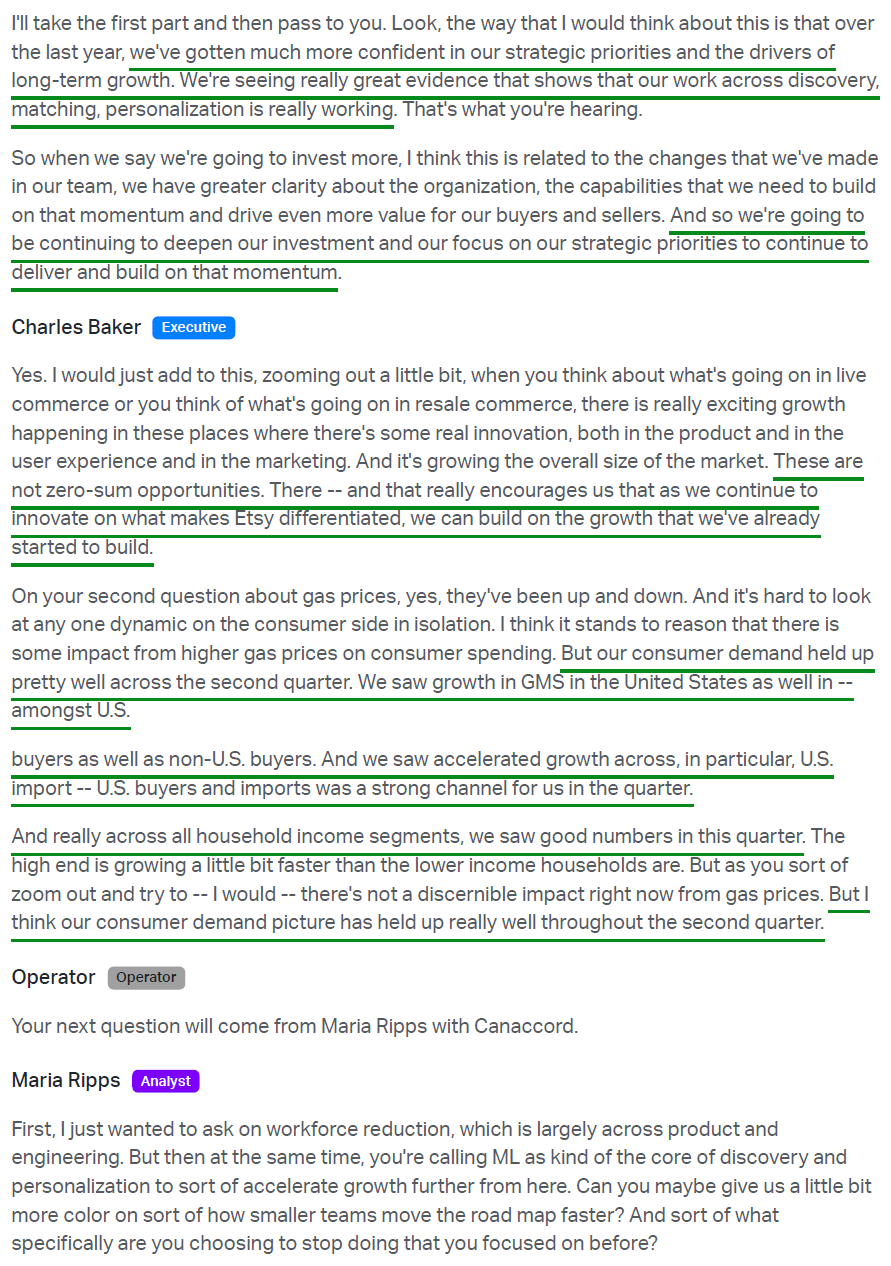
9) Alongside earnings, Etsy announced a restructuring that reduces headcount by ~220 employees, or ~12%, concentrated in product and engineering and taking headcount to ~1,600, with ~$35M in expected charges substantially complete by the end of Q3. Some of the savings will be reinvested into product, engineering, and customer operations talent, with management noting that the reorganization is not intended to structurally lift the long-term margin profile. The expected near-term savings are reflected in the raised full-year adjusted EBITDA margin outlook.
10) Management guided Q3 2026 Etsy marketplace GMS to $2.53B to $2.58B (+4% to +6% Y/Y), ahead of consensus of $2.49B, with a take rate of ~26% and an adjusted EBITDA margin of 28% to 30%. For the full year, GMS growth is now expected in the mid-single-digit range, an increase from prior guidance of low-single-digit growth, driven by expectations for stronger momentum across the second half than previously anticipated. Full-year take rate is expected to roughly equal 1H26 levels (25.8%), with adjusted EBITDA margin raised to 29% to 30% from 28% to 30%.
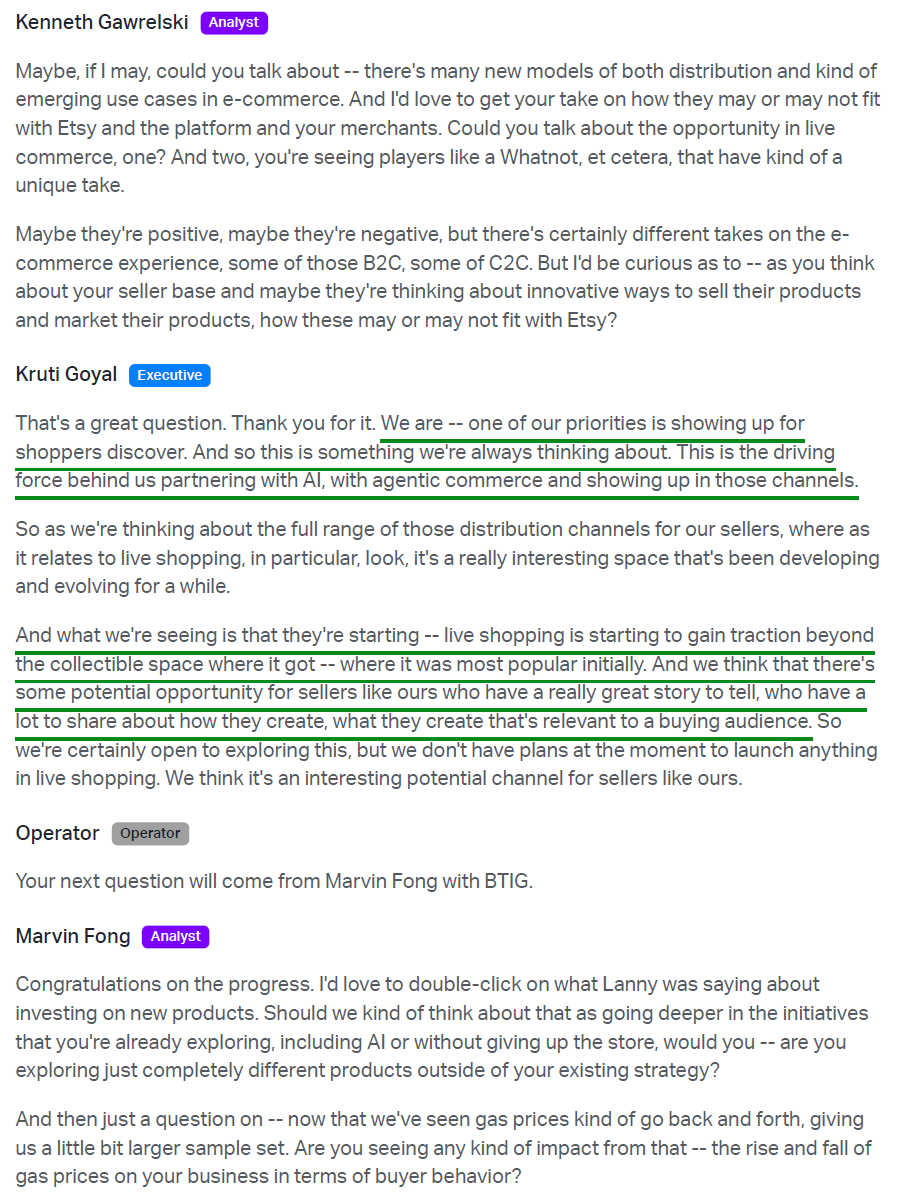
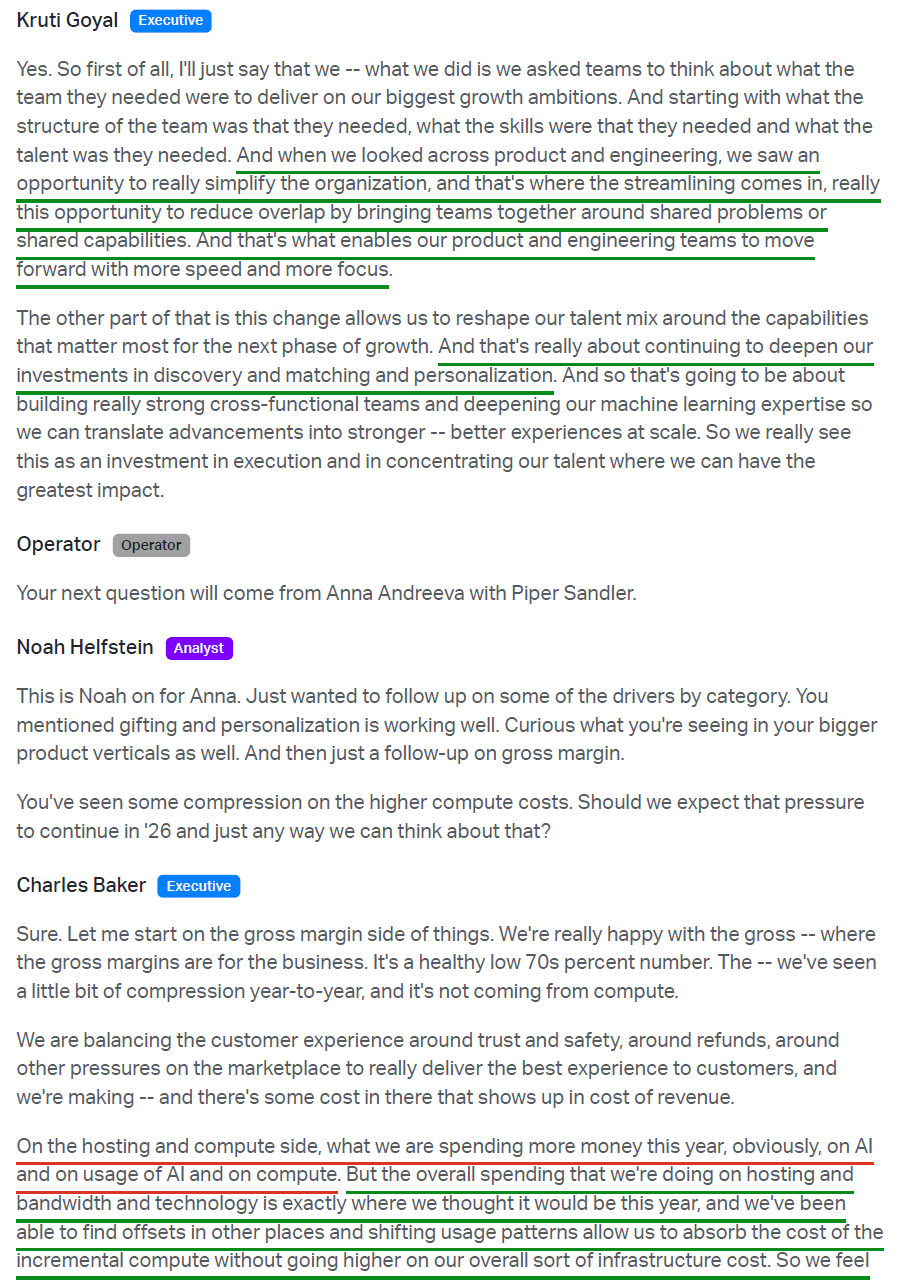
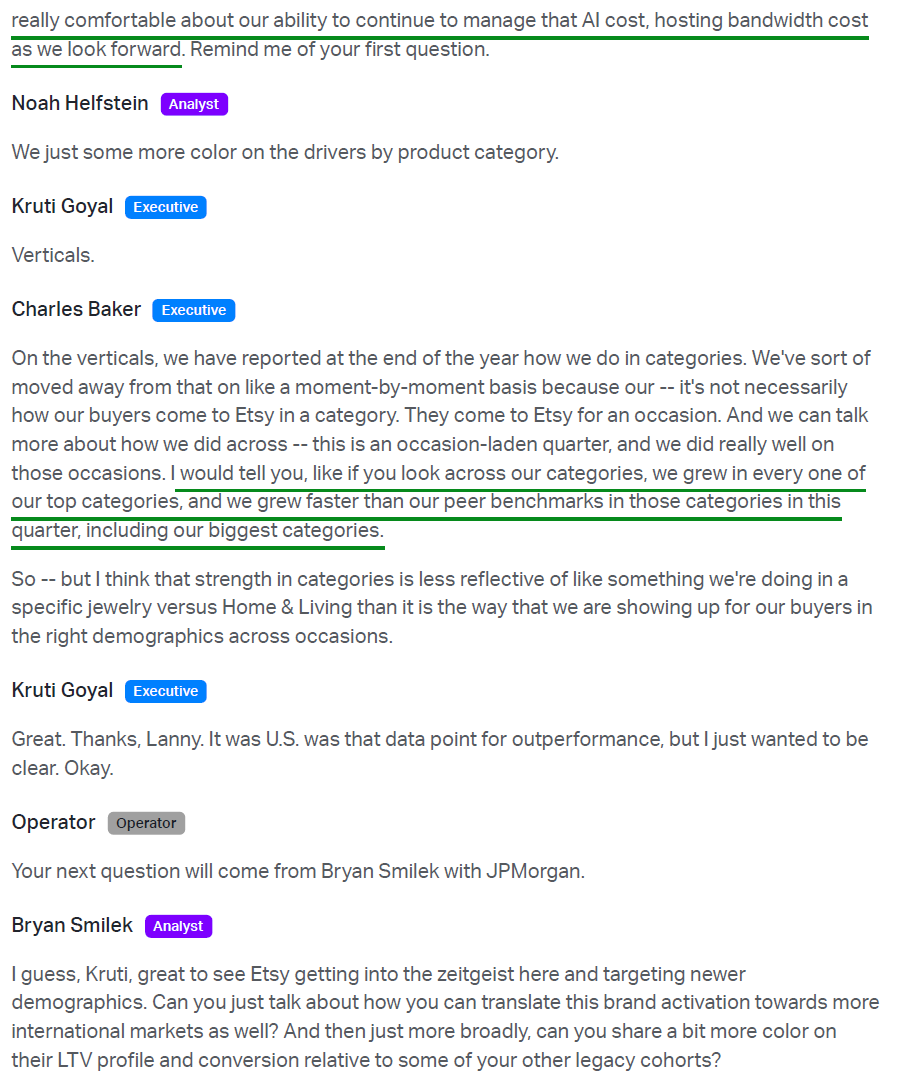
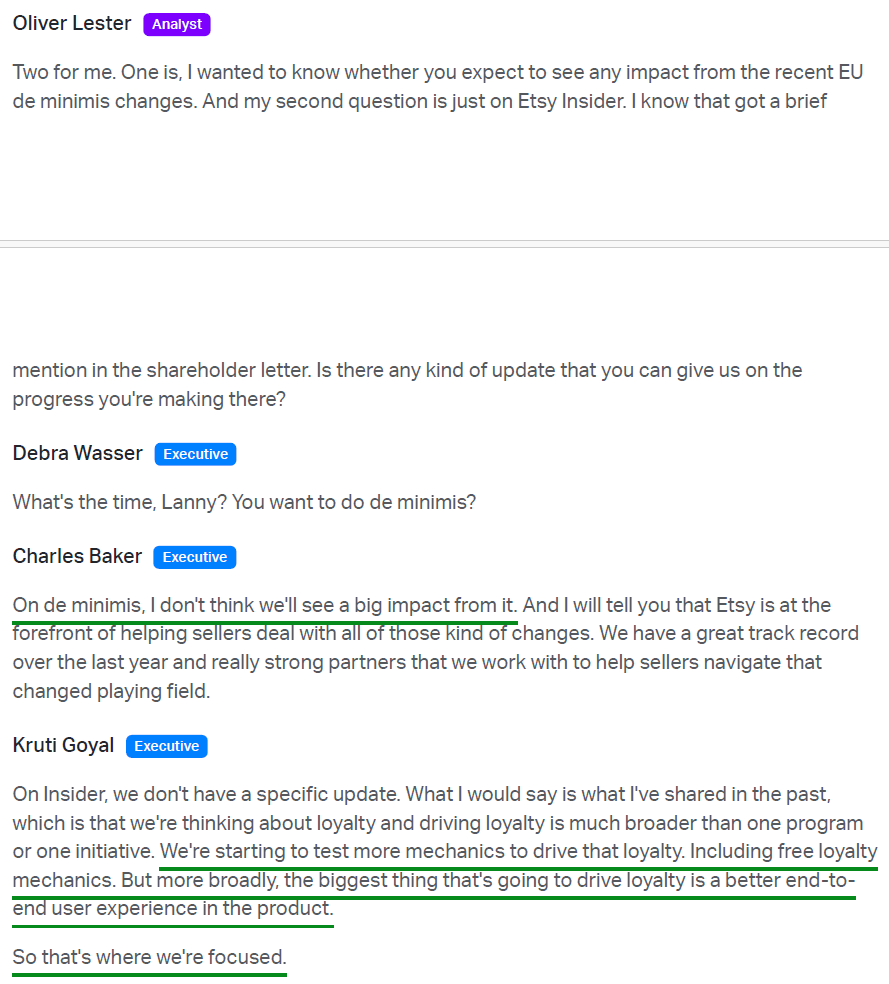
Earnings Call Highlights
Morningstar Analyst Note
General Market
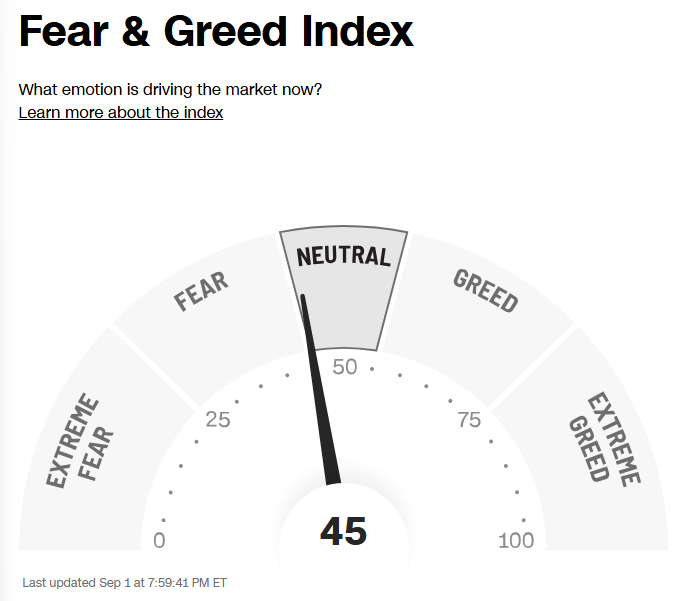
The CNN “Fear and Greed Index” ticked down to 45 this week from 59 last week. You can learn how this indicator is calculated and how it works here: (Video Explanation)
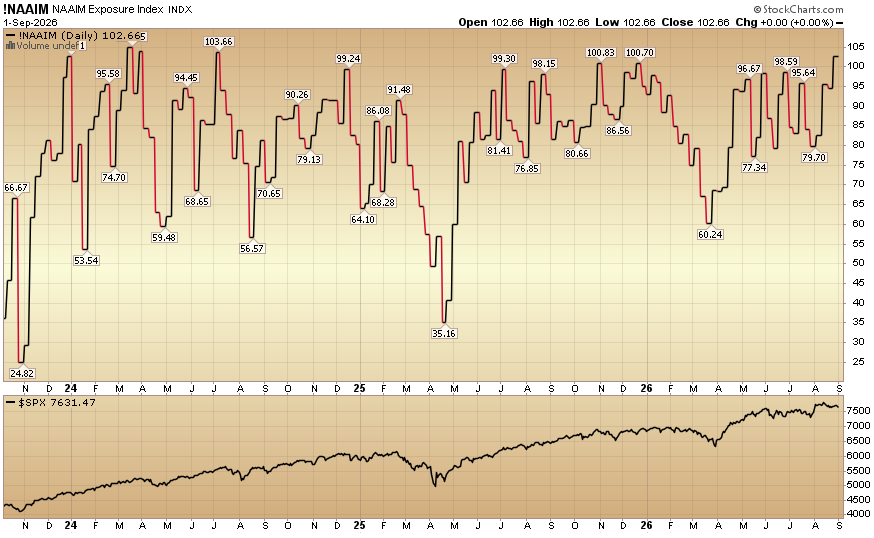
The NAAIM (National Association of Active Investment Managers Index) (Video Explanation) ticked up to 102.66% equity exposure this week from 79.70% last week.

Comments
Log in or sign up to join the conversation.